Author Topic: Digitizing rectangular grids of analysis points  (Read 4436 times)

Mike Matthews

  • Global Moderator
  • Professor
  • *****
  • Posts: 142
Digitizing rectangular grids of analysis points
« on: April 18, 2016, 09:23:39 AM »
I'm using the Rectangular Grid option to digitize analysis points and getting some weird results: I use the stage inrcement to step in the +ve x and y axes the required distance to give a 4x3 grid of points with a 20um spacing. The window shows 4 points in x and 3 in y as required but, when I press OK, the number of points transferred to the Automate window may only be 6 points (a 3x2 array). Increasing the array to a 5x4 can give the required 12 points (4x3), or 15 points (5x3). There doesn't sem to be any consistency.

On a related note, is there any chance of changing the way the grids are input? Working out the absolute stage co-ords of the grid corners to give me the grid size and spacing I want is not very convenient (especially wih the daft JEOL co-ordinate system). What I'd like to do is input the number of points and spacing, with the current position as either the center or corner of the grid and have the software work out the absolute co-ords for me.

John Donovan

  • Administrator
  • Emeritus
  • *****
  • Posts: 3304
  • Other duties as assigned...
    • Probe Software
Re: Digitizing rectangular grids of analysis points
« Reply #1 on: April 18, 2016, 06:07:42 PM »
I'm using the Rectangular Grid option to digitize analysis points and getting some weird results: I use the stage inrcement to step in the +ve x and y axes the required distance to give a 4x3 grid of points with a 20um spacing. The window shows 4 points in x and 3 in y as required but, when I press OK, the number of points transferred to the Automate window may only be 6 points (a 3x2 array). Increasing the array to a 5x4 can give the required 12 points (4x3), or 15 points (5x3). There doesn't sem to be any consistency.

On a related note, is there any chance of changing the way the grids are input? Working out the absolute stage co-ords of the grid corners to give me the grid size and spacing I want is not very convenient (especially wih the daft JEOL co-ordinate system). What I'd like to do is input the number of points and spacing, with the current position as either the center or corner of the grid and have the software work out the absolute co-ords for me.

Hi Mike,
Why type when you can just click the Update Start/Stop buttons?

But if I were you I'd use the Digitize Image feature.  Then you just click the 4 corners on an image and specify the spacing for the grid.  Yes, it's called Polygon Grid, but 4 points defines a quadrilateral!

Here's a link showing these grid acquisitions:

http://probesoftware.com/smf/index.php?topic=60.msg227#msg227

By the way, you can specify either the spacing or the number of points, but not both.

See the Digitize Traverse dialog for an example where I allow either, but not both.
john
« Last Edit: April 20, 2016, 09:16:18 AM by John Donovan »
John J. Donovan, Pres. 
(541) 343-3400

"Not Absolutely Certain, Yet Reliable"

Mike Matthews

  • Global Moderator
  • Professor
  • *****
  • Posts: 142
Re: Digitizing rectangular grids of analysis points
« Reply #2 on: April 19, 2016, 11:00:06 AM »
Thanks John, I am using the Update buttons, it's more that I most usually know the number and spacing of points I want rather than the absolute co-ords of the corners. Isn't this more common, or is it just me?

Any idea why the size of array stored to the position file is rarely the size of the array set in the digitze window? If I set (X,Y) I might get (X,Y-1), (X-1, Y) or (X-1,Y-1) but almost never (X,Y).

Mike

Probeman

  • Emeritus
  • *****
  • Posts: 2856
  • Never sleeps...
    • John Donovan
Re: Digitizing rectangular grids of analysis points
« Reply #3 on: April 19, 2016, 11:16:00 AM »
Thanks John, I am using the Update buttons, it's more that I most usually know the number and spacing of points I want rather than the absolute co-ords of the corners. Isn't this more common, or is it just me?

Any idea why the size of array stored to the position file is rarely the size of the array set in the digitze window? If I set (X,Y) I might get (X,Y-1), (X-1, Y) or (X-1,Y-1) but almost never (X,Y).

Mike

Hi Mike,
Again, if one specifies the number, the spacing is fixed based on that value. And visa versa. 

When you are down to small numbers of grid points, you're probably just seeing a rounding issue in terms of the number of "steps" to cover the specified area.

You might also want to try the Digitize Shotgun feature.  It's nice for coverage of a round area.


One simply specifies the number of points and the diameter of the area to cover with randomized points.
« Last Edit: April 12, 2020, 09:48:29 PM by John Donovan »
The only stupid question is the one not asked!

Probeman

  • Emeritus
  • *****
  • Posts: 2856
  • Never sleeps...
    • John Donovan
Re: Digitizing rectangular grids of analysis points
« Reply #4 on: April 19, 2016, 11:31:26 AM »
And then there's the Digitize Cluster feature as seen here:


where one can specify round or square areas as seen here:


and then digitize random points within a single sector as seen here:


or multiple sectors as seen here:


In this last example, it's the same number of points in total (100) as the previous single sector example, but each of the four sectors (shown in cyan), has exactly 25 points.

NIST had me add this feature many years ago for unbiased sampling...
« Last Edit: April 12, 2020, 09:48:58 PM by John Donovan »
The only stupid question is the one not asked!

Mike Matthews

  • Global Moderator
  • Professor
  • *****
  • Posts: 142
Re: Digitizing rectangular grids of analysis points
« Reply #5 on: April 20, 2016, 09:29:53 AM »
I've used the shotgun scatter and like how quick it is to just throw down a cluster of points, but at the moment I'm using low kV to measure C-coating thicknesses and want to make sure my spacing is constant to make sure I'm not hitting contamination rings from previous points - hence the grid. Your TDI analysis method is a great way of measuring how much of the C-coat I'm evaporating off! Is the Shotgun size parameter the diameter of the shotgun spread?

I understand what you're saying, that the software calculates the number of points from the spacing and co-ords I put in, what I'm saying is that I want it to be different - I would prefer to be able specify the number of points and the spacing and let the software work out the co-ords of the corners. That's how stage maps are set up in PI (and in the JEOL software), which to me is a more sensible way of doing it.

With the random number of points 'feature' I'm setting the stage increment in x and y to be the point spacing I want (20um), storing the start co-ord, then incrementing the x and y the number of steps I want in each direction. The x and y distances and the number of points given matches what I want (e.g. 4x3 array at the 20um spacing) when I update the end point co-ords. However, when I click OK to send the 12 co-ordinate sets to the position file I rarely get all 12 points, more usually I get 8 (4x2) or 9 (3x3) points. I've ended up setting 5x4 arrays on each sample, which give me 12, 15, 16 or (rarely) 20 points, and delete the surplus ones. It works, but it's not very elegant.

Probeman

  • Emeritus
  • *****
  • Posts: 2856
  • Never sleeps...
    • John Donovan
Re: Digitizing rectangular grids of analysis points
« Reply #6 on: April 20, 2016, 10:11:29 AM »
I've used the shotgun scatter and like how quick it is to just throw down a cluster of points, but at the moment I'm using low kV to measure C-coating thicknesses and want to make sure my spacing is constant to make sure I'm not hitting contamination rings from previous points - hence the grid. Your TDI analysis method is a great way of measuring how much of the C-coat I'm evaporating off! Is the Shotgun size parameter the diameter of the shotgun spread?

Hi Mike,
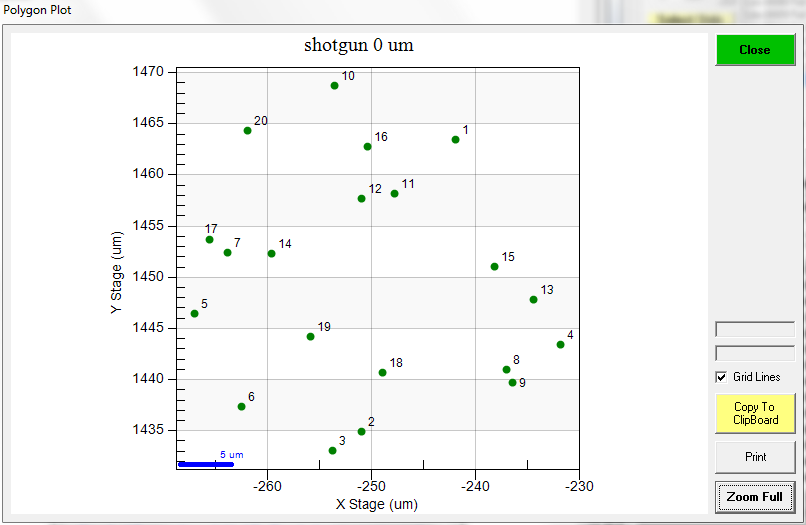
Yes, the shotgun size is the shotgun spread.  If you are just trying to avoid the digitized points touching each other, simply set the beam size to the spacing you want and the software will digitize accordingly.  For example, here are 20 points digitized using a zero micron beam size:


And here is again 20 points, but this time a 5 um beam size was specified in the Analytical Conditions dialog:


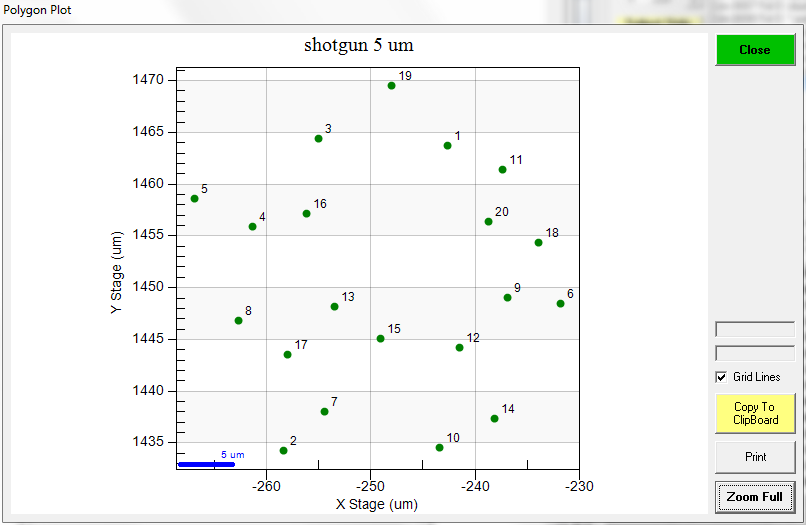
When you actually acquire the points, you can run them with whatever beam size you want.

I understand what you're saying, that the software calculates the number of points from the spacing and co-ords I put in, what I'm saying is that I want it to be different - I would prefer to be able specify the number of points and the spacing and let the software work out the co-ords of the corners. That's how stage maps are set up in PI (and in the JEOL software), which to me is a more sensible way of doing it.

With the random number of points 'feature' I'm setting the stage increment in x and y to be the point spacing I want (20um), storing the start co-ord, then incrementing the x and y the number of steps I want in each direction. The x and y distances and the number of points given matches what I want (e.g. 4x3 array at the 20um spacing) when I update the end point co-ords. However, when I click OK to send the 12 co-ordinate sets to the position file I rarely get all 12 points, more usually I get 8 (4x2) or 9 (3x3) points. I've ended up setting 5x4 arrays on each sample, which give me 12, 15, 16 or (rarely) 20 points, and delete the surplus ones. It works, but it's not very elegant.

Yes, I understand.  Again you might try the Digitize Shotgun or Digitize Cluster method because it will digitize exactly the number of points you want. 

I mean I could completely redesign the Digitize Rectangular Grid dialog, but that will take time and you're the first person to complain about it.  Honest!

So I tried to reproduce your situation and I see the issue now. The code is including the points that land on the boundary.  So if you specify an 80 x 60 size grid with 20 um spacing using the Stage Increment buttons (because 4 x 20 um = 80 um and 3 x 20 um = 60 um), you will get this:


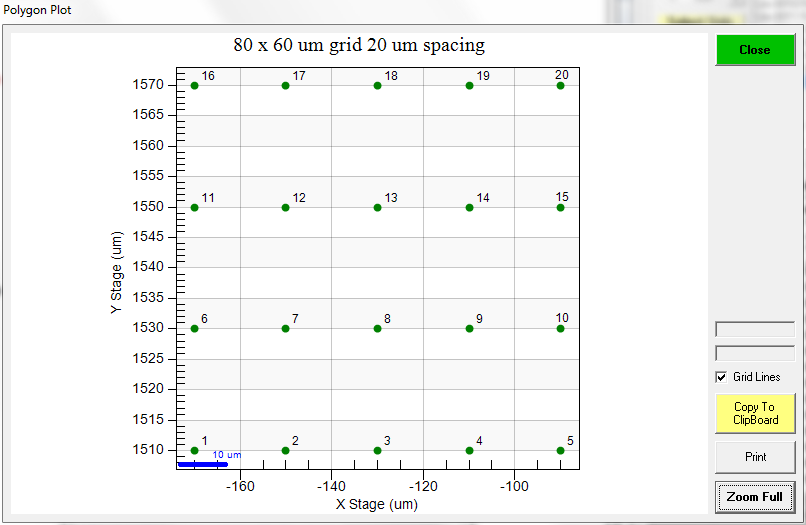
That gives you the 5 x 4 grid you mention above.  Why? Because the code includes points on the boundary.  If you want exactly 4 x 3 points with a 20 um spacing simply set the grid size a little smaller, say 75 x 55 um, again with the 20 um spacing and you will get this:


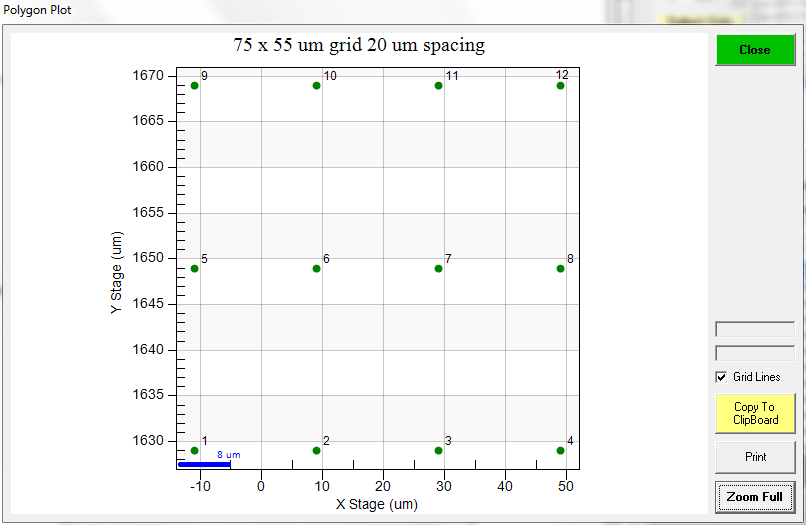
Now you have the 4 x 3 points with a 20 um spacing that you wanted in the first place.  How's that?

Or just use the Digitize Shotgun or Digitize Cluster features with a 20 um beam size...
« Last Edit: April 12, 2020, 09:49:25 PM by John Donovan »
The only stupid question is the one not asked!

Mike Matthews

  • Global Moderator
  • Professor
  • *****
  • Posts: 142
Re: Digitizing rectangular grids of analysis points
« Reply #7 on: April 21, 2016, 12:15:33 AM »
Thanks John, the beam size method to control the shotgun spread sounds great!

Philipp Poeml

  • Professor
  • ****
  • Posts: 222
Re: Digitizing rectangular grids of analysis points
« Reply #8 on: April 21, 2016, 01:02:19 AM »
Personally I am a big fan of driving either to the center or 2 corners and then just specify how many points/step size between points and then let the software do the rest. If it could be done, I would not mind!

John Donovan

  • Administrator
  • Emeritus
  • *****
  • Posts: 3304
  • Other duties as assigned...
    • Probe Software
Re: Digitizing rectangular grids of analysis points
« Reply #9 on: April 21, 2016, 08:06:54 AM »
Personally I am a big fan of driving either to the center or 2 corners and then just specify how many points/step size between points and then let the software do the rest. If it could be done, I would not mind!

I guess I am not appreciating the difference.  In the Digitize Rectangular Grid dialog, right now you can drive to the two corners (using the joystick, the stage increment buttons, or typing in the coordinates), click the Update button for each corner, specify the spacing and you have it.


In addition one can move the grid to any new position using the Confirm options in Automate! and even delete selected points using the Delete Selected Positions button and then Plot them using the Plot! button.

The only difference I see is that the current method relies on specifying the area (using corners) and the spacing, rather the specific number of points.  Of course the dialog does actually tell you what the number of points will be, so I don't really get the concern.

Anyway, you have at least 3 ways to space your points so hopefully that will hold you for the time being. See you in Madison!
« Last Edit: April 12, 2020, 09:49:39 PM by John Donovan »
John J. Donovan, Pres. 
(541) 343-3400

"Not Absolutely Certain, Yet Reliable"

Ben Buse

  • Professor
  • ****
  • Posts: 499
Re: Digitizing rectangular grids of analysis points
« Reply #10 on: September 14, 2023, 02:17:27 AM »
Hi,

Can you produce a contour intensity map of grid data?

Thanks

Ben

Ben Buse

  • Professor
  • ****
  • Posts: 499
Re: Digitizing rectangular grids of analysis points
« Reply #11 on: September 14, 2023, 04:50:19 AM »
Hi,

Can you produce a contour intensity map of grid data?

Thanks

Ben

Its a polygon defined grid of data

Here's it plotted using gnuplot and surfer

Being JEOL the positive and negative is wrong


Trick with surfer:
When polygon defined grid data use 'blank grid outside convex hull of data'
Nearest neighbour - essentially gives square of colour intensity for each spot analysis


gnuplot using
Code: [Select]
cd 'Z:\PFEData\Ben\130923'
set key off
splot 'ppm.txt' using 1:2:3 with points palette pointsize 3 pointtype 7 
set view map
set size ratio 1
splot 'cuppm.txt' using 1:2:3 with points palette pointsize 3 pointtype 7
set palette defined (0 'white', 0.25 'blue', 0.5 'green', 0.75 'yellow', 1 'red')
set logscale cb
splot 'cuppm.txt' using 1:2:3 with points palette pointsize 3 pointtype 7

Not contoured using pm3d as insufficient data

Text file is tab delimited

Code based on
https://psy.swansea.ac.uk/staff/carter/gnuplot/gnuplot_3d.htm
https://stackoverflow.com/questions/20569110/gnuplot-logarithmic-color-box-with-plot-palette

To reverse gnuplot axes
Code: [Select]
set xrange[*:*]reverse
set yrange[*:*]reverse

Similar surfer tick box to reverse axes
« Last Edit: September 14, 2023, 08:44:44 AM by Ben Buse »

John Donovan

  • Administrator
  • Emeritus
  • *****
  • Posts: 3304
  • Other duties as assigned...
    • Probe Software
Re: Digitizing rectangular grids of analysis points
« Reply #12 on: September 14, 2023, 09:43:53 AM »
Hi,

Can you produce a contour intensity map of grid data?

Thanks

Ben

Yes, Surfer can.

To make things easy, if you have a set of points in Probe for EPMA that you want to grid and contour, use this output method from the Output | Output Standard and Unknown XY Plots menu and check the SURFER.BAS file checkbox and the other selections:


Then open the BAS file in the Surfer Scripter application and run it (note it must be the Scripter app that comes with Surfer, not the Scripter app that comes with Grapher).  It will produce a bunch of output types including contour plots.

Once those are done it should save the project to a SRF file which you can then open and customize as desired.
« Last Edit: September 14, 2023, 09:49:42 AM by John Donovan »
John J. Donovan, Pres. 
(541) 343-3400

"Not Absolutely Certain, Yet Reliable"

Probeman

  • Emeritus
  • *****
  • Posts: 2856
  • Never sleeps...
    • John Donovan
Re: Digitizing rectangular grids of analysis points
« Reply #13 on: September 16, 2023, 11:03:04 AM »
There is a random points grid file example provided with Probe for EPMA. Here are the instructions to create contour and other plot types using the supplied script in Golden Software's Surfer Scripter app:

1. Open the Golden Software Surfer Scripter app (not the Grapher Scripter app!) from the Start menu. Then browse to the example script which is found in the C:\UserData\SurferData folder and called XYSCAN2.BAS (the XYSCAN.BAS is for Surfer version prior to v. 7 of Surfer).


2. Next click the "play" button to start the script and the first output type will be created which is the contour plot:


Then the image plot which i now notice needs to have the shaded relief option turned off in the script since a while back Golden combined the shaded relief and image plot types (see if you can find the option to get a color image as one expects!):


Here's an example of an "image" plot with the shaded relief feature turned off in the Surfer script:

https://probesoftware.com/smf/index.php?topic=73.msg5130#msg5130

Note that if you decide to modify the example script please save it to a new file name so it doesn't get overwritten the next time you update Probe for EPMA.  Then it creates a 3D surface plot (it displayed each plot for 8 seconds before outputting the next element...


Finally it output a a shaded relief plot (which by turning off the shaded relief option is how you get a normal looking color image):


3. Then note that each plot is output to a separate Surfer project file as shown here which can be opened in the Surfer app:


So you can customize your output further in the Surfer app itself (or one can edit the scripts yourself).

Questions?
« Last Edit: September 16, 2023, 12:47:19 PM by Probeman »
The only stupid question is the one not asked!

John Donovan

  • Administrator
  • Emeritus
  • *****
  • Posts: 3304
  • Other duties as assigned...
    • Probe Software
Re: Digitizing rectangular grids of analysis points
« Reply #14 on: September 17, 2023, 11:08:21 AM »
Then the image plot which i now notice needs to have the shaded relief option turned off in the script since a while back Golden combined the shaded relief and image plot types (see if you can find the option to get a color image as one expects!):


Here's an example of an "image" plot with the shaded relief feature turned off in the Surfer script:

https://probesoftware.com/smf/index.php?topic=73.msg5130#msg5130

Note that if you decide to modify the example script please save it to a new file name so it doesn't get overwritten the next time you update Probe for EPMA.  Then it creates a 3D surface plot (it displayed each plot for 8 seconds before outputting the next element...

I think Probeman expects too much from the average EPMA user...

The missing script code to turn off "hill shading" in the color flood plots (starting in v 13 of Golden Software's Surfer app) in the example XYSCAN2.BAS script is here:

Code: [Select]
' For compatibility with Surfer v. 13, turn off hill shading and interpolate pixels
  If Val(Left$(SurferApp.Version, 2)) >= Val("13") Then
  SurferImageMap.HillShading = False
  SurferImageMap.InterpolatePixels = False
  End If

Adding the above script code to the color flood image section in XYSCAN2.BAS now produces this output:


But we also noticed that there are several other features that should be updated in this old script (such as a JEOL stage axes inversion), so that's what we've done. We've modified the example script that is distributed and that version can now be downloaded using the Help | Update Probe for EPMA menu as usual.
« Last Edit: September 17, 2023, 01:27:01 PM by John Donovan »
John J. Donovan, Pres. 
(541) 343-3400

"Not Absolutely Certain, Yet Reliable"