As many of you may know, Probe for EPMA allows one to acquire discrete analysis points distributed over an irregular specified area. This irregular area or "polygon mapping" performs a fully quantitative analysis at each point using a fixed beam although the data can be acquired using the "Use Beam Deflection" mode option also.
The advantage of the method is that for high sensitivity x-ray mapping where the analysis position may be exposed to the beam for a significant interval, the full time dependent intensity (TDI) correction can be applied to each analysis unlike normal beam or stage scan x-ray mapping. In addition a blank correction for improved accuracy can also be performed for simple matrices and for complex matrices, the multi-point background correction can also be performed.
The disadvantage is that the method is time consuming for short counting times (pixel dwell times less than 1 or 2 seconds). But because the MAN background correction may also be utilized, trace elements can be mapped accurately down to 100 PPM levels or less without the need for off-peaks measurements to save time.
Generally these "point maps" are of fairly low spatial resolution (a limited number of total pixels) due to the time consuming nature of the method with its attendant stage and spectrometer overhead, but the sensitivity is only limited by one's time and/or money! Seen here is a Ti map in quartz where two spectrometer were tuned to Ti and counted with on-peak backgrounds for 300 sec and 150 sec on each off-peak (15 keV, 200 nA, 20 um):
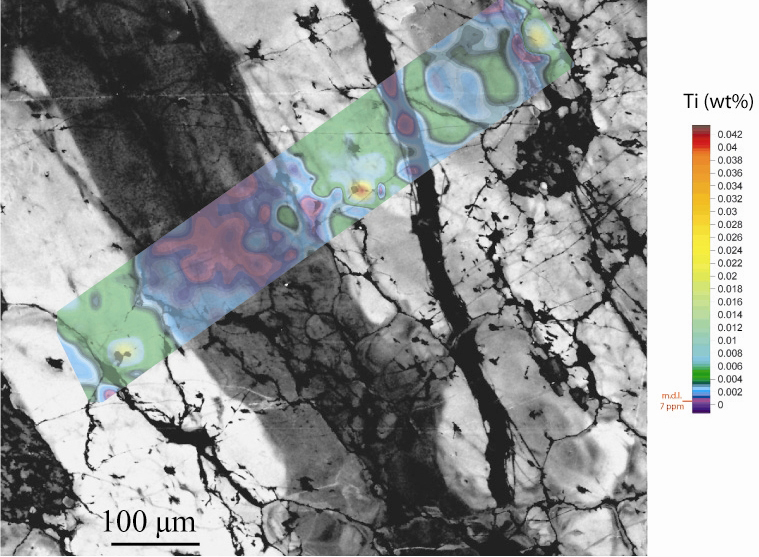
Because of they are spatially sparse, the 395 data points were fitted and smoothed using Golden Software's Surfer software which most users of Probe Software already have for presentation. The fact that detection limits of 6 - 7 PPm were obtained is testimony to the efficacy of the technique though the data acquisition took the better part of a several days.
This data was presented in the Am. Min. paper attached at the end of this post.
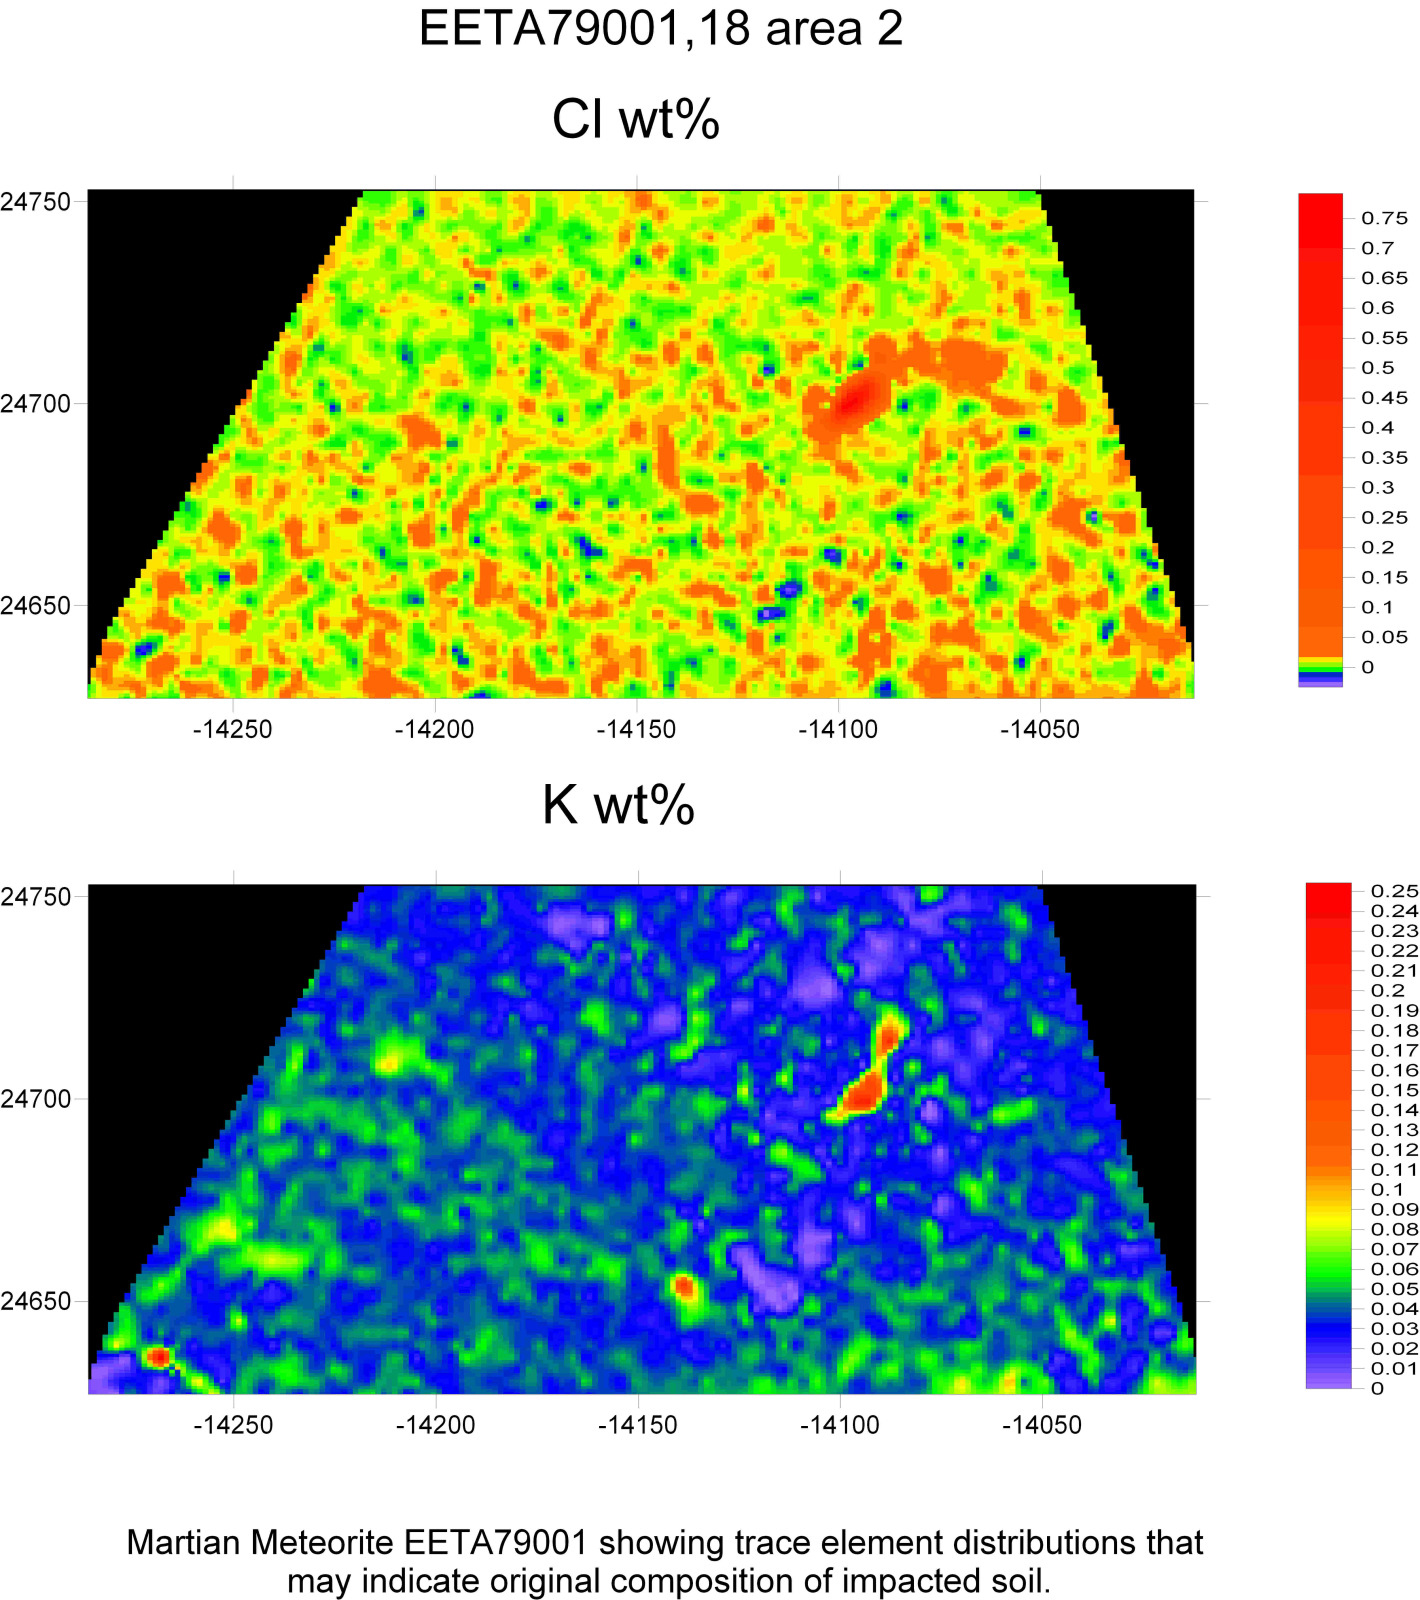
Higher spatial resolution can also be achieved with this technique by increasing the number of points and reducing the counting time to a minimum, though still around 1 sec per pixel as shown here in these scans of glass in a Martian meteorite from NASA provided by Christian Schrader:
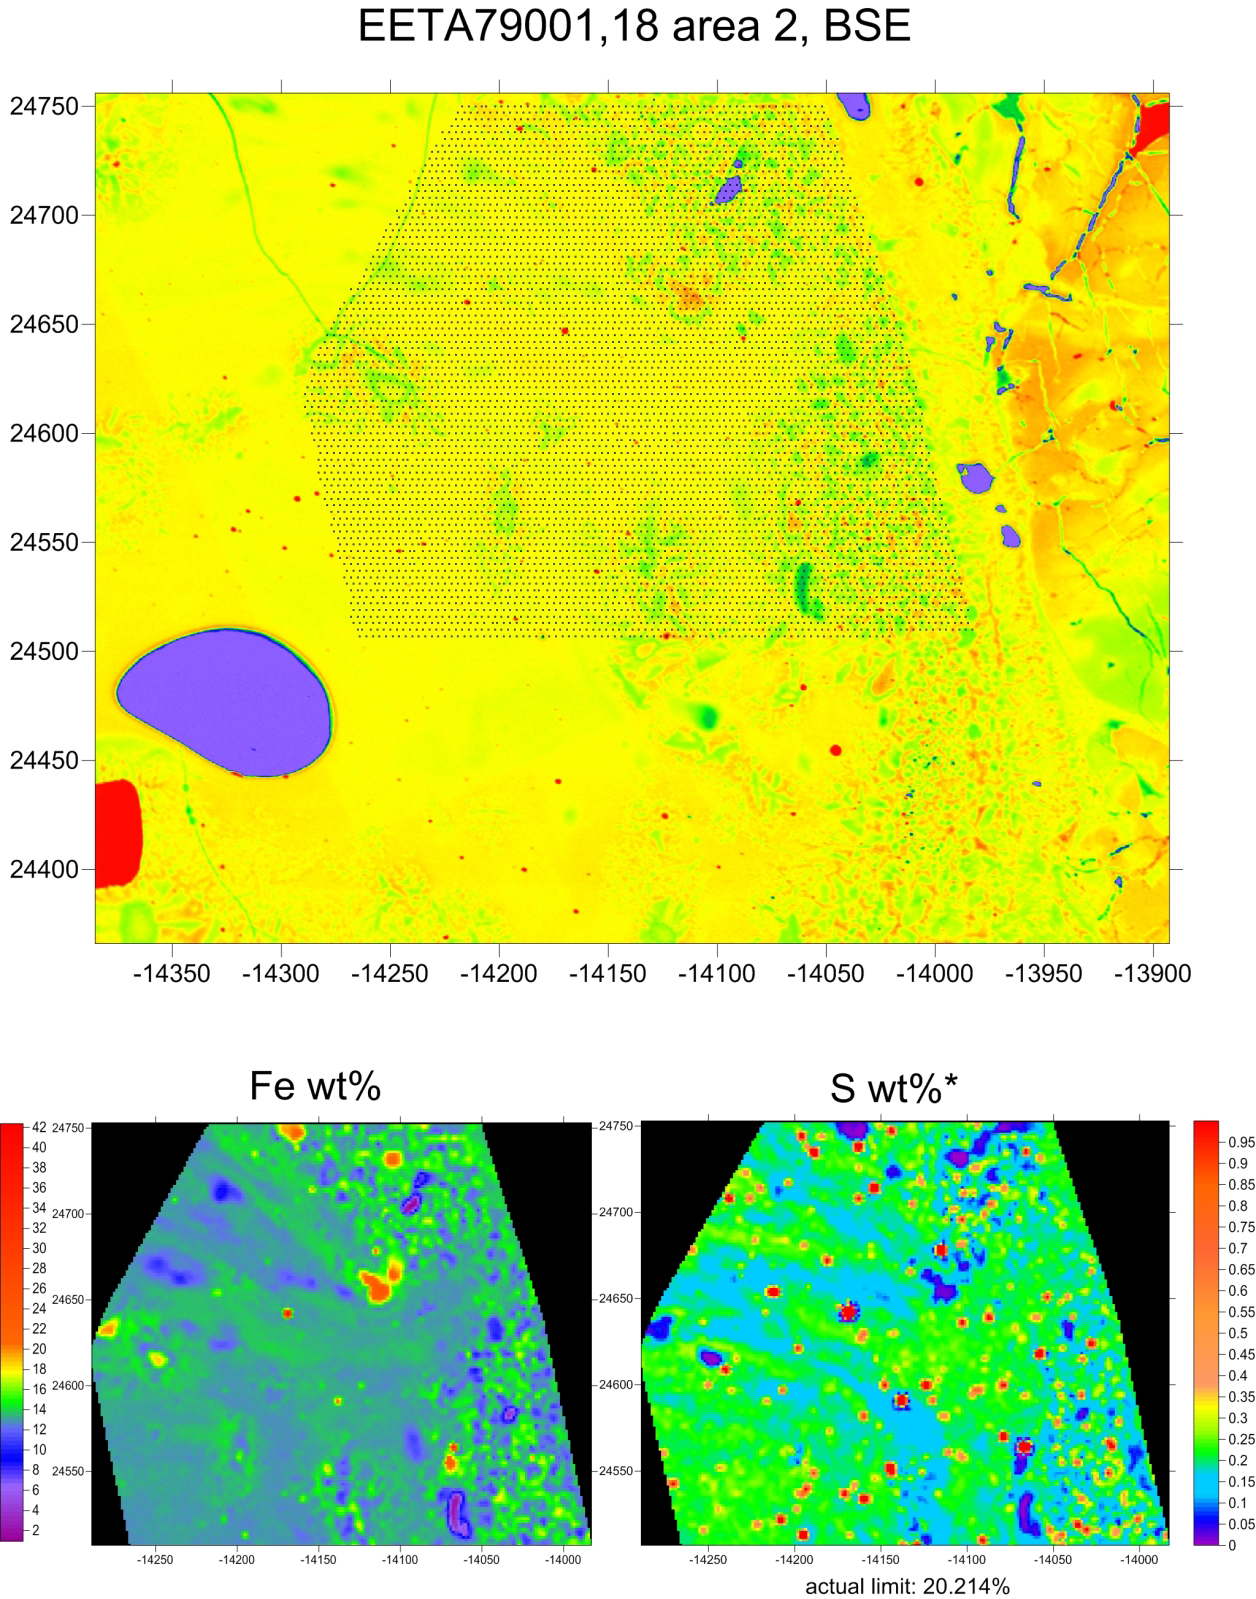
And these point analysis maps can be overlain on BSE images for reference as seen here:
Note that one can specify the digitized points to acquire using either the Digitize Image dialog or the Polygon grid dialog as shown here:
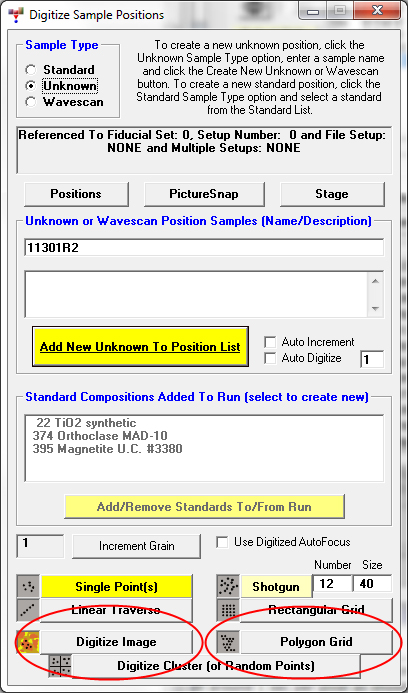
Generally the Digitize Image feature works best with small areas that can be captured in a single BSE image, while the Polygon Grid feature works best with larger areas that may require a Z tilt correction.

 To see the latest forum posts scroll to the bottom of the main page and click on the View the most recent posts on the forum link
