Author Topic: Your "friend" the List Report button  (Read 3419 times)

Probeman

  • Emeritus
  • *****
  • Posts: 2858
  • Never sleeps...
    • John Donovan
Your "friend" the List Report button
« on: July 22, 2014, 12:46:42 PM »
The List Report button seen in the Analyze! windows as shown here:


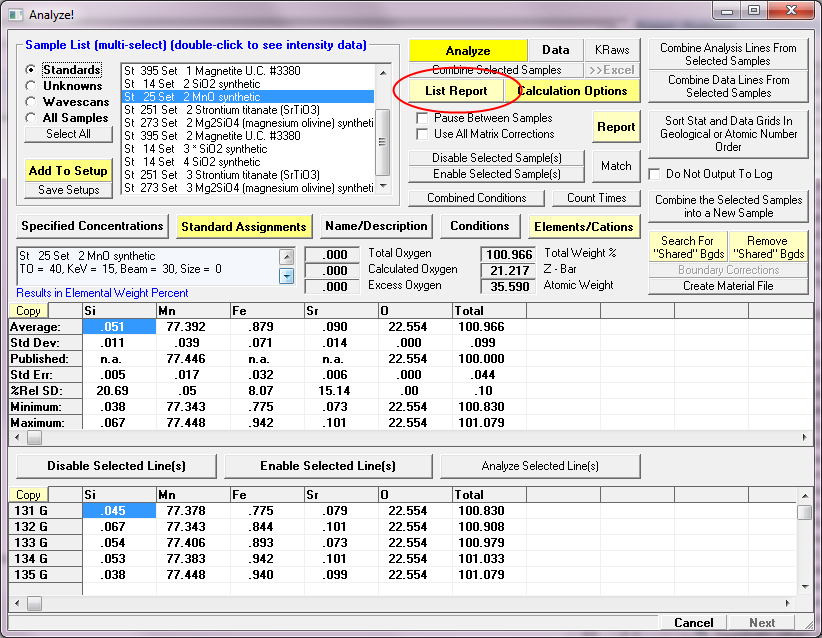
is your "friend". Why do I say this?  Because it can be very helpful to see if you have some anomalous standard intensity data in the run due to instrument drift or bad acquisitions (holes, epoxy, etc.) which is causing quantification problems.

The following image shows the output from a run with four standard sets for Ti Ka and Ag La:


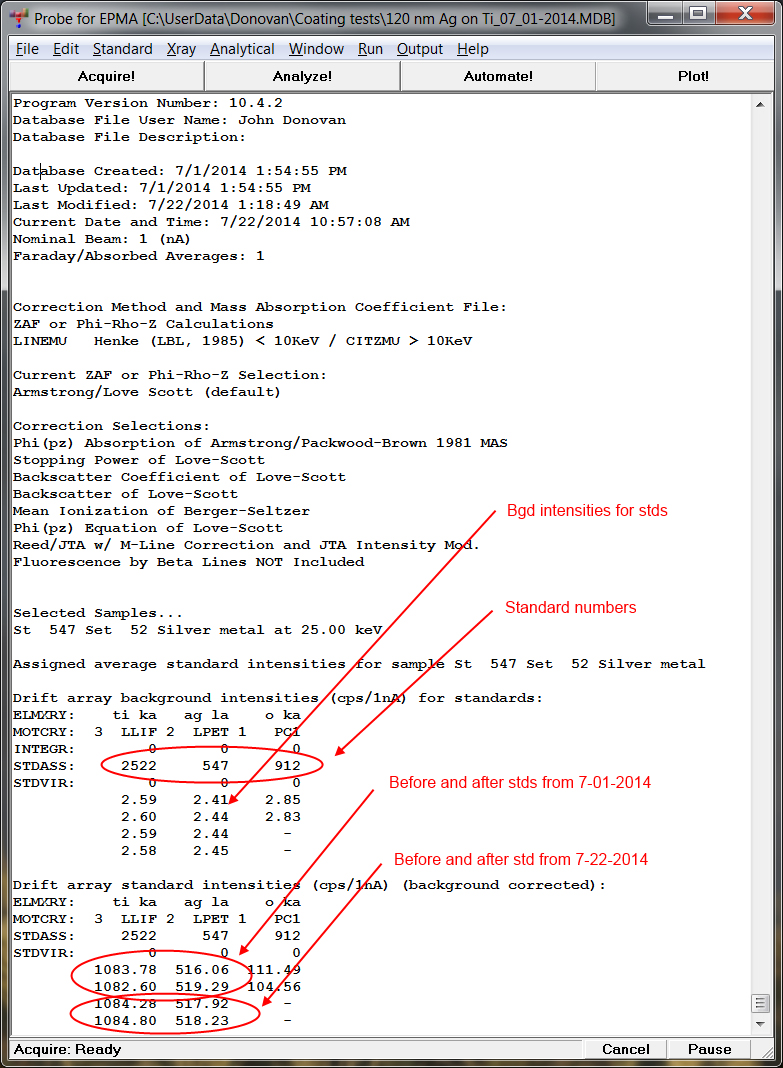
The first two standard sets were acquired around 7/2/2014, the second two sets were acquired around 7/23/2014 about 3 weeks later after extensive usage. The second set used the same parameters, but with just a quick re-peak of the spectrometer Bragg angle.

As can be seen, the amount of drift during those 3 weeks was insignificant and therefore good to know!

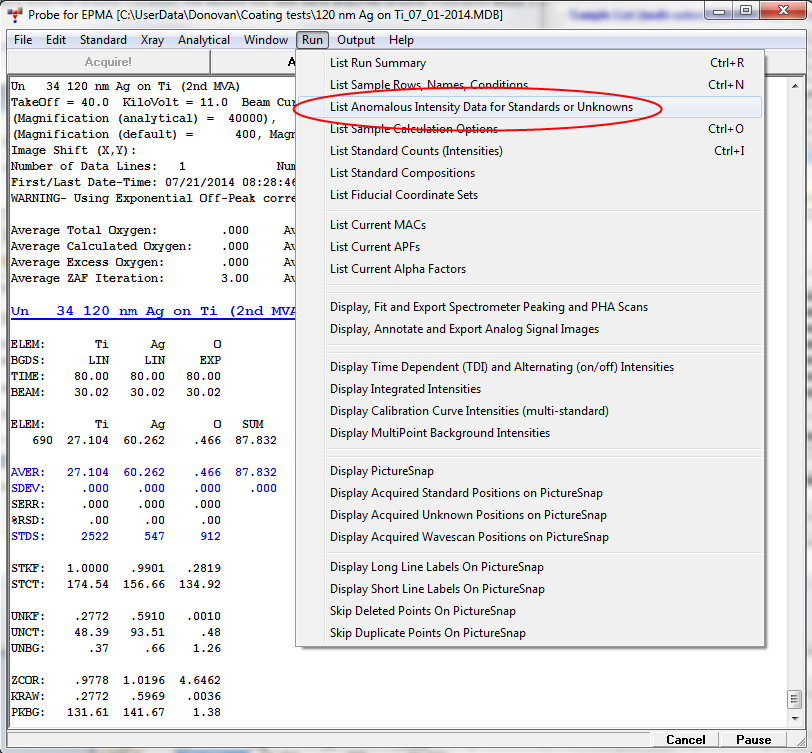
This Report button can be used in conjunction with the the Run | List Anomalous Intensity Data For Standards or Unknowns menu seen here:


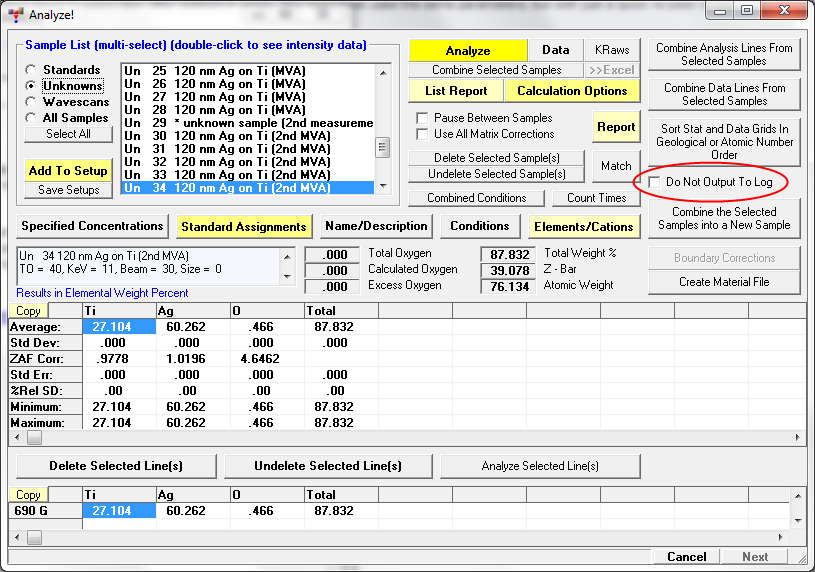
Note that if you don't want the Report button or Run | List Anomalous Intensity Data For Standards or Unknowns menu output to scroll off the screen when viewing Analyze! data, one may check this box in the Analyze! window:

« Last Edit: May 11, 2015, 01:32:55 PM by John Donovan »
The only stupid question is the one not asked!

John Donovan

  • Administrator
  • Emeritus
  • *****
  • Posts: 3304
  • Other duties as assigned...
    • Probe Software
Re: Your "friend" the Report button
« Reply #1 on: May 11, 2015, 01:30:14 PM »
Note that the latest version of Probe for EPMA now displays the EDS elements when they are present and the List Report button is clicked as seen here:

Assigned average standard intensities for sample St   25 Set   2 MnO synthetic

Drift array background intensities (cps/1nA) for standards:
ELMXRY:    si ka   mn ka   fe ka   sr la
MOTCRY:  4   TAP 3  LPET 0   EDS 0   EDS
INTEGR:        0       0       0       0
STDASS:       14      25     395     251
STDVIR:        0       0       0       0
            1.33   10.75     .00     .00
            1.34   33.98     .00     .00
              -       -       -      .00

Drift array standard intensities (cps/1nA) (background corrected):
ELMXRY:    si ka   mn ka   fe ka   sr la
MOTCRY:  4   TAP 3  LPET 0   EDS 0   EDS
STDASS:       14      25     395     251
STDVIR:        0       0       0       0
          756.90 2088.47  401.09  851.12
          765.85 2063.38  402.18  869.12
              -       -       -   876.58


The EDS backgrounds are zero in this example because Thermo only returns the net intensities and not the calculated background intensities. But do note that the EDS standard intensities are drift corrected in time just like the WDS elements.
« Last Edit: May 11, 2015, 01:33:17 PM by John Donovan »
John J. Donovan, Pres. 
(541) 343-3400

"Not Absolutely Certain, Yet Reliable"

John Donovan

  • Administrator
  • Emeritus
  • *****
  • Posts: 3304
  • Other duties as assigned...
    • Probe Software
Re: Your "friend" the Report button
« Reply #2 on: May 21, 2017, 02:10:53 PM »
Note that the latest version of Probe for EPMA now displays the EDS elements when they are present and the List Report button is clicked as seen here:

Assigned average standard intensities for sample St   25 Set   2 MnO synthetic

Drift array background intensities (cps/1nA) for standards:
ELMXRY:    si ka   mn ka   fe ka   sr la
MOTCRY:  4   TAP 3  LPET 0   EDS 0   EDS
INTEGR:        0       0       0       0
STDASS:       14      25     395     251
STDVIR:        0       0       0       0
            1.33   10.75     .00     .00
            1.34   33.98     .00     .00
              -       -       -      .00

Drift array standard intensities (cps/1nA) (background corrected):
ELMXRY:    si ka   mn ka   fe ka   sr la
MOTCRY:  4   TAP 3  LPET 0   EDS 0   EDS
STDASS:       14      25     395     251
STDVIR:        0       0       0       0
          756.90 2088.47  401.09  851.12
          765.85 2063.38  402.18  869.12
              -       -       -   876.58


The EDS backgrounds are zero in this example because Thermo only returns the net intensities and not the calculated background intensities. But do note that the EDS standard intensities are drift corrected in time just like the WDS elements.

Note that this button has now been re-named the "List Standard Intensities" button.

Also note that because the Bruker EDS interface does report the background intensities, the actual EDS background (and integrated peak) counts for each standard are reported if Probe for EPMA is integrated with the Bruker Esprit EDS system.
john
« Last Edit: May 21, 2017, 02:13:42 PM by John Donovan »
John J. Donovan, Pres. 
(541) 343-3400

"Not Absolutely Certain, Yet Reliable"