Author Topic: Penelope/Penepma/Penfluor/Fanal Monte-Carlo Software and Physics  (Read 39092 times)

jrminter

  • Professor
  • ****
  • Posts: 72
Re: Penelope/Penepma/Penfluor/Fanal Monte-Carlo Software and Physics
« Reply #45 on: August 27, 2018, 06:42:28 AM »
This has been an interesting project over the weekend. I have been working with penepma16 using the REFLIN parameter to stop a simulation when it reaches a desired tolerance (relative uncertainty).  The key problem I encountered is finding suitable tolerance value that will be reached in a reasonable simulation time.

I simulated a simple example of a 100 nm Al film on Fe at 20 kV using the Fe K-L3 line for the REFLIN parameter. This is a long simulation because of the deep penetration of the electron beam into the Fe substrate at 20 kV. My objective was to be able to predict the simulation time based on the tolerance criterion.


I set up the simulation with a dump time of 120 sec. I wrote a function in R to read the penepma-res.dat file that is produced and extract the simulation time, the number of showers (trajectories) and the current value for the tolerance (relative uncertainty). I (manually) recorded the tolerance value after each dump time and stored the data file for later modeling. It ran for 2.7 hrs to get just over 25000 trajectories.

It turns out that one can predict the time to reach a given relative uncertainty (tolerance) by fitting the data to a model where the simulation time in sec is fit to (1/tolerance)^2 (see the attached plot). The coefficient for this transition was 384.5 with a standard error of 1.068. Running the simulation to a tolerance of 0.2 required 2.7 hrs. Running the simulation to a tolerance of 0.05 would require 42.7 hrs!

I suspect that the time to reach a given tolerance would be lower for measurements at lower accelerating voltages because each trajectory would be shorter.

This is a work-in-progress. The function call will fail if penepma is writing the penepma-res.dat file at the time the query is made. I am still figuring out how to automatically run the query in a loop and write the results to a file for later analysis.

neko

  • Professor
  • ****
  • Posts: 66
Re: Penelope/Penepma/Penfluor/Fanal Monte-Carlo Software and Physics
« Reply #46 on: September 05, 2018, 04:20:43 PM »
I'm curious if anyone knows whether or not this problem could also be solved via a GPU platform. My understanding is that they're great when you have the same starting data but not necessarily efficient if you have to keep loading in new operations, and I don't know enough about how these things are calculated to even make a guess as to whether or not it would be useful to look in to.

Any thoughts? I've done a bit of spot reading, and it looks like if enough data can be loaded into the initial set (eg you're not constantly sending and retrieving the data through the PCIe bus) and the process is parallelizable it *might* work. Of course, might also be cheaper to just rent some Amazon EC2 time and do several days of computing in an hour.

jrminter

  • Professor
  • ****
  • Posts: 72
Re: Penelope/Penepma/Penfluor/Fanal Monte-Carlo Software and Physics
« Reply #47 on: September 05, 2018, 05:38:30 PM »
Neko, I suspect a port to use a GPU would be a major undertaking. The base penelope/penepma code only uses a single core. There is a provision for using different random number seeds, running multiple simulations on different cores and combining the results. There is also a multi-core version developed by Oak Ridge National Laboratories. I understand that there are differences in input because of this. I have not heard any one on this forum claim to use it.

My main purpose in running the experiment to understand how the required simulation time varied with the desired precision was to get an idea how to manage an uncertainty budget in an analysis and to be able to predict how long a simulation with a desired uncertainty would take based on a trial simulation.

More of my effort has been dedicated to designing a R package to automate analysis of the output and make it easier to write a reproducible report. I found myself repeatedly writing similar code, which is a key sign that one needs to package functions under version control and use unit tests.

Hope this helps,
John

John Donovan

  • Administrator
  • Emeritus
  • *****
  • Posts: 3267
  • Other duties as assigned...
    • Probe Software
Re: Penelope/Penepma/Penfluor/Fanal Monte-Carlo Software and Physics
« Reply #48 on: September 20, 2018, 01:59:01 PM »
Philippe Pinard, Hendrix Demers and I recently noticed that the x-ray intensities calculated from using a few of the pure element PAR files in the Standard GUI for Penefluor/Fanal were not correct.  This was only the case for the gaseous elements: N, O, F, Ne, Cl, Ar, Kr, Xe and Rn.  Now I don't suppose that many of you actually utilize pure gases as standards, even for your simulations, but we discovered the issue while writing up a paper on the use of alpha factors from Monte Carlo generated intensities

This was because I had assumed the room temperature densities for calculating the material files for these gaseous elements (if we had evolved on Pluto this would not have been an issue!).   :D

The gaseous densities (~10^-3) were problematic because the default "bulk" geometry file (bulk.geo), specifies a thickness of only 0.1 cm or 1 mm. This makes these gaseous pure elements essentially a thin film experiment where some of the incident electrons actually transmit through the specimen geometry resulting in too low a generated x-ray intensity!  Our solution was to simply force the pure gaseous element densities to 1.0 if they were less than 1.0.  Obviously you can modify the densities from the GUI to whatever values you want and re-calculate them, and/or edit the bulk.geo file geometry, if you prefer.

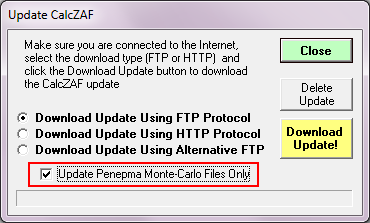
So we re-calculated these gaseous pure elements (N, O, F, Ne, Cl, Ar, Kr, Xe and Rn) and they are now available for download by using the Help | Update menu in either CalcZAF or Probe for EPMA, by checking the Update Penepma Monte Carlo Files as seen here:


Remember, if you haven't updated CalcZAF and/or Probe for EPMA since we switched to secure https connections in August this year, you will need to manually download the CalcZAF.msi and/or ProbeForEPMA.msi installers on this page:

https://probesoftware.com/Update.html

and run the installer manually once.  After this, you can continue to update CalcZAF and/or Probe for EPMA from the Help | Update menu again.

Or you can manually download the Penepma12.zip file from the various download sites if you prefer and unzip it to your user data folder (usually C:\UserData\Penepma12). The actual pure element PAR files are in the \Penfluor\Pure sub folder.
« Last Edit: September 20, 2018, 04:55:37 PM by John Donovan »
John J. Donovan, Pres. 
(541) 343-3400

"Not Absolutely Certain, Yet Reliable"

Probeman

  • Emeritus
  • *****
  • Posts: 2830
  • Never sleeps...
    • John Donovan
Re: Penelope/Penepma/Penfluor/Fanal Monte-Carlo Software and Physics
« Reply #49 on: December 21, 2018, 12:57:15 PM »
Attached is a plot of some BSE simulations I did recently for pure elements in Penepma (Penelope) 2012 (please login to see attachments).

My question is: are these BSE fluctuations for these pure elements, e.g., around Z = 35 or so, we are seeing in the Penepma calculations, confirmed by empirical measurements?  What I mean, is there a physical basis for these BSE fluctuations in the Penepma modeling?  Or is it an artifact of the elastic scatter modeling in Penepma?

I asked Xavier Llovet and he said: good question!

As he also pointed out, it would be difficult to get enough sensitivity to see this empirically, but I might give it a try. Does anyone have any thoughts on whether this is just a modeling artifact?  Has any one tried to see this with other MC software?
The only stupid question is the one not asked!

Probeman

  • Emeritus
  • *****
  • Posts: 2830
  • Never sleeps...
    • John Donovan
Re: Penelope/Penepma/Penfluor/Fanal Monte-Carlo Software and Physics
« Reply #50 on: January 07, 2019, 04:54:33 PM »
I posted an image in the previous post as an attachment a few days before Christmas so not sure how many people saw it.  Here it is again as an in-line image:


At that time I asked if anyone had noticed whether any other MC software packages show the same discontinuous trends (e.g., around Z=35), for the pure elements. 

I haven't had a chance to try other MC programs, but I wondered (because this data was calculated from several different computers), if these discontinuities were just an artifact of statistics, so I ran a longer calculation on a single computer over the holidays and obtain this for pure elements between Z = 30 to 40:


The variances are shown as the tiny errors bars.  So at least Penepma is consistent.  But why these discontinuities occur, for example between Se (34) and Br (35), I have no idea.
john
« Last Edit: January 08, 2019, 08:43:47 AM by Probeman »
The only stupid question is the one not asked!

Probeman

  • Emeritus
  • *****
  • Posts: 2830
  • Never sleeps...
    • John Donovan
Re: Penelope/Penepma/Penfluor/Fanal Monte-Carlo Software and Physics
« Reply #51 on: January 08, 2019, 11:04:20 AM »
So in addition to the small increase in BSE from atomic number 34 to 35 (Se to Br):

34   0.3389
35   0.3393

There is also a small change (actually a decrease!) from 58 to 59 (Ce to Pr):

58   0.4277
59   0.4276

Does this make any sense to anyone?
The only stupid question is the one not asked!

JonF

  • Professor
  • ****
  • Posts: 149
Re: Penelope/Penepma/Penfluor/Fanal Monte-Carlo Software and Physics
« Reply #52 on: January 10, 2019, 08:12:25 AM »
Yeah, it does make sense in my head at least - this is what I was thinking about back in August on the brain teaser thread (assuming I'm right, of course - something which should never be assumed!). Link to the brain teaser thread:https://probesoftware.com/smf/index.php?topic=1111.msg7468#msg7468.

To paraphrase Goldstein et al*, the elastic scattering events that combine to form the BSE emission result from an interaction of the primary electron beam with the electrical field of an atom i.e. the positive nuclear charge of an atom as shielded by the electron cloud.   

It is this effect of the electron shielding that I think you are seeing here.

I've pulled some numbers off the web for the effective nuclear charge at the valence shell (which shell is valence? discussed briefly below) and plotted these up in the attached images - I hope you agree the plot for the effective nuclear charge, Zeff, as a function of atomic number for the elements Z= 30 to 40 looks similar to the plot of BSE coefficient vs Z. What I haven't figured out is why it appears to be offset by 1 compared to your data?

The plot of the 6s subshell for Z = 55 to 61 also show the decrease you were referring to (and in the right place this time!). I've plotted up the 6s and 4f subshells for Caesium (Cs) to Promethium (Pm) (no 4f for Cs and Ba - the 4f energy level is higher than the 6s and so 6s fills first). Why does the 6s subshell show the BSE pattern whereas the 4f doesn't if the 4f is higher energy and so shouldn't it be further from the nucleus and therefore the valence orbital? Not quite... Despite the 4f being higher energy than the 6s, the 4f electrons have a higher probability of being closer to the nucleus than the 6s owing to the shape of the orbitals. The Encyclopedia Britannica actually has a nice diagram of the probability of electron position for Gadolinium (Z= 64) with electron configuration [Xe].4f7.5d1.6s2:

(link for if the image doesn't work: https://www.britannica.com/science/rare-earth-element/media/491579/187149)

Further to this, the filling of the subshells in the lanthanide series also unusual: the electron configurations of Cs and Ba are as expected [Xe].6s1 and [Xe].6s2; but La skips the 4f subshell and starts filling up the higher energy 5d subshell [Xe].5d1.6s2; Ce starts filling up the 4f subshell [Xe].4f1.5d1.6s2; and then Pr dumps the 5d subshell and moves the electron in to the 4f to get [Xe].4f3.6s2 (no 5d electrons).

I think all the wobbles and fluctuations you see through the BSE vs Z model that has been posted are mostly caused by these electron subshell filling/nuclear screening artefacts. If so, I'm actually quite impressed that the MC simulations show it.

*Scanning Electron Microscopy and X-Ray Microanalysis, 4th Ed., Chapter 1, page 4


Probeman

  • Emeritus
  • *****
  • Posts: 2830
  • Never sleeps...
    • John Donovan
Re: Penelope/Penepma/Penfluor/Fanal Monte-Carlo Software and Physics
« Reply #53 on: January 10, 2019, 11:20:39 AM »
Hi Jon,
Wow, this is super interesting!

First of all the BSE brain teaser that Ben and you and I were discussing is a slightly different issue (in my mind anyway), as that is more related I think to how one should calculate average Z for compounds.  Hence the Z fraction to the 0.7 exponent model. The value of 0.7 for the exponent is necessary to calculate the effect of nuclear screening by inner orbitals in higher atomic number elements (it's why the BSE coefficient tends to increase less as Z increases). That and the fact that the number of neutrons tends to increase faster than the number of electrons and protons as the atomic number increases is why using mass fraction skews the average zbar calculation at higher atomic numbers.  See a plot of A/Z for the periodic table and it will make sense.

If it wasn't for this nuclear screening, we could just use a simple z fraction for compounds.  By the way, if you'd like to compare a number of average Z calculations, simply check the Calculate Alternative Zbars in the Output menu of the Standard application. 

Now as for these wriggles in the plot of the pure elements I think you nailed it.  I would never have guessed that the outer electron shells would have that much effect on elastic scattering.   Though I agree that it's odd about the change in BSE coefficient from 34 to 35, versus the change from 35 to 36 in the effective charge.  But I double checked the Penepma calculations and I did seemingly type them into the spreadsheet correctly from the penempa.dat files. Here is a section:

Atomic Number   BSE Coefficient   BSE variance   Zbar (mass)   Zbar (zfrac)   Zbar (zfrac^0.7)
29   0.3130   0.00015   29   29   29
30   0.3175   0.00015   30   30   30
31   0.3233   0.00015   31   31   31
32   0.3308   0.00016   32   32   32
33   0.3346   0.00016   33   33   33
34   0.3389   0.00016   34   34   34
35   0.3393   0.00008   35   35   35
36   0.3445   0.00008   36   36   36
37   0.3492   0.00009   37   37   37
38   0.3527   0.00009   38   38   38

Attached below is the complete Excel spreadsheet with the Penepma pure element values.
john
« Last Edit: January 10, 2019, 02:54:31 PM by Probeman »
The only stupid question is the one not asked!

JonF

  • Professor
  • ****
  • Posts: 149
Re: Penelope/Penepma/Penfluor/Fanal Monte-Carlo Software and Physics
« Reply #54 on: January 11, 2019, 12:09:58 AM »

Hi John,


First of all the BSE brain teaser that Ben and you and I were discussing is a slightly different issue (in my mind anyway), as that is more related I think to how one should calculate average Z for compounds.


Yeah, I realised at the time that I'd wandered off on a tangent. The thing that got me started there wasn't the average atomic number, but rather why were we using the atomic number at all - integer values always seem a bit too convenient! That said, trying to determine the average Z[eff] to account for bonded atoms in an unknown material might be challenging!


The value of 0.7 for the exponent is necessary to calculate the effect of nuclear screening by inner orbitals in higher atomic number elements (it's why the BSE coefficient tends to increase less as Z increases).


I assume this is in addition to the decreasing proportional effect of adding one more proton to the nucleus e.g. adding 1 proton to H will double the proton number, add 1 proton to La makes less of a proportional difference (1/57)?


Now as for these wriggles in the plot of the pure elements I think you nailed it.  I would never have guessed that the outer electron shells would have that much effect on elastic scattering.   Though I agree that it's odd about the change in BSE coefficient from 34 to 35, versus the change from 35 to 36 in the effective charge.  But I double checked the Penepma calculations and I did seemingly type them into the spreadsheet correctly from the penempa.dat files. Here is a section:
Atomic Number   BSE Coefficient   BSE variance   Zbar (mass)   Zbar (zfrac)   Zbar (zfrac^0.7)
29   0.3130   0.00015   29   29   29
30   0.3175   0.00015   30   30   30
31   0.3233   0.00015   31   31   31
32   0.3308   0.00016   32   32   32
33   0.3346   0.00016   33   33   33
34   0.3389   0.00016   34   34   34
35   0.3393   0.00008   35   35   35
36   0.3445   0.00008   36   36   36
37   0.3492   0.00009   37   37   37
38   0.3527   0.00009   38   38   38


That is strange - I'm wondering whether we're looking at a spatial effect as well as a screening effect ie the probability of where the primary beam electron would interact with the atom and whether this occurs between shells or is considered only outside of the atom (and hence would experience the complete shielding effect as seen by the valence shell).
Or whether the numbers either penepma - or more likely I - used are wrong - there was a bit of variation in the numbers I found..
Either way, there's obviously something else going on here that I haven't figured out yet...

Probeman

  • Emeritus
  • *****
  • Posts: 2830
  • Never sleeps...
    • John Donovan
Re: Penelope/Penepma/Penfluor/Fanal Monte-Carlo Software and Physics
« Reply #55 on: May 03, 2019, 10:10:10 AM »
This question came up off-line so I thought I would mention it here.

When running Penepma from the GUI in the Standard application, the random seed is *not* varied. This is for reproducibility of results.

However when running Penepma from Probe for EPMA to simulate EDS spectra, the random seed *is* varied.

To add a random seed in the Penepma input file simply add a line like this to your .in file:

RSEED  1 2                  [Seeds of the random-number generator]

The defaults are 1 and 2 so you should change them if you want to simulate random statistics, though the Penepma documentation does not explain exactly how they are utilized that I can find. Except for this bit of code:

Code: [Select]
C *********************************************************************
C FUNCTION RAND
C *********************************************************************
FUNCTION RAND(DUMMY)
C
C This is an adapted version of subroutine RANECU written by F. James C (Comput. Phys. Commun. 60 (1990) 329-344), which has been modified to
C give a single random number at each call.
C
C The 'seeds' ISEED1 and ISEED2 must be initialised in the main program
C and transferred through the named common block /RSEED/.
C
IMPLICIT DOUBLE PRECISION (A-H,O-Z), INTEGER*4 (I-N)
PARAMETER (USCALE=1.0D0/2.147483563D9)
COMMON/RSEED/ISEED1,ISEED2
C
I1=ISEED1/53668
ISEED1=40014*(ISEED1-I1*53668)-I1*12211
IF(ISEED1.LT.0) ISEED1=ISEED1+2147483563
C
I2=ISEED2/52774
ISEED2=40692*(ISEED2-I2*52774)-I2*3791
IF(ISEED2.LT.0) ISEED2=ISEED2+2147483399
C
IZ=ISEED1-ISEED2
IF(IZ.LT.1) IZ=IZ+2147483562
RAND=IZ*USCALE
C
RETURN
END

and the following text:

Quote
1.2.1 Random-number generator
In general, random-sampling algorithms are based on the use of random numbers » uniformly distributed in the interval (0,1). These random numbers can be easily generated on the computer (see, e.g., Kalos and Whitlock, 1986; James, 1990). Among the \good" random-number generators currently available, the simplest ones are the so-called multiplicative congruential generators (Press and Teukolsky, 1992). A popular example of this kind of generator is the following,

Rn = 75Rn¡1 (mod 231 ¡ 1); »n = Rn=(231 ¡ 1); (1.30)

which produces a sequence of random numbers »n uniformly distributed in (0,1) from a given \seed" R0 (< 231 ¡ 1). Actually, the generated sequence is not truly random, because it is obtained from a deterministic algorithm (the term \pseudo-random" would be more appropriate), but it is very unlikely that the subtle correlations between the values in the sequence have an appreciable e®ect on the simulation results. The generator (1.30) is known to have good random properties (Press and Teukolsky, 1992).

However, the sequence is periodic, with a period of the order of 109. With present-day computational facilities, this value is not large enough to prevent re-initiation in a single simulation run. An excellent critical review of random-number generators has been published by James (1990), where he recommends using algorithms that are more sophisticated than simple congruential ones. The generator implemented in the Fortran 77 function RAND (Table 1.1) is due to L'Ecuyer (1988); it produces 32-bit floating-point numbers uniformly distributed in the open interval between zero and one. Its period is of the order of 1018, which is virtually inexhaustible in practical simulations.
« Last Edit: May 03, 2019, 11:19:21 AM by Probeman »
The only stupid question is the one not asked!

Probeman

  • Emeritus
  • *****
  • Posts: 2830
  • Never sleeps...
    • John Donovan
Re: Penelope/Penepma/Penfluor/Fanal Monte-Carlo Software and Physics
« Reply #56 on: June 11, 2019, 03:38:19 PM »
The small "steps" in the calculated BSE that I saw in Penepma 2012 appear to simply be statistical in nature. Varying the random seed for 4 different simulations I got this:


This is using these 4 seed statements:

RSEED  1 1                     [Seeds of the random-number generator]
RSEED  2 2                     [Seeds of the random-number generator]
RSEED  3 2                     [Seeds of the random-number generator]
RSEED  4 2                     [Seeds of the random-number generator]

I still find it odd that the variation doesn't appear totally random, but I'm guessing that these "steps" are not significant.
« Last Edit: June 11, 2019, 09:15:34 PM by Probeman »
The only stupid question is the one not asked!

John Donovan

  • Administrator
  • Emeritus
  • *****
  • Posts: 3267
  • Other duties as assigned...
    • Probe Software
Re: Penelope/Penepma/Penfluor/Fanal Monte-Carlo Software and Physics
« Reply #57 on: January 16, 2020, 02:06:41 PM »
As many of you know, the boundary fluorescence calculations shown in this window, which are accessed from the Standard application:


are based on the Penfluor/Fanal FORTRAN codes written by Cesc Salvat and Xavier Llovet. Penfluor (using Monte Carlo methods), calculates the primary and continuum x-ray productions from the primary electrons while Fanal (using analytical methods), calculates the fluorescence effects for boundary geometries (when the two phases are different) or for a bulk matrix (when the two phases are the same). This is described here and in the subsequent posts:

https://probesoftware.com/smf/index.php?topic=58.msg214#msg214

The thing is, even though the Penfluor code is based on Penepma, it parameterizes the results over 10 beam energies so there are some inaccuracies and more importantly it can only handle the simple mirror geometry of a vertical plane boundary.  The mistake I made was that until recently I had named the title of the window "Calculate Penepma 2012 Fluorescence Couple Profiles", so some people thought the GUI was running the full Penepma code.  But no it just utilizes the Penfluor/Fanal code.  But it gets one lots of results in minutes (assuming you have the PAR files already calculated for the selected materials).

For ultimate accuracy one should utilize the full Penepma Monte Carlo code GUI, because it can handle any boundary geometry, though it does take a lot longer. However one can create a bunch of input files that can be run as a batch. This is this the GUI window running the full Penepma FORTRAN code, which is opened when clicking the Penepma Monte Carlo menu in Standard:


Anyway, Xavier asked me to fix the title of the Penfluor/Fanal window as described above, so that is now done, and you can update to v. 12.8.2 any time using the Help menu in Probe for EPMA or CalcZAF.
« Last Edit: January 17, 2020, 09:49:23 PM by John Donovan »
John J. Donovan, Pres. 
(541) 343-3400

"Not Absolutely Certain, Yet Reliable"

jrminter

  • Professor
  • ****
  • Posts: 72
Using Penepma16 with CalcZAF
« Reply #58 on: February 03, 2020, 03:05:14 PM »
John Donovan has graciously let me test a new Penepma dialog that uses penepma16 under
the hood. This is the current from release from Professors Llovet and Salvat. Everything worked
as expected for simulation of bulk standards.

When I tried the thin-film option from the new release, the penepma16 executable would crash
without an error message.

I had an old penepma16 simulation I had done in 2018 from a similar attempt that had worked
and was able to compare the two input files. The difference was:

I found the problem in the .in file

This works for a bilayer
       .
       >>>>>>>> Emerging particles. Energy and angular distributions.
NBE    0   4e3 1000                [E-interval and no. of energy bins]
NBANGL 45 30              [Nos. of bins for the angles THETA and PHI]
       .

This is what the GUI for penepma16 generates
       .
       >>>>>>>> Emerging particles. Energy and angular distributions.
NBE    0   4e3 250                [E-interval and no. of energy bins]
NBTH   45                     [No. of bins for the polar angle THETA]
NBPH   30                   [No. of bins for the azimuthal angle PHI]
       .
Note that the difference is the use of the NBANGL 45 30 that works
and the older sequence using two lines with NBTH and NBPH doesn't.
I don't think the different number of bins are important. This version
can easily handle 1000 bins...

Neither John Donovan nor I understand why the second doesn't work any longer.
« Last Edit: February 03, 2020, 03:07:39 PM by jrminter »

John Donovan

  • Administrator
  • Emeritus
  • *****
  • Posts: 3267
  • Other duties as assigned...
    • Probe Software
Re: Penelope/Penepma/Penfluor/Fanal Monte-Carlo Software and Physics
« Reply #59 on: February 03, 2020, 03:27:11 PM »
Hi John,
I looked into this a bit more and I found that these parameters (NBANGL vs. NBTH, NBPH) are not actually created by the Standard GUI. The NBTH and NBPH parameters are respected and re-written if they are found, but I'm suspecting that they must have been in your original .in files for some reason.

Thanks for noticing this and I will add support for the NBANGL parameter as soon as I get a chance for Penepma16.

In the meantime I am calculating high precision spectra for Li, Be and B at a number of beam energies using Penepma16, but I'm not sure Penepma16 is any different for other elements.  So sticking with Penepma12 for now is fine.
« Last Edit: February 03, 2020, 03:29:17 PM by John Donovan »
John J. Donovan, Pres. 
(541) 343-3400

"Not Absolutely Certain, Yet Reliable"