Author Topic: Spurious Accuracy  (Read 2041 times)

Probeman

  • Emeritus
  • *****
  • Posts: 2826
  • Never sleeps...
    • John Donovan
Spurious Accuracy
« on: March 06, 2018, 04:50:52 PM »
Joe Michael coined the term "spurious accuracy" years ago and it's a good joke for sure. What he meant was, accuracy that seems simply too good to be true!    :)

That said, I just had to share such an example of "spurious accuracy", that a student obtained today running standards for some melt inclusions. And yes, it's only the average of two points because he wanted to do a quick check before getting serious, but that's the nature of "spurious accuracy"!   

Here is the NIST K-412 mineral glass being analyzed as a secondary for a number of elements with two beam currents, 10 nA for the majors and 50 nA for the traces, using a number of primary standards, including the K-411 glass as the primary standard for Si, Ca, Fe and Mg.  The primary standard for Al was a nepheline. The quant results are here:

St  160 Set   1 NBS K-412 mineral glass, Results in Elemental Weight Percents
 
ELEM:       Na      Si      Ca       K      Al      Fe      Mg      Cl      Ti       F       S       O       H       P      Mn
TYPE:     ANAL    ANAL    ANAL    ANAL    ANAL    ANAL    ANAL    ANAL    ANAL    ANAL    ANAL    SPEC    SPEC    SPEC    SPEC
BGDS:      MAN     MAN     MAN     LIN     MAN     MAN     MAN     LIN     LIN     LIN     LIN
TIME:    30.00   15.00   20.00   20.00   30.00   30.00   40.00   20.00   20.00   20.00   20.00     ---     ---     ---     ---
BEAM:     9.77    9.77    9.77    9.77    9.77    9.77   50.90   50.90   50.90   50.90   50.90     ---     ---     ---     ---

ELEM:       Na      Si      Ca       K      Al      Fe      Mg      Cl      Ti       F       S       O       H       P      Mn   SUM 
    11    .031  21.260  10.850    .004   4.973   7.558  11.616   -.002    .002   -.011    .000  43.597    .000    .000    .077  99.956
    12    .025  21.179  10.868    .000   4.830   7.817  11.594   -.002   -.035    .011    .003  43.597    .000    .000    .077  99.965

AVER:     .028  21.220  10.859    .002   4.902   7.687  11.605   -.002   -.016    .000    .002  43.597    .000    .000    .077  99.961
SDEV:     .004    .057    .012    .003    .101    .183    .016    .000    .026    .016    .002    .000    .000    .000    .000    .007
SERR:     .003    .040    .009    .002    .071    .130    .011    .000    .018    .011    .002    .000    .000    .000    .000
%RSD:    15.35     .27     .11  134.22    2.06    2.38     .14    -.92 -161.45    ----  141.42     .00     .00     .00     .00

PUBL:     .043  21.199  10.899    n.a.   4.906   7.742  11.657    n.a.    n.a.    n.a.    n.a.  43.597    n.a.    n.a.    .077 100.120
%VAR:   -35.88     .10    -.36     ---    -.09    -.71    -.45     ---     ---     ---     ---     .00     ---     ---     .00
DIFF:    -.015    .021   -.040     ---   -.004   -.055   -.052     ---     ---     ---     ---    .000     ---     ---    .000
STDS:      336     162     162     374     336     162     162     285      22     835     730     ---     ---     ---     ---

STKF:    .0735   .2018   .1027   .1132   .1332   .0950   .0568   .0602   .5547   .1715   .5062     ---     ---     ---     ---
STCT:    64.05   74.02   51.81  189.84  625.36   19.33   72.19   50.72   37.62   43.51  127.83     ---     ---     ---     ---

UNKF:    .0001   .1623   .1004   .0000   .0334   .0649   .0773   .0000  -.0001   .0000   .0000     ---     ---     ---     ---
UNCT:      .12   59.53   50.65     .03  157.00   13.20   98.28    -.01    -.01     .00     .00     ---     ---     ---     ---
UNBG:      .32     .19     .41    1.01    2.54     .26     .57     .41     .06     .13     .08     ---     ---     ---     ---

ZCOR:   1.9900  1.3074  1.0819  1.0950  1.4659  1.1842  1.5013  1.2194  1.1826  3.9720  1.2373     ---     ---     ---     ---
KRAW:    .0019   .8042   .9775   .0002   .2511   .6830  1.3613  -.0003  -.0002   .0000   .0000     ---     ---     ---     ---
PKBG:     1.38  311.55  125.25    1.04   62.79   52.11  174.70     .97     .88    1.00    1.05     ---     ---     ---     ---
INT%:     ----    ----    ----    ----    ----    ----    ----    ----    ---- -109.68    ----     ---     ---     ---     ---

TDI%:   -5.846   2.976    ----   4.521   -.562   -.301    ----    ----    ----    ----    ----     ---     ---     ---     ---
DEV%:       .2     1.0    ----   252.3      .2     1.8    ----    ----    ----    ----    ----     ---     ---     ---     ---
TDIF:  HYP-EXP LOG-LIN    ---- LOG-LIN HYP-EXP LOG-LIN    ----    ----    ----    ----    ----     ---     ---     ---     ---
TDIT:    59.50   51.50    ----   58.00   60.50   65.00    ----    ----    ----    ----    ----     ---     ---     ---     ---
TDII:     .461    59.7    ----    1.06    159.    13.4    ----    ----    ----    ----    ----     ---     ---     ---     ---
TDIL:    -.774    4.09    ----   .0553    5.07    2.60    ----    ----    ----    ----    ----     ---     ---     ---     ---

Note the "%VAR" line which is the relative accuracy compared to the "published" composition.  Sub percent relative accuracy "across the board" as they say!  Note also the TDI correction on Si was almost 3%, so again sort of interesting.

But still "spurious"!    :D
The only stupid question is the one not asked!

Probeman

  • Emeritus
  • *****
  • Posts: 2826
  • Never sleeps...
    • John Donovan
Re: Spurious Accuracy
« Reply #1 on: August 01, 2018, 12:25:32 PM »
Another example of "spurious accuracy"!

As you may know, estimating how long an automated acquisition on the EPMA is going to take, can be useful when planning one's EPMA measurements, especially for long overnight or multiple day runs. In Probe for EPMA the app tries to estimate the time required based on the std, unk and wavescan element setups, count times, acquisition options, beam conditions, crystal flipping, instrument latencies and whatever else might effect the acquisition time.  This is not easy to do as one might imagine.

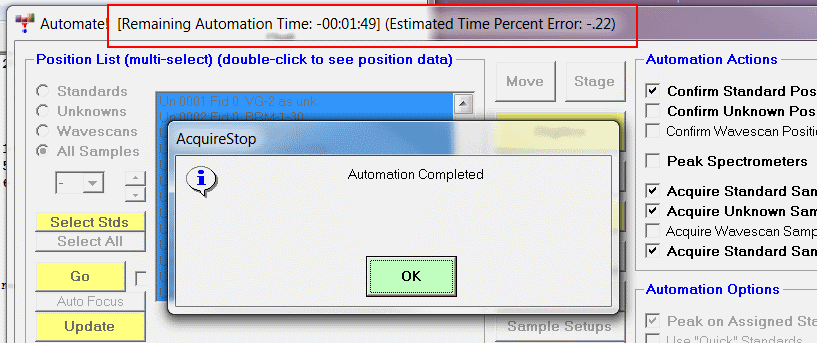
To check on the accuracy of this time estimate, PFE counts down from the estimated time vs. the time of day clock and then displays the remaining acquisition time and at the termination of the automation displays the error of the estimated times as a percent. And occasionally Probe for EPMA is smart (or lucky).

Last night a student ran a large number of melt inclusion glasses analyses overnight which involved two beam conditions per acquisition (10 nA with TDI for major elements and 50 nA for traces), and was estimated to be around 13 hours of acquisition. Here is the displayed time estimate accuracy when the acquisition finished:


Is it skill or luck?  We'll never know.
« Last Edit: April 13, 2020, 09:05:45 AM by John Donovan »
The only stupid question is the one not asked!