Explain this if you can!
Recently I made some simultaneous k-ratio measurements on our PET crystals at high sin theta using F Ka on CaF2 (natural) and BaF2 (synthetic) in order to look at the effective takeoff angles as described here:
https://probesoftware.com/smf/index.php?topic=1569.msg12191#msg12191But I found that were some significant peak shape issues that fortunately could be corrected for quite well using the area peak factor (APF) method, as described here:
https://probesoftware.com/smf/index.php?topic=536.msg12187#msg12187What I did not mention was that there were also some significant time dependent intensity (TDI) issues during the measurement that also needed to be corrected for, even with a 20 um diameter beam and at 30 nA!
Here is what spectrometer 1 (TAP) intensities looked like:

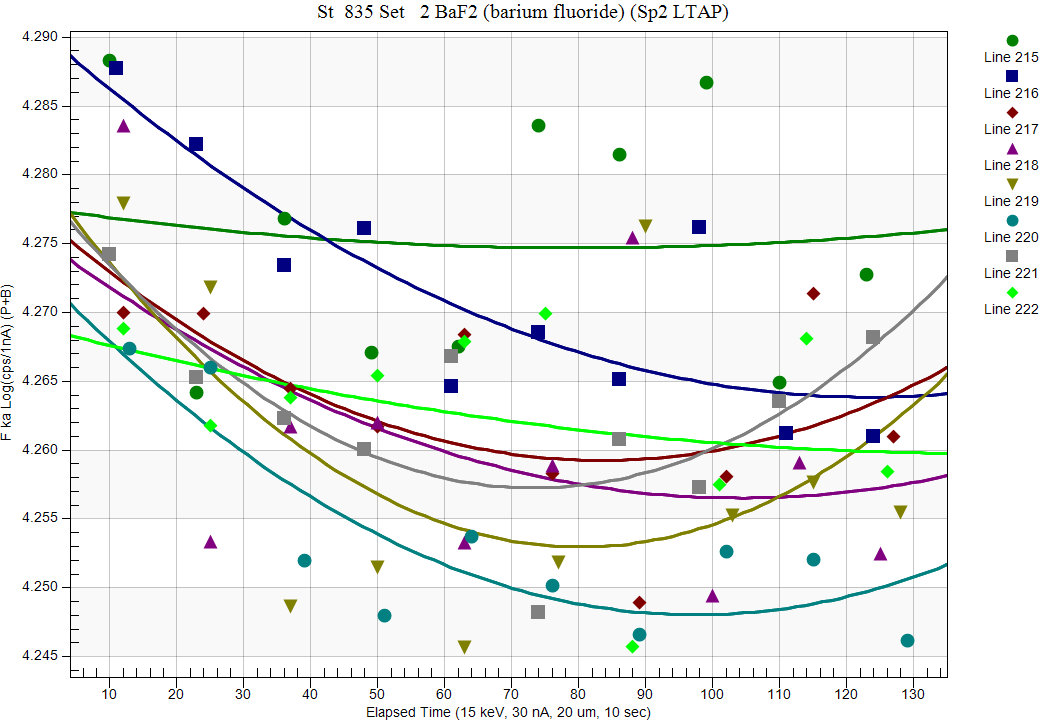
And spec 2 (LTAP):
And spec 4 (TAP):
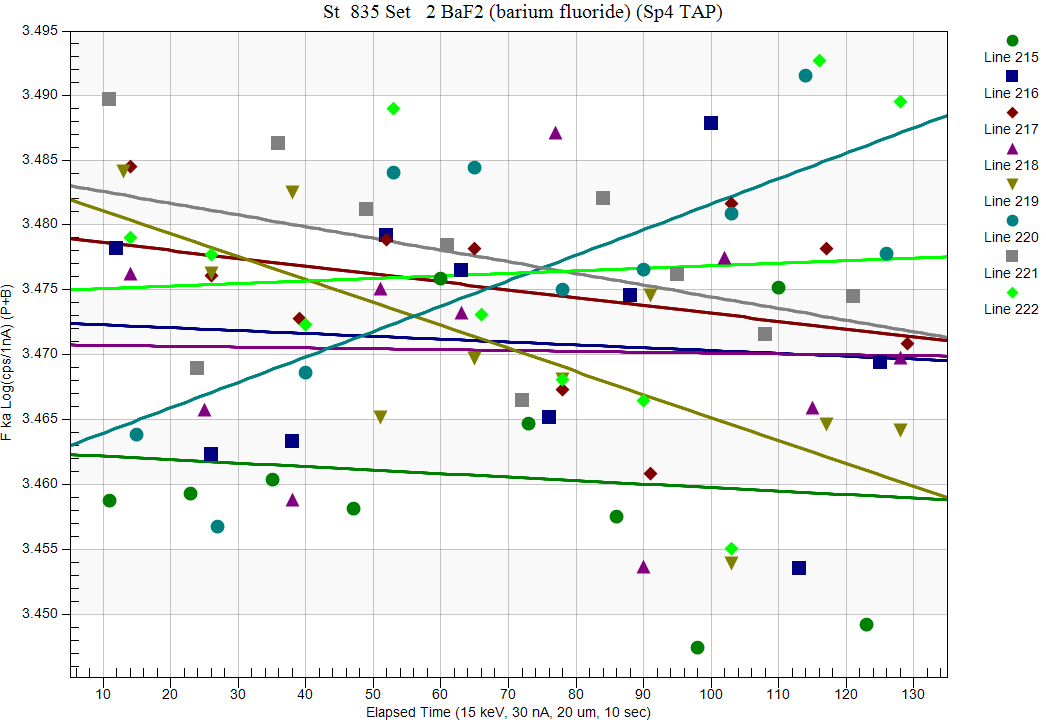
You have probably noticed that that the TDI effects were largest in spec 1, less in spec 2 and essentially nonexistent in spec 4... now why would that be? Since all three spectrometers were measuring the same points at the the same time!?
And these effects were repeated in both BaF2 and CaF2. Here are the
(unaggregated) statistics for BaF2:
St 835 Set 2 BaF2 (barium fluoride), Results in Elemental Weight Percents
ELEM: F F F F Ba
TYPE: ANAL ANAL ANAL ANAL SPEC
BGDS: LIN LIN LIN EDS
TIME: 100.00 100.00 100.00 80.00 ---
BEAM: 29.95 29.95 29.95 29.95 ---
ELEM: F F F F Ba SUM
XRAY: (ka) (ka) (ka) (ka) ()
215 22.674 22.297 21.931 23.055 78.330 168.286
216 23.205 22.544 22.081 24.294 78.330 170.454
217 22.329 22.308 22.248 24.241 78.330 169.456
218 22.605 22.285 22.165 21.838 78.330 167.223
219 22.816 22.459 22.380 21.856 78.330 167.841
220 22.167 22.280 22.000 21.100 78.330 165.877
221 23.259 22.438 22.447 21.617 78.330 168.092
222 23.287 22.043 22.171 25.752 78.330 171.583
AVER: 22.793 22.332 22.178 22.969 78.330 168.601
SDEV: .429 .152 .177 1.646 .000 1.825
SERR: .152 .054 .063 .582 .000
%RSD: 1.88 .68 .80 7.17 .00
PUBL: 21.670 21.670 21.670 21.670 78.330 100.000
%VAR: 5.18 3.05 2.34 5.99 .00
DIFF: 1.123 .662 .508 1.299 .000
STDS: 831 831 831 831 ---
STKF: .1545 .1545 .1545 .1545 ---
STCT: 15.90 47.06 20.35 18.22 ---
UNKF: .1959 .1919 .1906 .1974 ---
UNCT: 20.16 58.48 25.11 23.29 ---
UNBG: .25 .67 .31 .00 ---
ZCOR: 1.1636 1.1636 1.1636 1.1636 ---
KRAW: 1.2682 1.2426 1.2340 1.2781 ---
PKBG: 82.44 88.08 83.15 .00 ---
TDI%: 9.584 1.675 .140 .000 ---
DEV%: .4 .2 .2 .0 ---
TDIF: HYP-EXP HYP-EXP LOG-LIN ---- ---
TDIT: 130.13 131.75 132.38 .00 ---
TDII: 24.3 72.1 32.3 ---- ---
TDIL: 3.19 4.28 3.47 ---- ---
Note that the TDI effects are *not* correlated with intensity!
And here
(again unaggregated) for CaF2:
St 831 Set 4 Fluorite U.C. #20011, Results in Elemental Weight Percents
ELEM: F F F F Ca
TYPE: ANAL ANAL ANAL ANAL SPEC
BGDS: LIN LIN LIN EDS
TIME: 100.00 100.00 100.00 80.00 ---
BEAM: 29.95 29.95 29.95 29.95 ---
ELEM: F F F F Ca SUM
XRAY: (ka) (ka) (ka) (ka) ()
223 33.512 32.461 32.533 32.362 51.200 182.067
224 31.706 32.161 32.409 32.734 51.200 180.209
225 31.520 32.164 32.536 32.728 51.200 180.149
226 31.602 32.846 32.228 32.132 51.200 180.008
227 32.700 32.635 32.333 32.447 51.200 181.314
228 32.328 33.019 32.625 32.045 51.200 181.217
229 33.551 32.394 32.476 32.702 51.200 182.323
230 32.759 32.057 32.537 32.546 51.200 181.100
AVER: 32.460 32.467 32.460 32.462 51.200 181.048
SDEV: .815 .345 .129 .268 .000 .875
SERR: .288 .122 .046 .095 .000
%RSD: 2.51 1.06 .40 .83 .00
PUBL: 48.800 48.800 48.800 48.800 51.200 100.000
%VAR: (-33.48)(-33.47)(-33.48)(-33.48) .00
DIFF: (-16.34)(-16.33)(-16.34)(-16.34) .000
STDS: 831 831 831 831 ---
STKF: .1545 .1545 .1545 .1545 ---
STCT: 15.87 47.06 20.31 18.20 ---
UNKF: .1544 .1544 .1544 .1544 ---
UNCT: 15.87 47.06 20.31 18.20 ---
UNBG: .13 .34 .16 .00 ---
ZCOR: 2.1022 2.1022 2.1022 2.1022 ---
KRAW: .9998 1.0000 .9998 .9998 ---
PKBG: 121.53 141.66 125.91 .00 ---
TDI%: 11.326 6.243 4.077 .000 ---
DEV%: .6 .2 .4 .0 ---
TDIF: HYP-EXP HYP-EXP LOG-LIN ---- ---
TDIT: 128.63 130.00 132.50 .00 ---
TDII: 15.9 47.4 20.5 ---- ---
TDIL: 2.77 3.86 3.02 ---- ---
Again, very similar trends in the CaF2 and also uncorrelated with intensity...
So I have a hypothesis, but I'm asking seriously: can anyone explain these observations?


 Please keep your software updated for best results!