I wanted to show the interference corrections in CalcImage so I picked an Fe and FeCu sulfide and so tried to measure Mo in it. As you know, there is a large interference of S ka on Mo La. With a quant analysis of the two minerals we get (15 keV, 100nA, 40 seconds):
Un 5 Reed sulfide, Results in Elemental Weight Percents
ELEM: Fe S Cu Mo Zn Ag Ca SUM
132 45.536 53.359 .039 1.862 .019 .001 .002 100.817
133 45.839 53.387 .082 1.867 .021 .007 .007 101.210
134 45.604 53.253 .091 1.887 .022 .018 .007 100.881
135 45.501 53.360 .034 1.850 .005 -.003 .008 100.754
136 45.604 53.277 .055 1.868 .028 .000 -.019 100.814
AVER: 45.617 53.327 .060 1.867 .019 .004 .001 100.895
SDEV: .132 .059 .025 .013 .009 .008 .011 .182
Un 6 Reed sulfide (CuFe), Results in Elemental Weight Percents
ELEM: Fe S Cu Mo Zn Ag Ca SUM
137 29.300 34.383 33.779 1.231 .036 .048 .003 98.779
138 29.184 34.471 33.914 1.244 .004 .068 -.025 98.861
139 29.176 34.335 33.706 1.241 .030 .073 .002 98.563
140 29.306 34.437 33.654 1.230 .029 .051 .015 98.722
141 29.327 34.501 33.770 1.242 .021 .063 -.005 98.919
AVER: 29.259 34.425 33.764 1.238 .024 .061 -.002 98.769
SDEV: .073 .067 .098 .007 .012 .011 .015 .137
And here are the two minerals again, but this time *with* the interference correction of S on Mo (and also Cu on Zn though it is very small):
Un 5 Reed sulfide, Results in Elemental Weight Percents
ELEM: Fe S Cu Mo Zn Ag Ca
BGDS: LIN LIN LIN LIN EXP LIN LIN
TIME: 40.00 80.00 40.00 40.00 80.00 40.00 40.00
BEAM: 99.98 99.98 99.98 99.98 99.98 99.98 99.98
ELEM: Fe S Cu Mo Zn Ag Ca SUM
132 45.661 53.479 .039 -.032 .019 .001 .002 99.169
133 45.964 53.507 .083 -.027 .021 .007 .007 99.561
134 45.729 53.373 .091 -.002 .022 .017 .007 99.237
135 45.626 53.480 .034 -.042 .005 -.003 .008 99.107
136 45.728 53.397 .056 -.020 .028 .000 -.019 99.170
AVER: 45.742 53.447 .061 -.025 .019 .004 .001 99.249
SDEV: .132 .059 .026 .015 .009 .008 .011 .181
Un 6 Reed sulfide (CuFe), Results in Elemental Weight Percents
ELEM: Fe S Cu Mo Zn Ag Ca
BGDS: LIN LIN LIN LIN EXP LIN LIN
TIME: 40.00 80.00 40.00 40.00 80.00 40.00 40.00
BEAM: 100.02 100.02 100.02 100.02 100.02 100.02 100.02
ELEM: Fe S Cu Mo Zn Ag Ca SUM
137 29.318 34.451 33.847 .012 .020 .048 .003 97.699
138 29.202 34.539 33.983 .023 -.013 .068 -.025 97.778
139 29.194 34.404 33.774 .025 .013 .073 .002 97.485
140 29.325 34.506 33.722 .010 .013 .051 .015 97.642
141 29.346 34.570 33.838 .020 .004 .063 -.005 97.837
AVER: 29.277 34.494 33.833 .018 .007 .061 -.002 97.688
SDEV: .073 .067 .098 .007 .013 .011 .015 .136
I don't like that the interference corrected Mo value on the FeS2 is -0.025 (negative 250 PPM), but it is within less than 2 standard deviations of zero so maybe it's just bad luck... anyway we'll never see that in the x-ray maps.
Still I don't like it and will need to think about what the problem might be... the run was very stable. Standards were automatically run before the unknowns, after the unknowns (and before the x-ray maps) and again, after the x-ray maps as seen here:
Drift array standard intensities (cps/30nA) (background corrected):
ELMXRY: fe ka s ka cu ka mo la zn ka ag la ca ka
MOTCRY: 5 LIF 4 PET 5 LIF 2 LPET 3 LLIF 2 LPET 1 PET
STDASS: 730 730 529 542 530 547 358
STDVIR: 0 0 0 0 0 0 0
2824.4 3845.3 4795.7 8575.2 14586.0 8639.9 1056.7
2822.9 3837.4 4793.2 8587.0 14596.7 8629.6 1059.3
2826.8 3845.7 4792.8 8591.5 14554.8 8643.7 1057.0
I suspect because the interference standard for S on Mo (my standard FeS2), was run at 30 nA, but the unknown was run at 100 nA, there could be an effect from sample damage.
More unfortunately, I decided to run a beam scan rather than a stage scan, and even at 2900x, there is significant Bragg defocussing in the major elements. Also, I forgot and ran the maps at 30nA- the same as my standards, though I meant to run the maps at 100 nA.
So I'll have to try again next weekend.In the meantime here are the Mo and S maps *without* an interference correction:
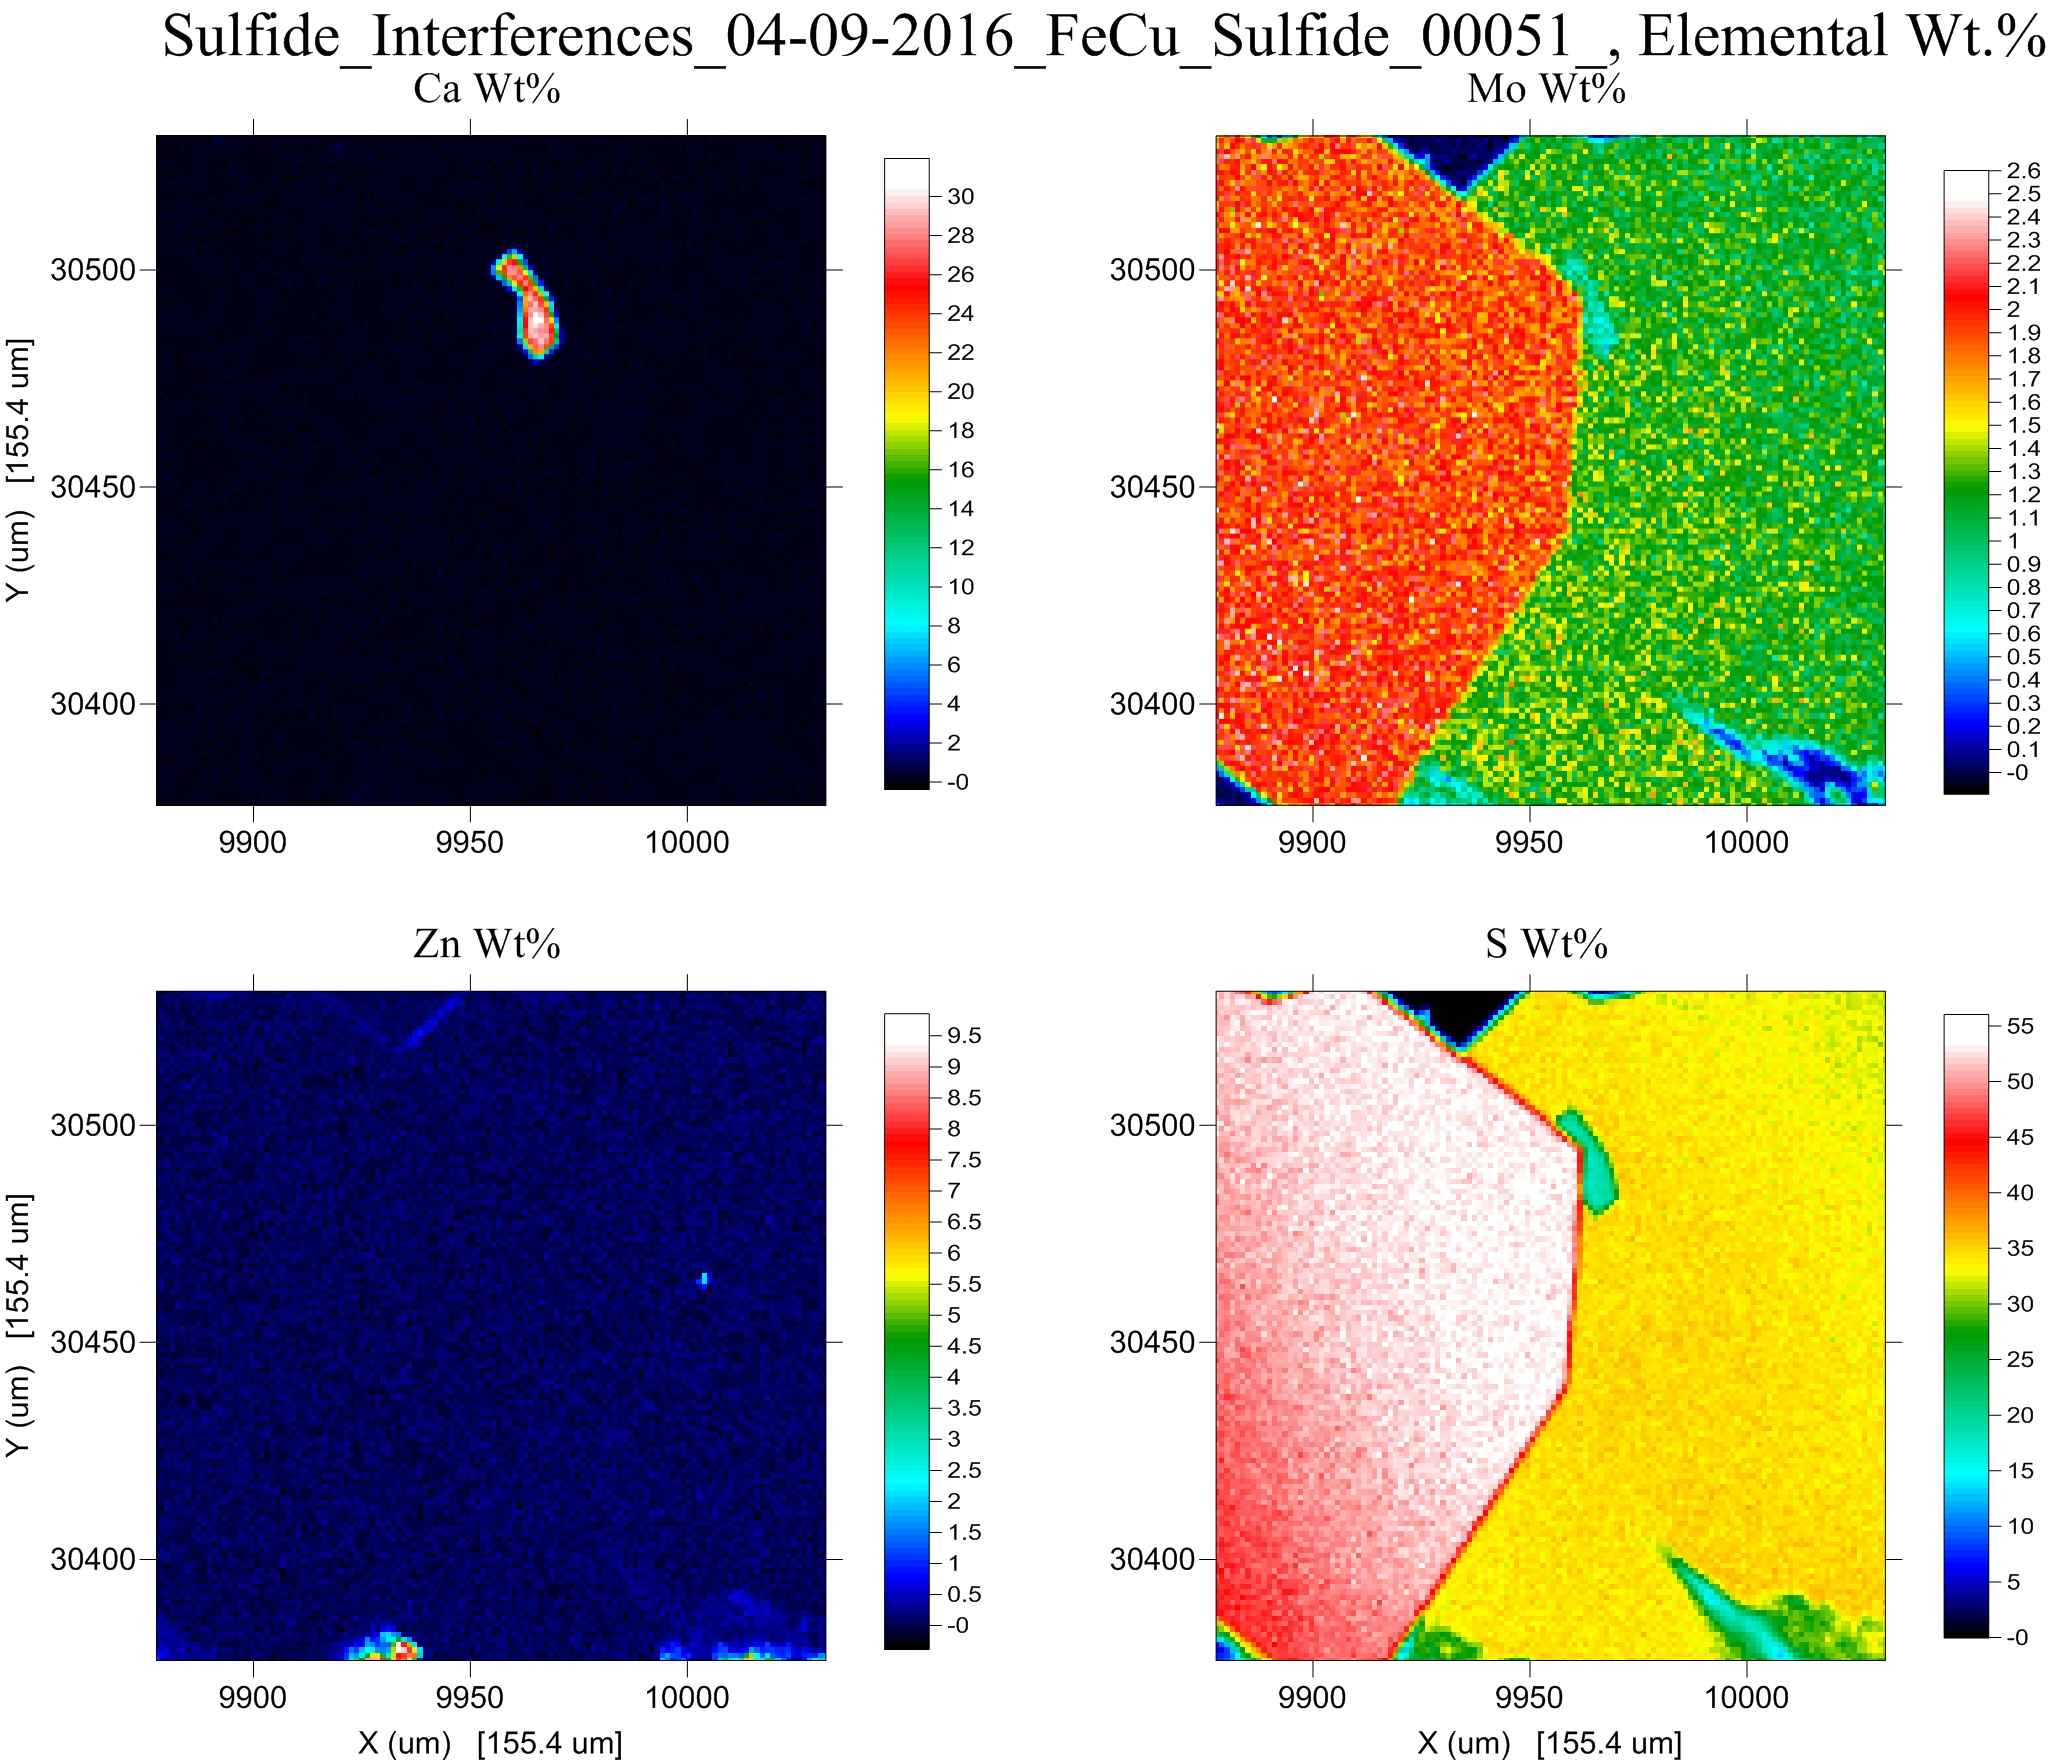
Note the large Bragg defocussing on the sulfur map. This causes a problem with the quantitative interference correction for Mo, though it does try hard as seen here in the interference corrected maps:

The interference corrected Mo concentrations are quite close to zero (yellow-green) for much of the pyrite and Cu-Pyrite grains, except in the lower left corner where most of the Bragg defocusing occurs. I'll try again with a stage scan next weekend at 100nA.


 We are a community of analysts, that cares about EPMA