Now for the trace characterization of Cs La using a PET crystal in our RbTiOPO4 matrix.
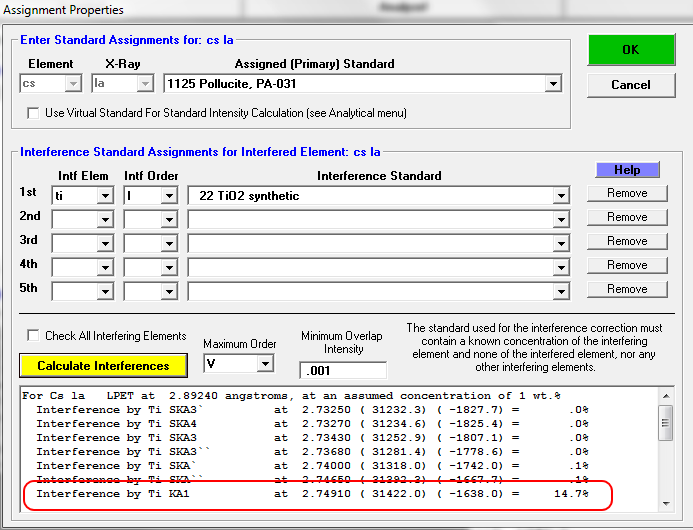
As Brian Joy has pointed out, we really should be using an LIF crystal for this analysis, due to the higher resolution and higher sin theta of the LIF for Cs La, but let's run the experiment. Recall the significant interference from Ti ka due to the tail of the Ti Ka peak:

If we calculate the nominal interferences using the Standard Assignments dialog, we obtain this prediction assuming Gaussian peak overlaps:
 So, without an interference specified let's see what we obtain for our trace elements. First a report on the analytical setup:
Un 4 CalChemist RbTiOPO4 #2
TakeOff = 40.0 KiloVolt = 20.0 Beam Current = 100. Beam Size = 10
(Magnification (analytical) = 20000), Beam Mode = Analog Spot
(Magnification (default) = 1000, Magnification (imaging) = 1000)
Image Shift (X,Y): .00, .00
Compositional analyses were acquired on an electron microprobe (Cameca SX100 (TCP/IP Socket)) equipped with 5 tunable wavelength dispersive spectrometers. Operating conditions were 40 degrees takeoff angle, and a beam energy of 20 keV. The beam current was 100 nA, and the beam diameter was 10 microns.
Elements were acquired using analyzing crystals LPET for K ka, Cs la, Ti ka, P ka, PET for Ca ka, LPET for K ka, Cs la, Ti ka, P ka, and TAP for Na ka, Mg ka.
The standards were TiO2 synthetic for Ti ka, Nepheline (partial anal.) for Na ka, Diopside (Chesterman) for Mg ka, Ca ka, Orthoclase MAD-10 for K ka, YPO4 (USNM 168499) for P ka, and Pollucite, PA-031 for Cs la.
The counting time was 80 seconds for Ti ka, P ka, 320 seconds for K ka, Cs la, and 400 seconds for Mg ka, Na ka, Ca ka. The off peak counting time was 80 seconds for Ti ka, P ka, 320 seconds for K ka, Cs la, and 400 seconds for Mg ka, Na ka, Ca ka. Off Peak correction method was Exponential for Ti ka, P ka, and Multi-Point for Na ka, Ca ka, Mg ka, K ka, Cs la.
Unknown and standard intensities were corrected for deadtime. Standard intensities were corrected for standard drift over time.
Results are the average of 12 points and detection limits ranged from .001 weight percent for K ka to .002 weight percent for Na ka to .003 weight percent for P ka.
Analytical sensitivity (at the 99% confidence level) ranged from .044 percent relative for Ti ka to 4.937 percent relative for Cs la to 70.071 percent relative for Na ka.
The exponential or polynomial background fit was utilized.
See John J. Donovan, Heather A. Lowers and Brian G. Rusk, Improved electron probe microanalysis of trace elements in quartz, American Mineralogist, 96, 274282, 2011
And here are the results (without the interference correction for Ti on Cs La):
Un 4 CalChemist RbTiOPO4 #2, Results in Elemental Weight Percents
ELEM: K Cs Na Ca Mg Ti P Rb O
TYPE: ANAL ANAL ANAL ANAL ANAL ANAL ANAL SPEC SPEC
BGDS: MULT MULT MULT MULT MULT EXP EXP
TIME: 320.00 320.00 400.00 400.00 400.00 80.00 80.00 --- ---
BEAM: 99.63 99.63 99.63 99.63 99.63 99.63 99.63 --- ---
ELEM: K Cs Na Ca Mg Ti P Rb O SUM
37 .018 .028 .001 .003 .000 19.427 12.506 34.979 32.741 99.702
38 .017 .028 .000 .003 .000 19.454 12.522 34.979 32.741 99.744
39 .017 .028 .000 .001 -.001 19.485 12.505 34.979 32.741 99.756
40 .018 .029 .001 .003 .000 19.516 12.542 34.979 32.741 99.828
41 .019 .027 .002 .004 .001 19.465 12.500 34.979 32.741 99.736
42 .018 .028 -.002 .002 -.001 19.446 12.511 34.979 32.741 99.723
43 .018 .027 .001 .002 -.001 19.471 12.568 34.979 32.741 99.805
44 .018 .026 .002 .002 .000 19.445 12.496 34.979 32.741 99.707
45 .018 .026 -.002 .002 .000 19.488 12.478 34.979 32.741 99.730
46 .018 .024 .001 .003 .000 19.527 12.567 34.979 32.741 99.860
47 .018 .026 -.001 .003 -.001 19.489 12.544 34.979 32.741 99.797
48 .019 .028 .001 .002 -.001 19.507 12.506 34.979 32.741 99.781
AVER: .018 .027 .000 .002 .000 19.477 12.520 34.979 32.741 99.764
SDEV: .000 .002 .001 .001 .001 .031 .029 .000 .000 .050
SERR: .000 .000 .000 .000 .000 .009 .008 .000 .000
%RSD: 2.29 5.61 712.86 31.93 -247.65 .16 .23 .00 .00
STDS: 374 1125 336 358 358 22 1016 --- ---
The Ti interference is around 270 PPM in the RbTiOPO4 matrix. Now let's check our TiO2 standard which will be used for the interference correction:
St 22 Set 2 TiO2 synthetic, Results in Elemental Weight Percents
ELEM: K Cs Na Ca Mg Ti P Rb O
TYPE: ANAL ANAL ANAL ANAL ANAL ANAL ANAL SPEC SPEC
BGDS: MULT MULT MULT MULT MULT EXP EXP
TIME: 40.00 40.00 40.00 40.00 40.00 40.00 40.00 --- ---
BEAM: 99.85 99.85 99.85 99.85 99.85 99.85 99.85 --- ---
ELEM: K Cs Na Ca Mg Ti P Rb O SUM
279 .001 .081 .001 -.003 -.001 59.882 .001 .000 40.050 100.011
280 .003 .076 .002 .002 .003 59.955 .000 .000 40.050 100.090
281 .002 .080 .003 .000 .000 59.991 .001 .000 40.050 100.126
282 .002 .079 -.002 .003 .002 59.906 -.002 .000 40.050 100.039
AVER: .002 .079 .001 .000 .001 59.934 .000 .000 40.050 100.067
SDEV: .001 .002 .002 .003 .002 .049 .001 .000 .000 .052
Note the we see an apparent Cs concentration of 790 PPM in our TiO2 due to the interference from Ti Ka.
Now we apply the interference correction by simply selecting Ti as the interfering element and TiO2 as the interference standard (because it contains no Cs, and contains a known amount of the interfering element Ti, and no other interfering elements).
Remember, because the interference correction in Probe for EPMA is iterated and quantitative, the differences in the matrix corrections between the unknown (RbTiOPO4), and the interference standard (TiO2) are properly and automatically dealt with.
Un 4 CalChemist RbTiOPO4 #2, Results in Elemental Weight Percents
ELEM: K Cs Na Ca Mg Ti P Rb O
TYPE: ANAL ANAL ANAL ANAL ANAL ANAL ANAL SPEC SPEC
BGDS: MULT MULT MULT MULT MULT EXP EXP
TIME: 320.00 320.00 400.00 400.00 400.00 80.00 80.00 --- ---
BEAM: 99.63 99.63 99.63 99.63 99.63 99.63 99.63 --- ---
ELEM: K Cs Na Ca Mg Ti P Rb O SUM
37 .018 .002 .001 .003 .000 19.428 12.506 34.979 32.741 99.677
38 .017 .002 .000 .003 .000 19.454 12.521 34.979 32.741 99.719
39 .017 .003 .000 .001 -.001 19.486 12.505 34.979 32.741 99.731
40 .018 .003 .001 .003 .000 19.517 12.542 34.979 32.741 99.803
41 .019 .001 .002 .004 .001 19.466 12.499 34.979 32.741 99.711
42 .018 .002 -.002 .002 -.001 19.447 12.511 34.979 32.741 99.698
43 .018 .001 .001 .002 -.001 19.472 12.568 34.979 32.741 99.780
44 .018 .000 .002 .002 .000 19.445 12.496 34.979 32.741 99.682
45 .018 .000 -.002 .002 .000 19.489 12.478 34.979 32.741 99.704
46 .018 -.002 .001 .003 .000 19.528 12.567 34.979 32.741 99.835
47 .018 .001 -.001 .003 -.001 19.489 12.543 34.979 32.741 99.772
48 .019 .002 .001 .002 -.001 19.507 12.506 34.979 32.741 99.756
AVER: .018 .001 .000 .002 .000 19.477 12.520 34.979 32.741 99.739
SDEV: .000 .002 .001 .001 .001 .031 .029 .000 .000 .050
SERR: .000 .000 .000 .000 .000 .009 .008 .000 .000
%RSD: 2.29 128.51 712.86 31.93 -247.65 .16 .23 .00 .00
STDS: 374 1125 336 358 358 22 1016 --- ---
STKF: .1102 .2652 .0583 .1676 .0644 .5616 .1496 --- ---
STCT: 9129.3 11088.8 1550.4 7022.5 3286.5 64371.5 4913.6 --- ---
UNKF: .0002 .0000 .0000 .0000 .0000 .1753 .0763 --- ---
UNCT: 12.9 .4 .0 .9 -.1 20095.1 2504.8 --- ---
UNBG: 45.8 156.1 11.1 40.4 22.7 132.4 7.6 --- ---
ZCOR: 1.1552 1.1604 2.6811 1.0545 1.8314 1.1110 1.6413 --- ---
KRAW: .0014 .0000 .0000 .0001 .0000 .3122 .5098 --- ---
PKBG: 1.28 1.00 1.00 1.02 1.00 152.73 330.98 --- ---
INT%: ---- -95.91 ---- ---- ---- ---- ---- --- ---
Note that with the interference correction turned on, the apparent 270 PPM of Cs now disappears, and the interference correction magnitude is -95.91 %, which tells us that all the apparent Cs was in fact spurious.
So now we see only around ~180 PPM of potassium and maybe 20-30 PPM of Ca, and that is all.


 We depend on your feedback and ideas!