Author Topic: Quant analysis of Ka vs. La/Ll/Ln lines for first row transition elements  (Read 4412 times)

Probeman

  • Emeritus
  • *****
  • Posts: 2858
  • Never sleeps...
    • John Donovan
I usually try to avoid starting a new topic unless absolutely necessary, but it seems appropriate for this discussion, though there are some related topics on using "non traditional" emission lines for quantification of Fe, Ni, etc. especially at low energy or low overvoltage situations:

http://probesoftware.com/smf/index.php?topic=565.0

http://probesoftware.com/smf/index.php?topic=954.0

http://probesoftware.com/smf/index.php?topic=69.msg6462#msg6462

Anyway, as part of our lab practicals my EPMA class attempted to measure Fe in pyrite (FeS2) and magnetite (Fe3O4) using pure iron as the primary standard. That is peaking and standardizing on the pure iron metal standard. First pyrite as seen here:


and then magnetite as seen here:


Bottom line, it all depends on which MACs one selects for the L lines, but the Ll and Ln lines work somewhat for pyrite (though not great), but all the L emission lines are really unusable for the oxide phase.  Has anybody tried using integrated intensity acquisitions for quantifying the Fe (and Ni, etc.) L family emission lines?
john
« Last Edit: April 12, 2020, 03:07:07 PM by John Donovan »
The only stupid question is the one not asked!

Probeman

  • Emeritus
  • *****
  • Posts: 2858
  • Never sleeps...
    • John Donovan
Re: Quant analysis of Ka vs. La/Ll/Ln lines for first row transition elements
« Reply #1 on: November 20, 2017, 02:04:25 PM »
Our EPMA class went back and performed wavescans on both magnetite and pyrite (our previous scans were only on Fe metal).


And lo and behold, there is a significant off-peak interference on the low off-peak position for magnetite (due to the tail of the oxygen peak), which at least partially explains why the magnetite quant results had larger errors. This is a nice example of why we should check our background positions in all the compositional matrices we are quantifying!

In our next class, we will attempt again to quant both magnetite and pyrite and again report the results here.
john
« Last Edit: April 12, 2020, 03:07:23 PM by John Donovan »
The only stupid question is the one not asked!

Probeman

  • Emeritus
  • *****
  • Posts: 2858
  • Never sleeps...
    • John Donovan
Re: Quant analysis of Ka vs. La/Ll/Ln lines for first row transition elements
« Reply #2 on: November 21, 2017, 12:45:56 PM »
In our next class, we will attempt again to quant both magnetite and pyrite and again report the results here.

The class quant effort will have to wait until after Thanksgiving, but in the meantime I noticed something interesting about the above scan, shown here again, but with the Fe L absorption edges visible:


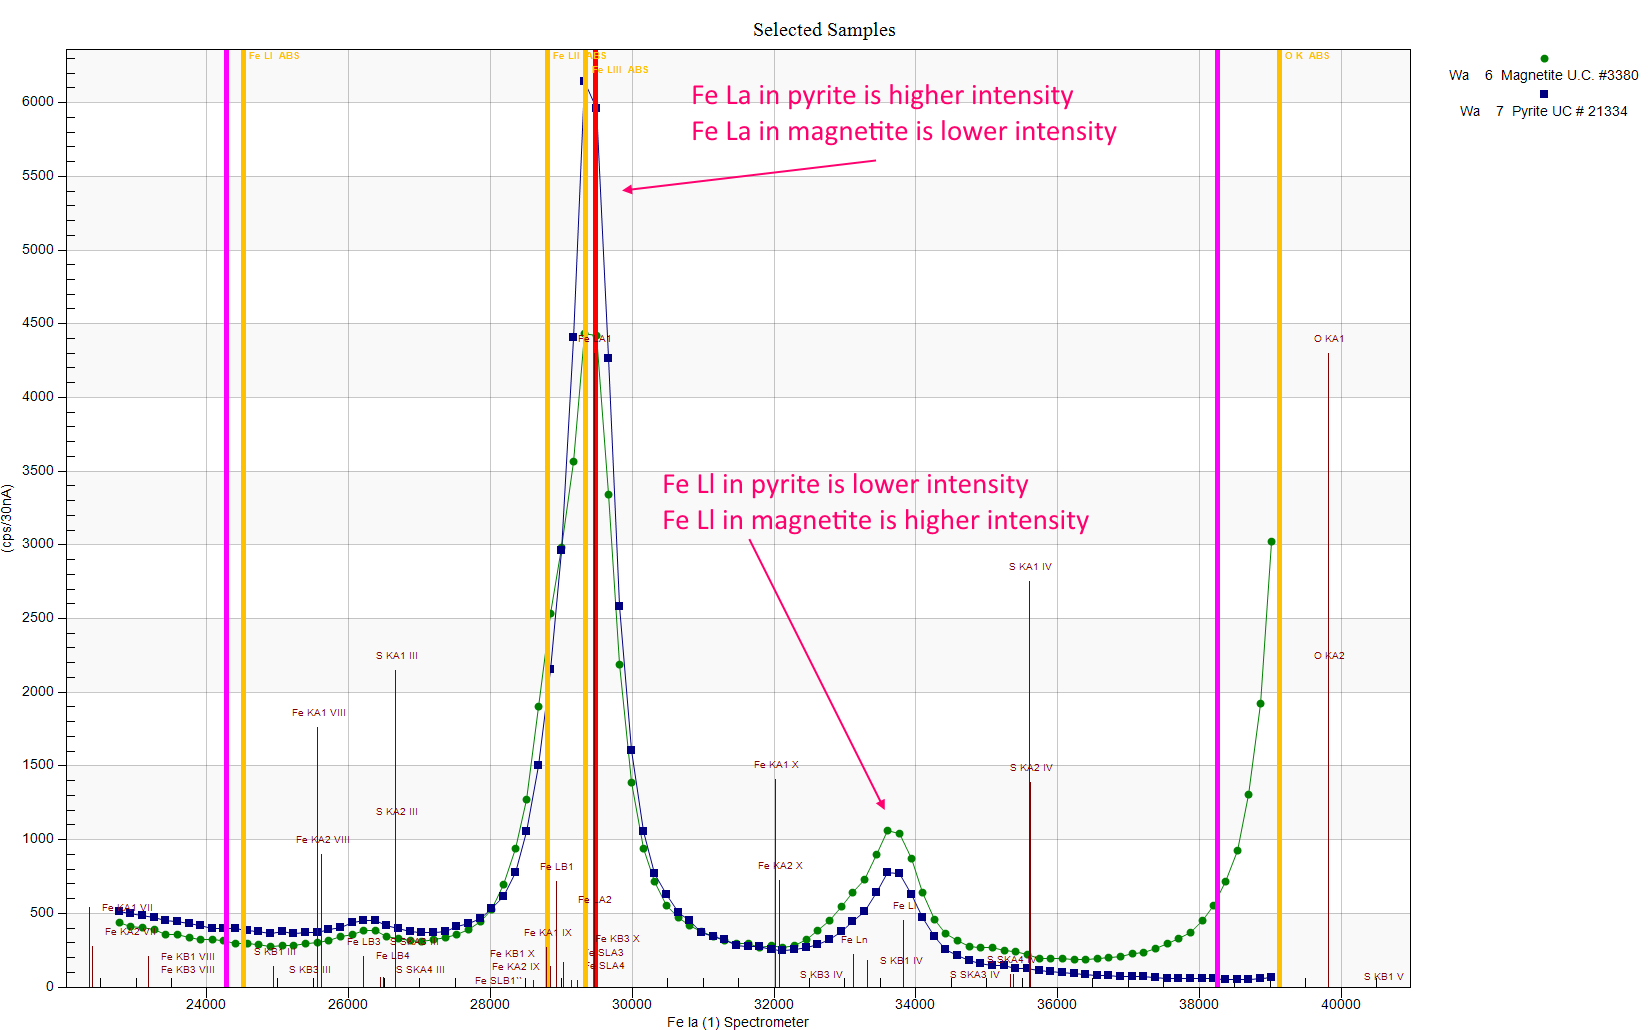
Note that although there is more Fe in magnetite then pyrite, the Fe La line is less intense in magnetite, while the Fe Ll line has the opposite relationship.  My understanding is that this is because the Fe La emission energy varies with the chemical state of the Fe (in magnetite vs. pyrite), therefore the Fe L III edge can fall on either side of the Fe La emission line depending on this chemical state.  Which in turn affects how much the Fe La emission is absorbed by the Fe L III edge.   

That is, if the Fe La emission line is higher energy than the Fe L III edge (Fe L III edge falls to the right of the emission line in wavelength space), the Fe La emission line can excite the Fe L III edge and therefore is readily absorbed.  But if the Fe L III absorption edge falls to the left of the Fe La emission line (the Fe emission line is lower energy than the Fe L III edge), the Fe La emission line is not so readily absorbed.


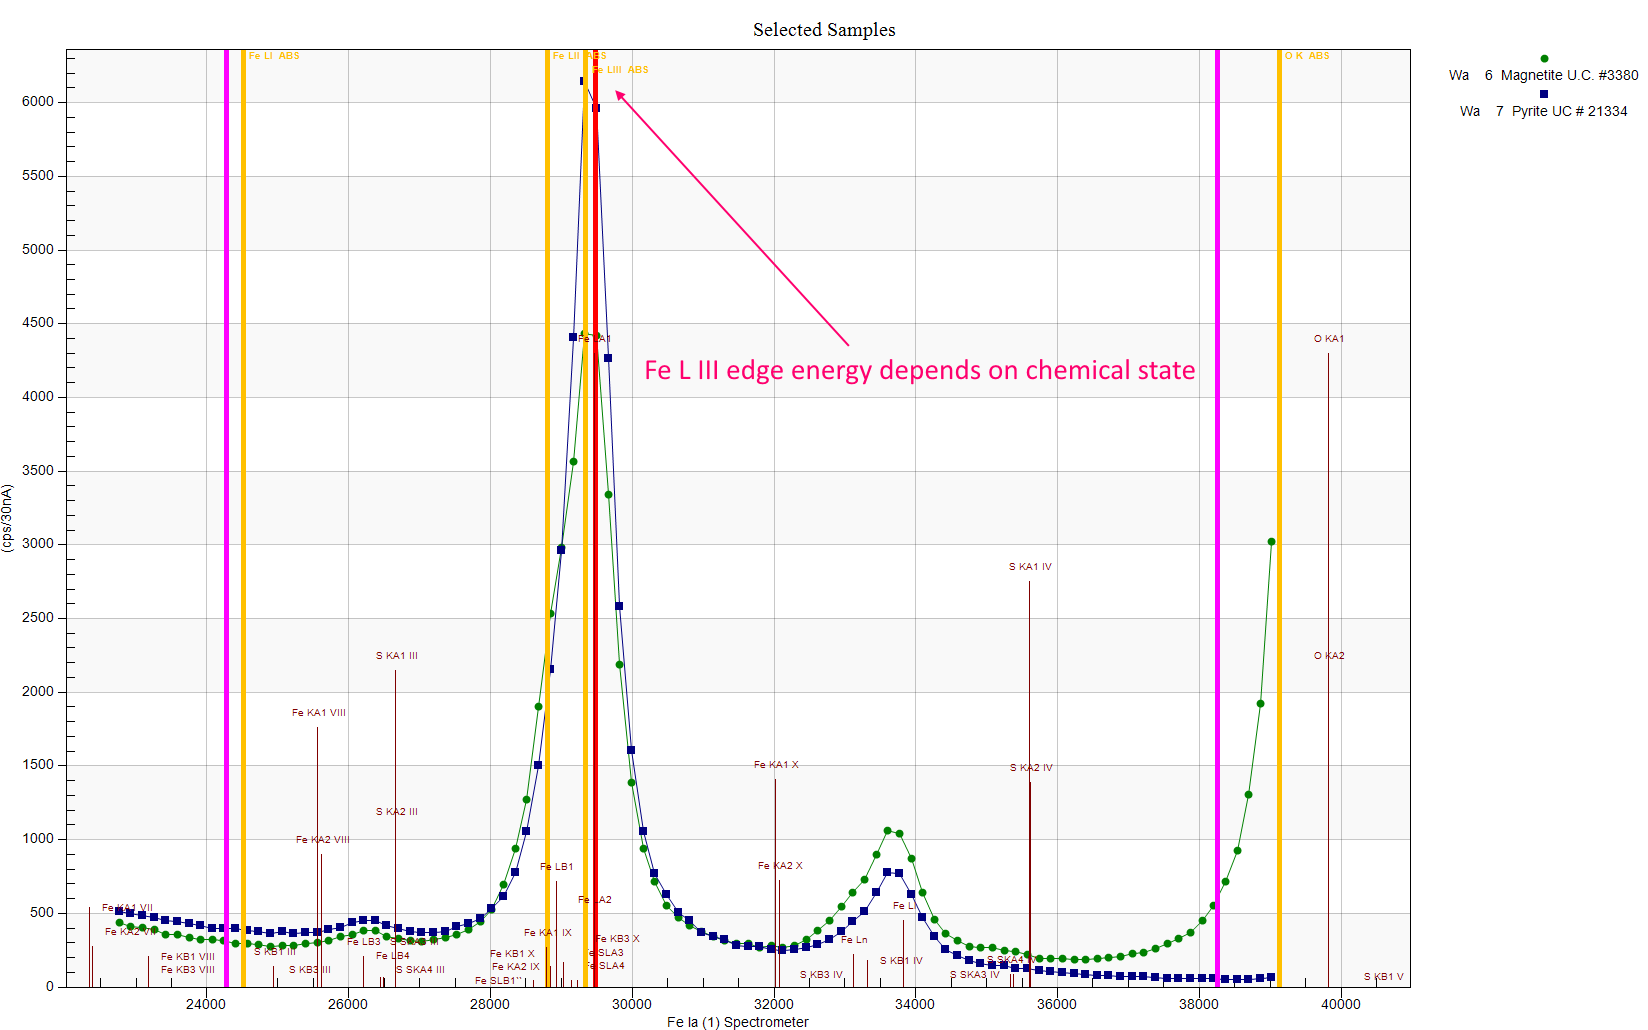
If you look closely one can see that the magnetite Fe La emission line (green symbols) is slightly shifted to the left, which means it's higher energy, which means it would be more absorbed by the Fe L III edge, and that makes sense because the magnetite Fe La intensity is less.  I should have the class scan the Fe La region using a TAP crystal and then we would see this energy shift in more detail...

So this is why the Fe Ll emission line is preferred for quantification, rather than the Fe La line. 

Interesting stuff.
john
« Last Edit: April 12, 2020, 03:07:40 PM by John Donovan »
The only stupid question is the one not asked!

Ben Buse

  • Professor
  • ****
  • Posts: 499
Re: Quant analysis of Ka vs. La/Ll/Ln lines for first row transition elements
« Reply #3 on: February 27, 2018, 03:58:50 AM »
Hi John,

Remond et al. 2002 looked at FeO and Fe2O3 Fe L line

Decomposition of Wavelength Dispersive X-Ray Spectra

https://www.ncbi.nlm.nih.gov/pmc/articles/PMC4863852/

I've been looking at Fe L quantification in olivine

https://doi.org/10.1017/S1431927618000041
Ben
« Last Edit: March 12, 2018, 08:31:46 AM by Ben Buse »

Probeman

  • Emeritus
  • *****
  • Posts: 2858
  • Never sleeps...
    • John Donovan
I finally got around to plotting up the data from the Fall(!) EPMA class after we had modified the backgrounds to be better positioned. The plots from the first attempt by the class are here (above in this topic):

http://probesoftware.com/smf/index.php?topic=989.msg6466#msg6466

Here are the new plots with the adjusted background positions. First the pyrite standard at 8, 12, 16 and 24 keV:


and here is the magnetite:


The pyrite quant isn't much different (I plotted the new plots on the same scale as the first attempt), but the modified backgrounds improved the magnetite quant.

The class learned that it's a good idea to stick with the Fe Ka emission line for quantification!    :D
« Last Edit: April 12, 2020, 03:11:44 PM by John Donovan »
The only stupid question is the one not asked!