Author Topic: Change in peak shape over time  (Read 15590 times)

Brian Joy

  • Professor
  • ****
  • Posts: 296
Change in peak shape over time
« on: December 09, 2016, 10:22:42 AM »
While collecting scans on elemental Si to compare with the ones that John Donovan collected for assessing FWHM, I noticed something disturbing that I was hoping someone would be able to explain for me.  When I compare a scan across the Si Ka peak position that I collected using PETL today (9 Dec 2016) versus one that I collected on 8 Feb 2012 under exactly the same conditions (see plot below), I see that the peak shape has changed significantly.  I note the same behavior on the other two spectrometers that have PET crystals (one of them “high-intensity”).  On the high-Bragg-angle side of the peak, the two scans look essentially identical.  However, on the low-angle side, resolution appears to have deteriorated significantly so that the satellites of Si Ka are no longer clearly separated from the main peak and so that FWHM is larger than it used to be.  Also, count rate at the Si Ka peak position is much lower than it used to be, noting that I’ve normalized to peak counts in order to facilitate comparison of peak shapes.

Does anyone have an explanation for this change in peak shape over time?

« Last Edit: April 14, 2020, 12:17:23 PM by John Donovan »
Brian Joy
Queen's University
Kingston, Ontario
JEOL JXA-8230

Probeman

  • Emeritus
  • *****
  • Posts: 2856
  • Never sleeps...
    • John Donovan
Re: Change in peak shape over time
« Reply #1 on: December 09, 2016, 10:29:20 AM »
While collecting scans on elemental Si to compare with the ones that John Donovan collected for assessing FWHM, I noticed something disturbing that I was hoping someone would be able to explain for me.  When I compare a scan across the Si Ka peak position that I collected using PETL today (9 Dec 2016) versus one that I collected on 8 Feb 2012 under exactly the same conditions (see plot below), I see that the peak shape has changed significantly.  I note the same behavior on the other two spectrometers that have PET crystals (one of them “high-intensity”).  On the high-Bragg-angle side of the peak, the two scans look essentially identical.  However, on the low-angle side, resolution appears to have deteriorated significantly so that the satellites of Si Ka are no longer clearly separated from the main peak and so that FWHM is larger than it used to be.  Also, count rate at the Si Ka peak position is much lower than it used to be, noting that I’ve normalized to peak intensity in order to facilitate comparison of peak shapes.

Does anyone have an explanation for this change in peak shape over time?

Hi Brian,
Yes, this is a known problem with JEOL high intensity crystals as discussed here:

http://probesoftware.com/smf/index.php?topic=611.msg4215#msg4215

It is due to the extreme bending of the crystal, to fit the 100 mm Roland circle spectrometers, which causes it to fracture prematurely.
john
The only stupid question is the one not asked!

Brian Joy

  • Professor
  • ****
  • Posts: 296
Re: Change in peak shape over time
« Reply #2 on: December 09, 2016, 11:24:03 AM »
While collecting scans on elemental Si to compare with the ones that John Donovan collected for assessing FWHM, I noticed something disturbing that I was hoping someone would be able to explain for me.  When I compare a scan across the Si Ka peak position that I collected using PETL today (9 Dec 2016) versus one that I collected on 8 Feb 2012 under exactly the same conditions (see plot below), I see that the peak shape has changed significantly.  I note the same behavior on the other two spectrometers that have PET crystals (one of them “high-intensity”).  On the high-Bragg-angle side of the peak, the two scans look essentially identical.  However, on the low-angle side, resolution appears to have deteriorated significantly so that the satellites of Si Ka are no longer clearly separated from the main peak and so that FWHM is larger than it used to be.  Also, count rate at the Si Ka peak position is much lower than it used to be, noting that I’ve normalized to peak intensity in order to facilitate comparison of peak shapes.

Does anyone have an explanation for this change in peak shape over time?

Hi Brian,
Yes, this is a known problem with JEOL high intensity crystals as discussed here:

http://probesoftware.com/smf/index.php?topic=611.msg4215#msg4215

It is due to the extreme bending of the crystal, to fit the 100 mm Roland circle spectrometers, which causes it to fracture prematurely.
john

But this is occurring on all three spectrometers with *PET* crystals (PET, PETL, and PETH).  I guess I'll vent the machine and check for cracks at least in PETL.
Brian Joy
Queen's University
Kingston, Ontario
JEOL JXA-8230

Anette von der Handt

  • Global Moderator
  • Professor
  • *****
  • Posts: 355
    • UMN Probelab
Re: Change in peak shape over time
« Reply #3 on: December 09, 2016, 12:27:32 PM »
Yep, that looks like a cracked crystal to me. At least based on what I heard from other people that told me about these double peaks showing up. It occurs preferentially on the H-Type, especially the TAPH but I guess it could happen on Some people also think it is twinning but then it would have been present from the beginning.

Do you see it on other peaks on the PET's too? I attached some scans on PETL that I got from Sergei Matveev in Utrecht. He thinks that it is related to twinning but it may be that the crystal simply cracked on transport. It seems to otherwise meet specs. Depending on your specs you might be able to complain to JEOL.

The fact that you see it on all three spectrometers and in such a short time frame is really troubling though. Got a lot of temperature variation in your lab? As I remember, the PET's are the most temperature-sensitive.
Against the dark, a tall white fountain played.

Probeman

  • Emeritus
  • *****
  • Posts: 2856
  • Never sleeps...
    • John Donovan
Re: Change in peak shape over time
« Reply #4 on: December 09, 2016, 12:45:30 PM »
But this is occurring on all three spectrometers with *PET* crystals (PET, PETL, and PETH).  I guess I'll vent the machine and check for cracks at least in PETL.

Oh, that is nasty!   But still could be cracking.

On my LPET crystals (but not the normal PET crystals), on my SX100 I see this, which is not due to cracks (I checked), but could be due to some plastic deformation I suppose...in this discussion on Bragg crystals and observed peak shapes here from a few years ago:

http://probesoftware.com/smf/index.php?topic=18.0

While you've got the spectrometer(s) open you should also check the TAPH crystals if you have any.  That is a known problem for JEOL instruments. In fact I think JEOL doesn't sell these H type spectrometers any more?
john
« Last Edit: December 09, 2016, 01:05:55 PM by Probeman »
The only stupid question is the one not asked!

Brian Joy

  • Professor
  • ****
  • Posts: 296
Re: Change in peak shape over time
« Reply #5 on: December 09, 2016, 01:49:44 PM »
Hi John and Annette,

I've been scouring my collection of wavelength scans, and I find that the behavior of PETH has been changing over time, with resolution gradually deteriorating (see plot below and note that the previous plot was from PETL).  It appears that the same changes have occurred on the PET and PETL crystals, though I need to investigate this more thoroughly.  When I vented the instrument, I believe I was able to see a small crack in PETL, had a hard time getting a good view of PET, and saw no obvious flaws in PETH.

Variation in appearance of Si Ka and satellites on PETH over time:

« Last Edit: April 14, 2020, 11:28:35 AM by John Donovan »
Brian Joy
Queen's University
Kingston, Ontario
JEOL JXA-8230

Anette von der Handt

  • Global Moderator
  • Professor
  • *****
  • Posts: 355
    • UMN Probelab
Re: Change in peak shape over time
« Reply #6 on: December 09, 2016, 03:00:53 PM »
Fascinating! I guess that would fit more to plastic deformation (not sure I quite understand what this means in this context though. Relaxation?) rather than catastrophic cracking. Did the peak counts change over time?

I would contact JEOL about this and see what they say.

Also, where did you get the pollucite from? Do you use it as a standard?
Against the dark, a tall white fountain played.

Brian Joy

  • Professor
  • ****
  • Posts: 296
Re: Change in peak shape over time
« Reply #7 on: December 10, 2016, 08:34:07 PM »
Fascinating! I guess that would fit more to plastic deformation (not sure I quite understand what this means in this context though. Relaxation?) rather than catastrophic cracking. Did the peak counts change over time?

I would contact JEOL about this and see what they say.

Also, where did you get the pollucite from? Do you use it as a standard?

Certainly fascinating, but also deeply disturbing.

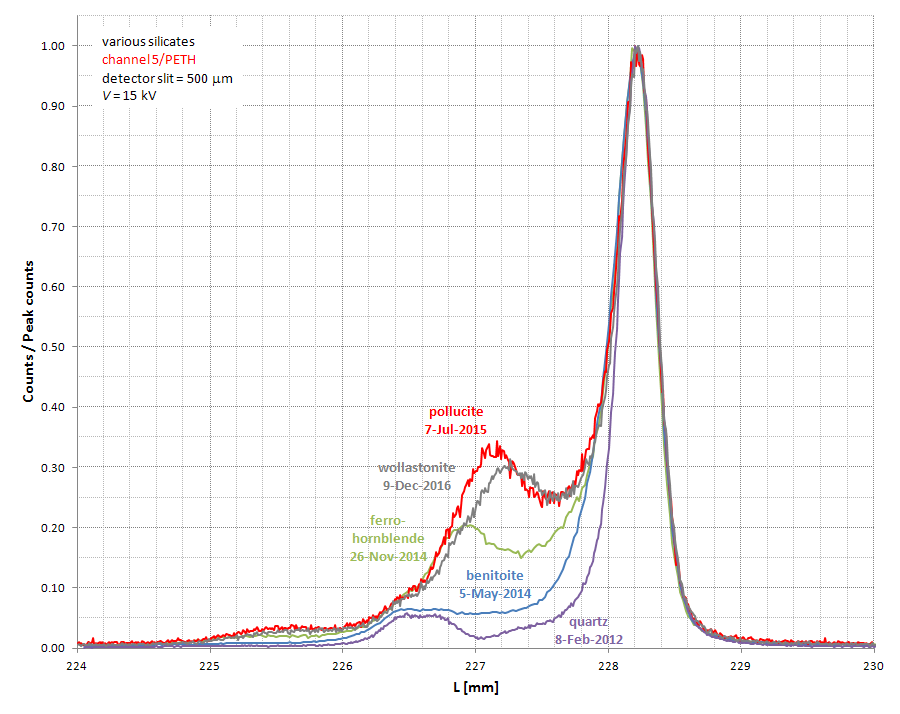
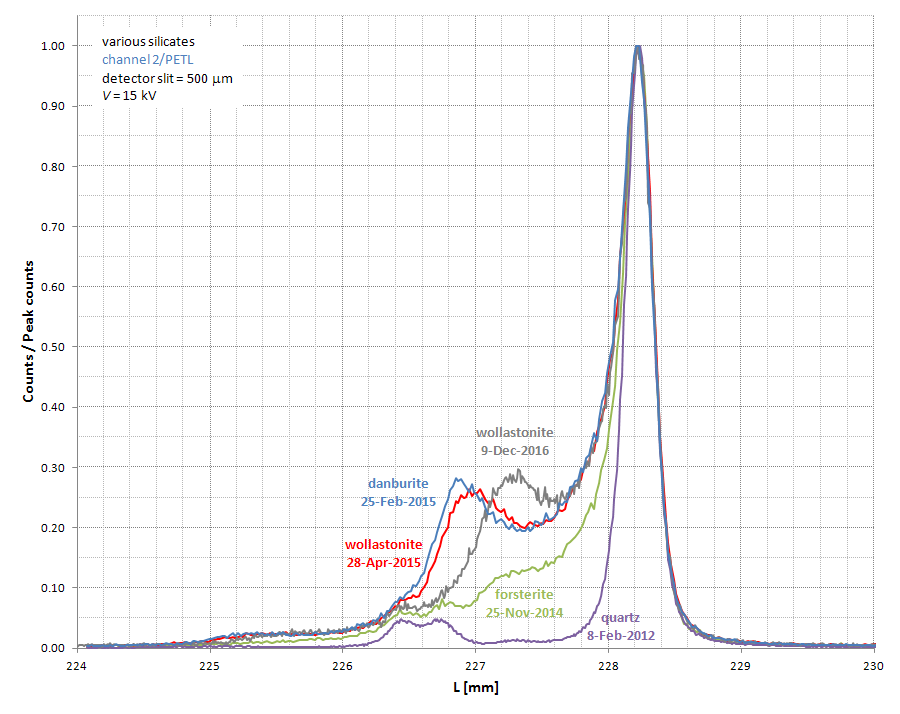
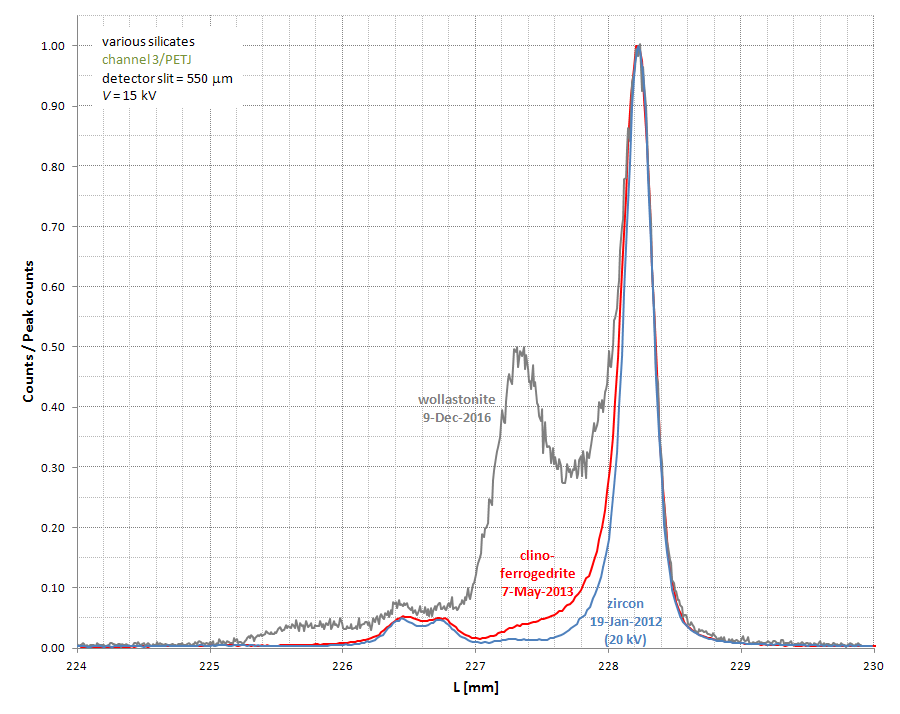
Yes, all else being constant, count rate at the Si Ka peak position has decreased for each of the crystals, as more counts are now distributed across a broader range of Bragg angles.  Below are plots for each of the three PET crystals showing variation in appearance of Si Ka and its satellites over time (noting that I usually scan across high Bragg angles using PETH and PETL since they produce greater count rates than PETJ, hence the lack of data for the last one).

I measure Ca Ka peak position and count rate (on wollastonite) generally every few days using each of the three PET crystals.  Had any of the crystals cracked over the interval of time covered by the plots below, I would have expected to see an abrupt drop in count rate and shift in peak position.  I’ve only seen such behavior on two occasions due to shift in position of a baseplate.

Regarding the possible effects of temperature changes and noting the relatively large coefficient of thermal expansion of PET, I keep a continuous record of temperature and humidity in the lab using a Lascar EL-USB-RT real-time data logger.  Note that the most dramatic changes in Si Ka peak shape on PETL occurred during the period late November, 2014 through late February, 2015.  During the cooler months, lab temperature is the most stable and generally oscillates between about 19 and 21.5 C (thermostat is set at 21 C).  The highest temperature I've seen in the lab is 23.8 C in July, 2013 during an A/C malfunction (refrigerant leak).   

I obtained the pollucite from the Royal Ontario Museum; it’s from Hebron, Maine.  I use it as a standard because it’s the only material I have that contains a large quantity of Cs.  However, I regard is as being relatively poorly characterized (see my post here).  This is why I’ve been so interested in getting a good Cs standard such as Cs2Zr(PO4)2 from Marc Schrier.

Si Ka scans over time using PETH (channel 5):


Si Ka scans over time using PETL (channel 2):


Si Ka scans over time using PETJ (channel 3):


« Last Edit: April 13, 2020, 10:29:38 PM by John Donovan »
Brian Joy
Queen's University
Kingston, Ontario
JEOL JXA-8230

Brian Joy

  • Professor
  • ****
  • Posts: 296
Re: Change in peak shape over time
« Reply #8 on: December 13, 2016, 02:28:33 PM »
After speaking with the JEOL office in Peabody, Mass. and collecting some SE images with an “electron mirror,” I now have a plausible explanation for the deterioration in resolution of the three PET crystals at high Bragg angles:  the static filter is not functioning correctly, and this has probably been the case for some time.  Thus the diffracting crystals (and other parts of the spectrometers) have been bombarded on a daily basis with backscattered electrons.  This probably heated the PET crystals sufficiently that their surfaces have become damaged.  In looking at an “electron mirror” SE image that I collected in May, 2015 in order to document a problem with the BSE detector, I can clearly see the diffracting crystals.  Live and learn, I guess.
Brian Joy
Queen's University
Kingston, Ontario
JEOL JXA-8230

Anette von der Handt

  • Global Moderator
  • Professor
  • *****
  • Posts: 355
    • UMN Probelab
Re: Change in peak shape over time
« Reply #9 on: December 14, 2016, 12:06:46 PM »
Well, that makes sense. Based on your data the electron trap must have been malfunctioning almost from the get go. Any other indication in hindsight? Do you see also heat damage on the other crystal types or is it the most pronounced on the PET?

And just to understand and be able to keep an eye on my own system. When I just checked my machine I can't see the crystals and but what one would see in your case is what this person shows on youtube (crystal flipping seen in electron mirror video): https://www.youtube.com/watch?v=N7KVf1vtTn0&feature=youtu.be

Thanks
Against the dark, a tall white fountain played.

Brian Joy

  • Professor
  • ****
  • Posts: 296
Re: Change in peak shape over time
« Reply #10 on: December 14, 2016, 01:16:09 PM »
Well, that makes sense. Based on your data the electron trap must have been malfunctioning almost from the get go. Any other indication in hindsight? Do you see also heat damage on the other crystal types or is it the most pronounced on the PET?

And just to understand and be able to keep an eye on my own system. When I just checked my machine I can't see the crystals and but what one would see in your case is what this person shows on youtube (crystal flipping seen in electron mirror video): https://www.youtube.com/watch?v=N7KVf1vtTn0&feature=youtu.be

Thanks

Hi Annette,

Yes, it appears that the static filter has been malfunctioning for quite some time, but there is no way to know exactly how long this has been going on.  It appears that only the PET crystals were affected adversely.  The main reason that I didn't catch it sooner is that peak shapes at lower Bragg angles (for instance, Ca Ka) have only changed very slightly, and count rates at the lower L values have not decreased much.

The video shows exactly what I can see, regardless of whether the static filter is turned "on" or "off" in the PC-SEM FT menu (which I don't normally fiddle with).  I'm not sure why the author of the video didn't stress that you shouldn't normally be able to see the diffracting crystals with the electron mirror.  Working from the FT menu, another way to verify that the static filter is working is to check for a change in brightness of the SE image when the "electrostatic deflector" switch is toggled on/off.
Brian Joy
Queen's University
Kingston, Ontario
JEOL JXA-8230

Probeman

  • Emeritus
  • *****
  • Posts: 2856
  • Never sleeps...
    • John Donovan
Re: Change in peak shape over time
« Reply #11 on: December 15, 2016, 08:22:44 AM »
Yes, it appears that the static filter has been malfunctioning for quite some time, but there is no way to know exactly how long this has been going on.  It appears that only the PET crystals were affected adversely.  The main reason that I didn't catch it sooner is that peak shapes at lower Bragg angles (for instance, Ca Ka) have only changed very slightly, and count rates at the lower L values have not decreased much.

Hi Brian,
I guess that is one advantage of the Cameca column design in that, because of the polypropylene column separation windows between the sample chamber and the spectrometers, these stray electrons are effectively shielded from the Bragg crystals.
john
The only stupid question is the one not asked!

Brian Joy

  • Professor
  • ****
  • Posts: 296
Re: Change in peak shape over time
« Reply #12 on: January 27, 2017, 07:40:41 PM »
Here is an update on the problem that I’ve been having with damage to our PET crystals due to prolonged failure of the static filter:  As an experiment, a JEOL engineer recently applied a “washing” (i.e. dissolving) technique to the PETJ crystal in order to remove damage at the near-surface of the crystal.  Note that PET is significantly water- and ethanol-soluble.  The technique – actually devised at the factory in Japan, believe it or not – consists of mixing 9 parts (by volume) of 190-proof ethanol with 1 part of distilled water and then immersing the crystal for four 30-second intervals in a Petri dish filled with this mixture, sloshing it around (appropriately, I’m sloshed at the moment), and then removing it after each interval and pushing remaining liquid off using a compressed gas canister.   After the fourth iteration of the procedure, we quickly placed the crystal in the carbon coater under rough vacuum in order to vaporize any remaining liquid, some of which had infiltrated between the crystal and brass mount.  Upon removal from the carbon coater, the crystal appeared clear, featureless, and somewhat thinner.  The curvature of the crystal appeared to have been maintained, at least qualitatively.

I’ve done some testing of the crystal, and the results are mixed.  At high Bragg angle, the resolution and count rate are improved remarkably.  Below are scans across Si Ka completed before the procedure (8 Dec 2016) and after (20 Jan 2017).  The parasitic peak at L-value just below that of the main peak has virtually disappeared, and the satellites are now clearly visible; further, FWHM has improved.  Unfortunately, at low Bragg angle – for instance for Cr Ka – exactly the opposite has happened.  A shoulder now appears on the low-L side of the peak, and count rate at the main peak position has decreased to the point that it just barely produces 80% of the factory-specified value (which is 4.7 x 10^6 cps/microamp absorbed) under the factory-specified conditions (accelerating potential = 25 kV, detector slit = 300 microns, detector anode voltage = 1750 V, detector gain factor = 64, SCA mode = integral).  Though I don’t have an illustration to show, the Cr Ka peak now appears similar to the one that Anette described/attached here.

Due to the poor performance at low Bragg angle, I cannot consider the procedure to be a success.

I think I need another beer.


« Last Edit: April 13, 2020, 09:44:28 PM by John Donovan »
Brian Joy
Queen's University
Kingston, Ontario
JEOL JXA-8230

Probeman

  • Emeritus
  • *****
  • Posts: 2856
  • Never sleeps...
    • John Donovan
Re: Change in peak shape over time
« Reply #13 on: January 28, 2017, 08:27:18 AM »
Here is an update on the problem that I’ve been having with damage to our PET crystals due to prolonged failure of the static filter:  As an experiment, a JEOL engineer recently applied a “washing” (i.e. dissolving) technique to the PETJ crystal in order to remove damage at the near-surface of the crystal.  Note that PET is significantly water- and ethanol-soluble.  The technique – actually devised at the factory in Japan, believe it or not – consists of mixing 9 parts (by volume) of 190-proof ethanol with 1 part of distilled water and then immersing the crystal for four 30-second intervals in a Petri dish filled with this mixture, sloshing it around (appropriately, I’m sloshed at the moment), and then removing it after each interval and pushing remaining liquid off using a compressed gas canister.   After the fourth iteration of the procedure, we quickly placed the crystal in the carbon coater under rough vacuum in order to vaporize any remaining liquid, some of which had infiltrated between the crystal and brass mount.  Upon removal from the carbon coater, the crystal appeared clear, featureless, and somewhat thinner.  The curvature of the crystal appeared to have been maintained, at least qualitatively.

This reminds me of a Bragg crystal "dipping" procedure that Jim Niccolino showed me once for my TAP crystals on my first (ARL SEMQ) instrument.

When I inherited the instrument, it was already about 20 years old and the intensity from F Ka was pretty poor. Using a glove (TAP is very toxic), we dipped the crystal 3 or 4 times in distilled water and allowed it to dry.

As was the case for Brian, we had mixed results, the fluorine reflectivity improved slightly but sodium and magnesium signals were worse than before.
john
The only stupid question is the one not asked!

Brian Joy

  • Professor
  • ****
  • Posts: 296
Re: Change in peak shape over time
« Reply #14 on: January 28, 2017, 06:53:48 PM »
Maybe I was a bit overly negative in assessing the effects of “washing” the PETJ crystal on count rates and peak shapes at low Bragg angles.  I dug up an old wavelength scan across Cr Ka on PETJ and collected a new scan at identical conditions today.  I collected the old scan in December, 2014 after significant damage had already occurred to the crystal; I’m not sure if I have a scan across Cr Ka on PETJ that pre-dates the damage.  The beam current (100 nA) was a little high, as I was more interested in a concurrent scan on LiFL; however, the peak shape is “normal” (i.e., it is not truncated due to excessively high count rate), though the deadtime correction is large.  The scan that I collected today does reveal that the peak now possesses a shoulder on the low-L side, but FWHM is not affected greatly.  Also, the peaks at low Bragg angles have always looked a bit asymmetric using this crystal.  Regardless, as I noted above, the count rate on Cr Ka at best only just barely meets the factory criterion for acceptability.  When it was new (2011), it passed with flying colors.  The count rate at higher Bragg angle, for instance for Mo La, now easily meets the factory criterion.


« Last Edit: April 13, 2020, 07:13:02 PM by John Donovan »
Brian Joy
Queen's University
Kingston, Ontario
JEOL JXA-8230