Author Topic: Plotting PFE wavescans in DTSA II  (Read 5471 times)

Ben Buse

  • Professor
  • ****
  • Posts: 499
Plotting PFE wavescans in DTSA II
« on: November 28, 2016, 12:25:15 PM »
Hi,

I've written a R script to plot PFE WDS wavescans in DTSAII for viewing, which maybe useful, or at least here are the pitfalls.

For each MDB it generates emsa and xy text files for each sample and each element/spectrometer. It also generates a ggplot for each element/spectrometer.

3 folders are created

(1) Temp - xy files
(2) L value

(3) Energy


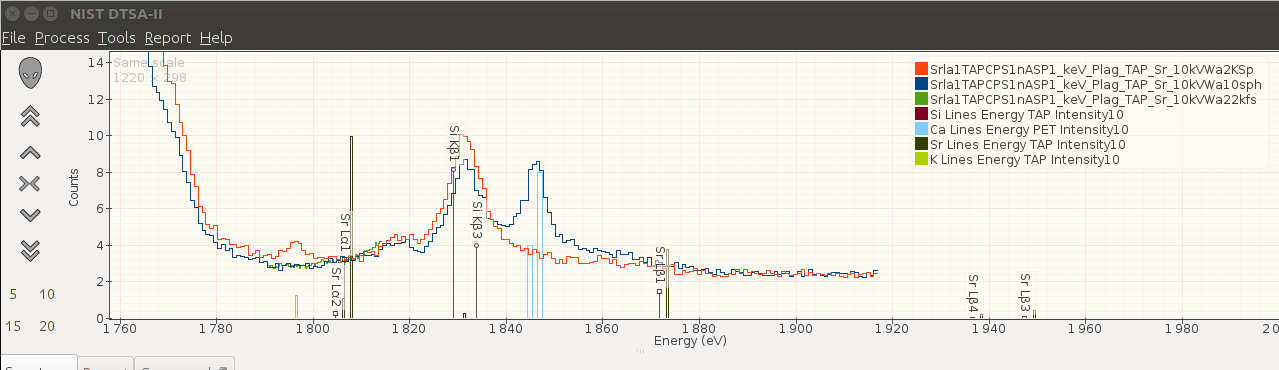
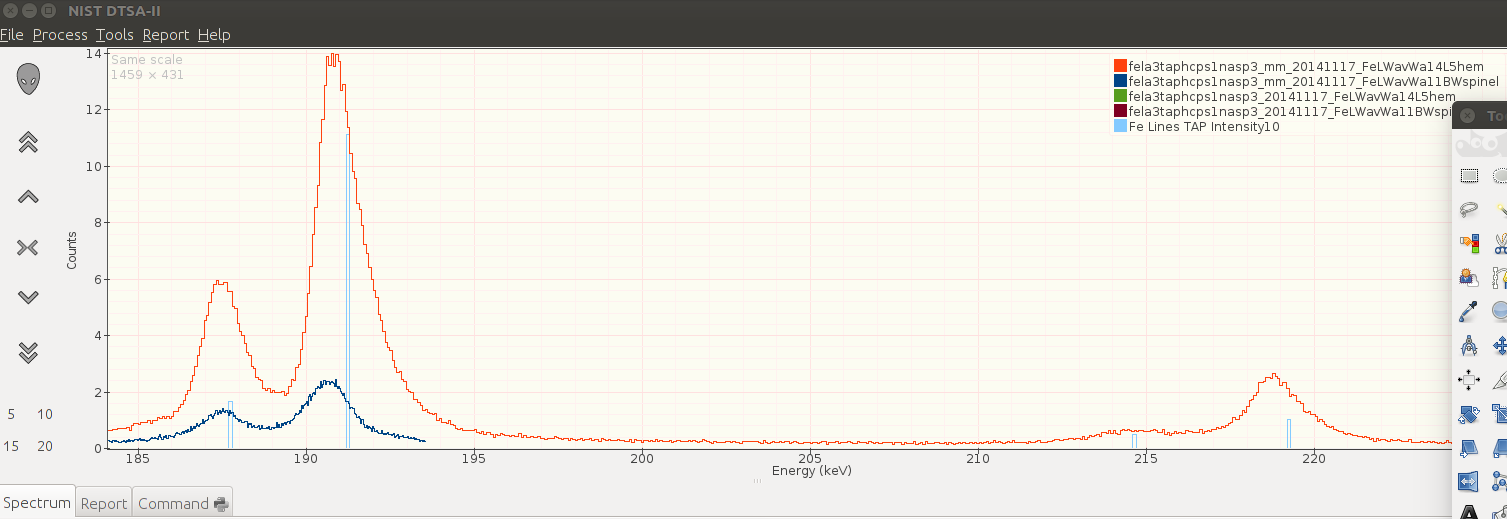
For both L value and energy I've written seperate scripts and emsa files to generate x-ray line marker spectra for the elements - the coloured columns on the graphs above. For energy the inbuilt KLM markers work but they don't include high order lines. Another quirk when viewing as energy which I didn't appreciate is that if spectra of different lengths/spacing are compared there will be a slight shift of a few eV. This is because emsa files are plot based on the step (channel) size. But when converting mm or wavelength into energy - 1 mm step does not equal a constant eV step. At the extreme's for TAP a 1mm step at 250mm = 2eV whilst at 77mm = 20eV.

For the scripts you have to set working directory (folder with MDB - and wavescans exported for each sample as dat files), location of header & footer files and location of lvalue.csv file

Ben

see attachment
« Last Edit: April 20, 2020, 08:10:46 AM by Ben Buse »

Probeman

  • Emeritus
  • *****
  • Posts: 2858
  • Never sleeps...
    • John Donovan
Re: Plotting PFE wavescans in DTSA II
« Reply #1 on: November 28, 2016, 01:44:06 PM »
Another quirk when viewing as energy which I didn't appreciate is that if spectra of different lengths/spacing are compared there will be a slight shift of a few eV. This is because emsa files are plot based on the step (channel) size. But when converting mm or wavelength into energy - 1 mm step does not equal a constant eV step. At the extreme's for TAP a 1mm step at 250mm = 2eV whilst at 77mm = 20eV.

Hi Ben,
Nice work!

I wonder if you could output the large 2d wavescans with extra points interpolated so they are the same size eV steps as compared to say LIF?
john
The only stupid question is the one not asked!

Ben Buse

  • Professor
  • ****
  • Posts: 499
Re: Plotting PFE wavescans in DTSA II
« Reply #2 on: November 29, 2016, 07:23:45 AM »
Hi John,

Yes I did think I could get a constant eV step by doing a line fit and then subdividing the line into constant eV steps.

Ben

Ben Buse

  • Professor
  • ****
  • Posts: 499
Re: Plotting PFE wavescans in DTSA II
« Reply #3 on: November 29, 2016, 08:05:13 AM »
Yes smooth spline and predict constant eV intervals fixes it

« Last Edit: April 13, 2020, 08:59:43 AM by John Donovan »

Ben Buse

  • Professor
  • ****
  • Posts: 499
Re: Plotting PFE wavescans in DTSA II
« Reply #4 on: November 29, 2016, 09:19:34 AM »
Best with less smoothing par=0 not par =0.35

Just modified to linear interpolation.

« Last Edit: December 06, 2016, 06:07:51 AM by Ben Buse »

Probeman

  • Emeritus
  • *****
  • Posts: 2858
  • Never sleeps...
    • John Donovan
Re: Plotting PFE wavescans in DTSA II
« Reply #5 on: November 30, 2016, 03:05:36 PM »
I've written a R script to plot PFE WDS wavescans in DTSAII for viewing, which maybe useful, or at least here are the pitfalls.

Hi Ben,
I should mention that if you're attempting to have a single database containing all your wavescans for selecting off-peak positions, you can also simply create an empty PFE MDB database and then just import all your wavescans into it using the Load Wavescan From Another Run button in the New Sample Setup dialog as seen here:


Then whenever you need a wavescan for picking your off-peak backgrounds, simply browse to that wavscan database and select the previously acquired wavescan(s) that you want to utilize...
john
« Last Edit: April 12, 2020, 10:04:52 PM by John Donovan »
The only stupid question is the one not asked!