Author Topic: Finding anomalous intensities in your run  (Read 2208 times)

Probeman

  • Emeritus
  • *****
  • Posts: 2856
  • Never sleeps...
    • John Donovan
Finding anomalous intensities in your run
« on: November 07, 2016, 01:28:30 PM »
I've previously mentioned the List Anomalous Intensity Data for Standards Or Unknowns menu here:

http://probesoftware.com/smf/index.php?topic=168.msg725#msg725

But I want to re-iterate the color scheme utilized for the output for of anomalous standard intensities:

Black color indicates an element channel that is *not* utilized for any calculations and has point intensity deviations  that are greater than 4 times the predicted variance of that channel.

Blue color indicates an element channel that is *not* utilized for any calculations and has point intensity deviations that are greater than 10 times the predicted variance of that channel.

Magenta color indicates an element channel that is utilized for standard calculations and has point intensities that are greater than 4 times the predicted variance of that channel.

Red color indicates an element channel that is utilized for standard calculations and has point intensities that are greater than 10 times the predicted variance of that channel.

For unknown samples the key is simpler:

Black color indicates an element channel that has point intensity deviations  that are greater than 4 times the predicted variance of that channel.

Blue color indicates an element channel that has point intensity deviations that are greater than 10 times the predicted variance of that channel.

Here is an example of the output for anomalous standard intensities:

« Last Edit: April 12, 2020, 07:24:27 PM by John Donovan »
The only stupid question is the one not asked!

John Donovan

  • Administrator
  • Emeritus
  • *****
  • Posts: 3304
  • Other duties as assigned...
    • Probe Software
Re: Finding anomalous intensities in your run
« Reply #1 on: February 06, 2020, 08:36:24 AM »
We decided to display the color coding key in the log window when listing anomalous intensities from the Run | List Anomalous Intensity Data for Standards and Unknowns menu as seen here:


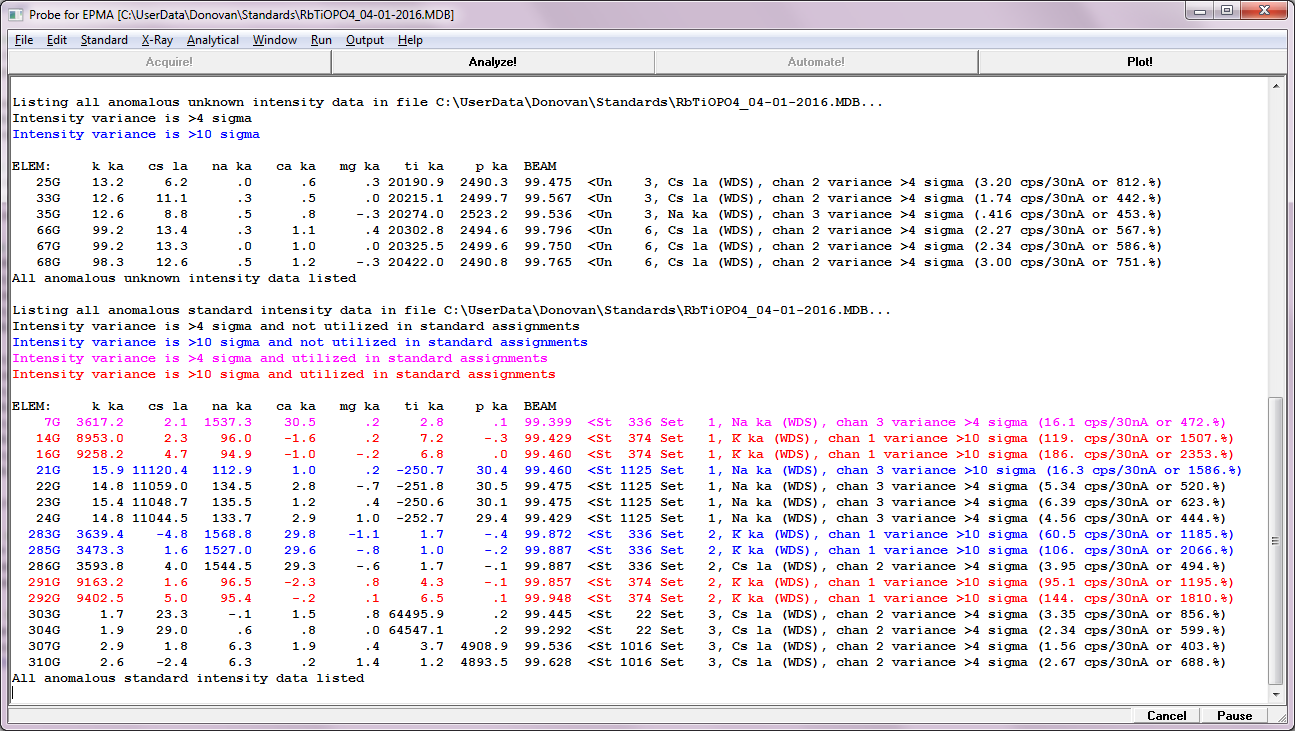
Note the unknown intensities listed at the top, and the standard intensities listed below. The idea is that when listing anomalous standard intensities, one would want to be alerted to anomalous intensities which are being utilized as ones primary standard (text in magenta or red).
John J. Donovan, Pres. 
(541) 343-3400

"Not Absolutely Certain, Yet Reliable"