Let me start by saying that high accuracy metrology on the microprobe isn't easy!
So I ran a number of tests on the imaging calibration and analysis position accuracy and my conclusion is that there is nothing wrong (that I can see) with either the beam scan calibration code, nor the analysis position plotting code. I will explain my testing methodology below where I utilized the Save To Database button in the Imaging window to save the images and then displayed the analysis positions on the acquired images in the Run | Display, Annotate and Export Analog Signal Image menu dialog, but I also tested several images in PictureSnap and everything looks exactly the same there.
First let's look at an image I acquired with the analysis positions displayed (you'll probably want to click on the embedded images to see them better):
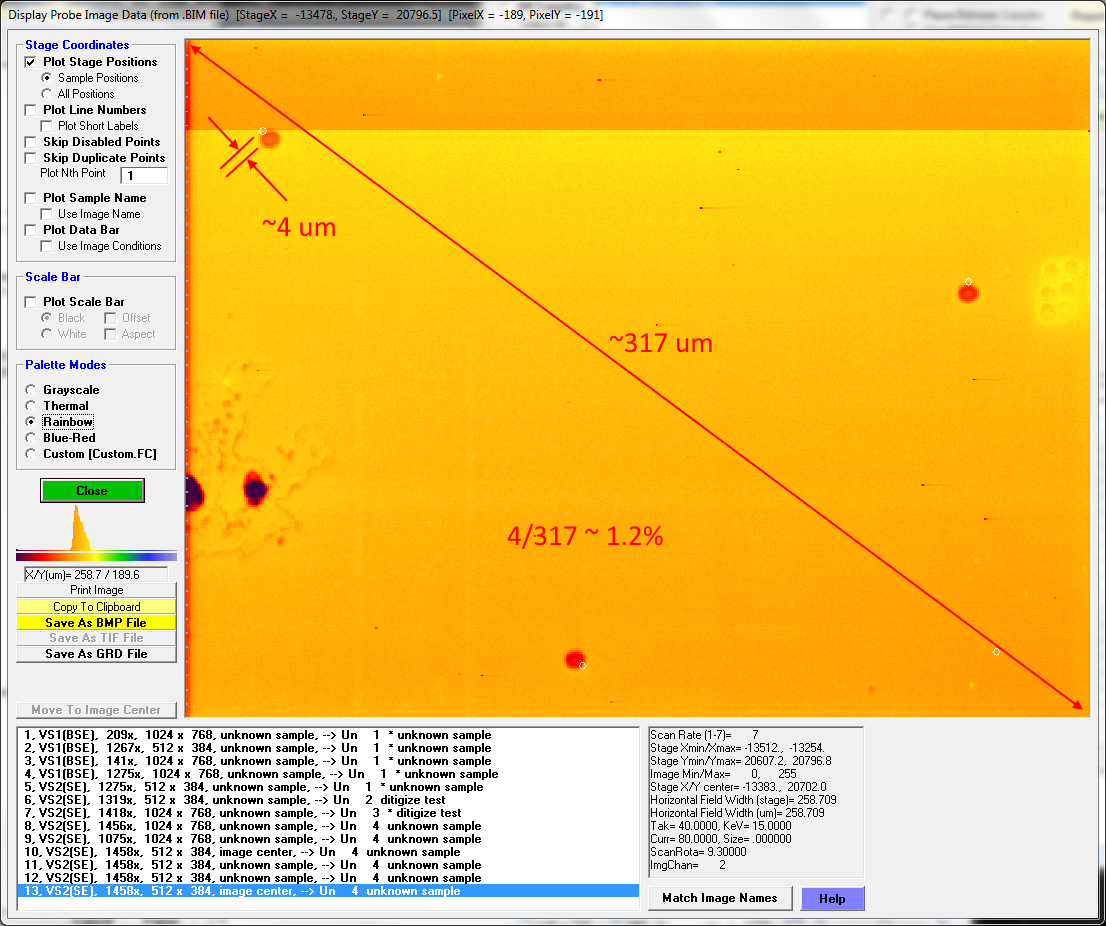
So there is some offset from the beam burn positions, but please note that this image was acquired using my default calibration from ~6 months ago, which could be suspect as we had a complete column rebuild since then, but a larger issue I soon discovered was that I only calibrated up to 1335x and the recent image calibration testing I did was at magnifications a little higher than that. So there is some extrapolation involved. (By the way, I've never had our engineer adjust the scanning coil electronics, and instead have always opted for a software calibration.)
But first let's calculate the relative accuracy of these displayed positions relative to the beam burn positions on the above image. Using the click and drag feature in the Display, Annotate and Export Analog Signal Image dialog, I found that the image diagonal length is ~317 um and for the upper left analysis point, the distance between the beam burn and the displayed circle is about 4 um, which is an error of about 1.2% relative, or about 2.4% relative based on just the radius. Since Cameca instruments have a specified accuracy of 3% relative for magnification, that doesn't seem all that awful, but perhaps we can do better.
But first let's look more closely at the same image and see if we can determine whether it's the displayed image or the displayed analysis positions that are in error. The coordinates of the analysis positions are listed here:
Stage (or Beam Deflection) Coordinate Positions:
X Y Z X Y Z
4G -13490.00 20771.00 69.00000 5G -13289.00 20729.00 69.00000
6G -13399.00 20622.00 69.00000 7G -13281.00 20626.00 69.00000
Starting with the first analysis position (point 4), we have a recorded stage coordinate of -13490 for x and 20771 for y. Here is the mouse cursor captured while sitting on the displayed analysis position for point 4:
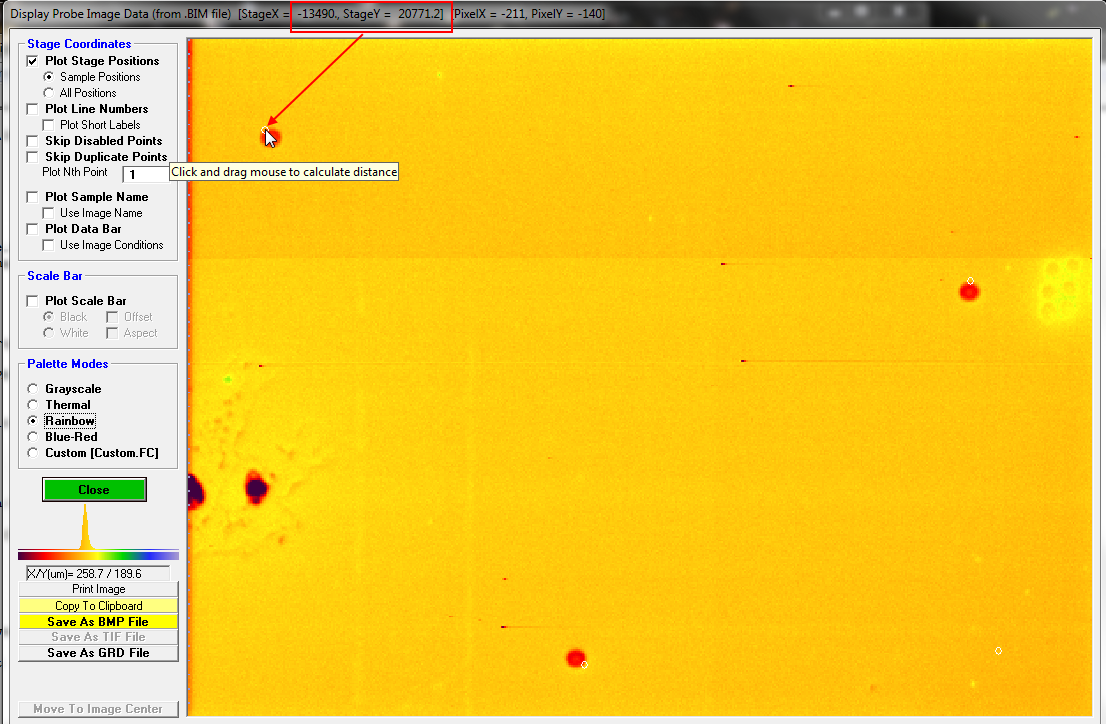
We can see that the displayed analysis position is exactly at the acquired stage coordinates, and in fact it is the image (and beam burn) that is off from the calibrated stage position! We can do the same for the other two positions and in all cases the displayed analysis position is *exactly* at the acquired stage position, while the beam burn (image) is off in calibration. Here is point 5 (-13289.00 20729.00):
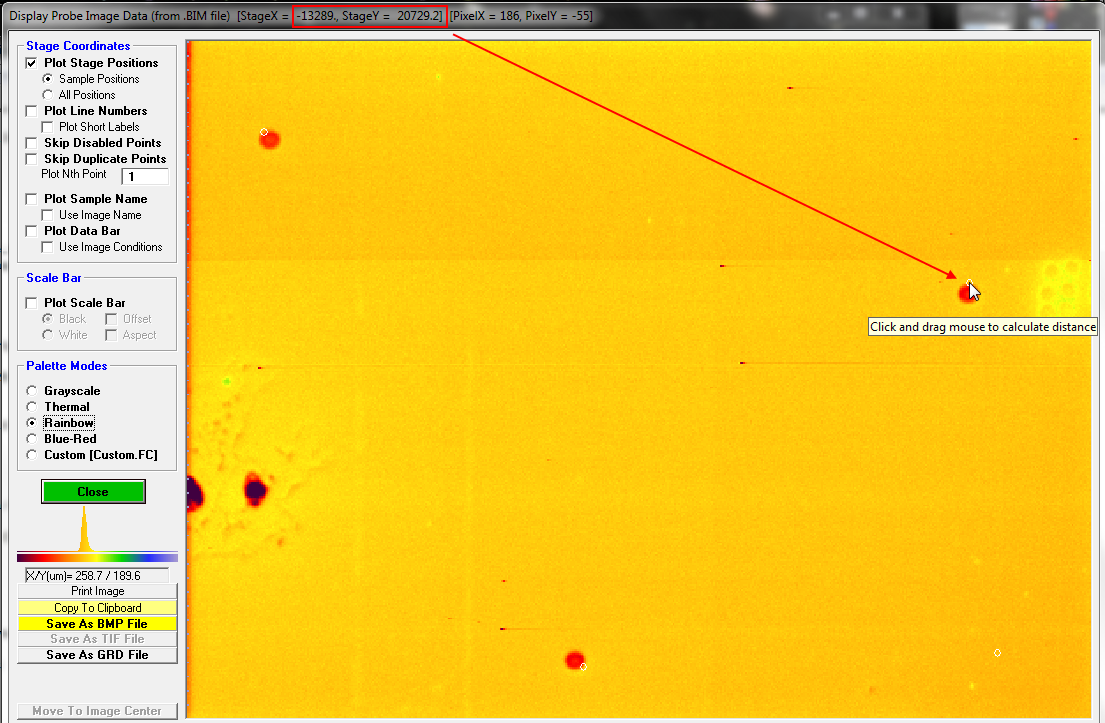
And here is point 6 (-13399.00 20622.00):
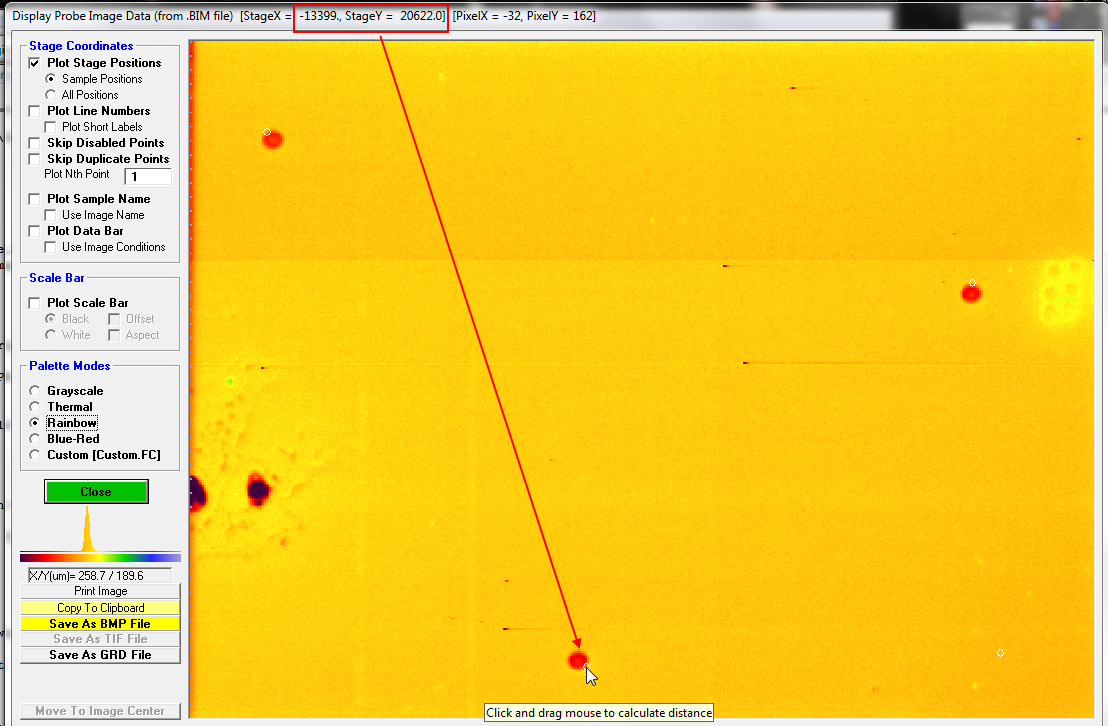
So, to me this means that the software is correctly displaying the stage positions, but the image itself is not exactly calibrated. In the next post I will continue the discussion of my testing, but please feel free to disagree with me...


 All Electron Probe Micro-Analysts are welcome to register and post!