As you all know if you acquire a single pixel line scan on a JEOL or Cameca instrument you get something like this:
JEOL stage scan: 1 by N pixels because the fast scan direction is up to down. The X axis is one pixel wide.
Cameca stage or beam scan and JEOL beam scan: N by 1 pixel because the fast scan dimension is left to right. The Y dimension is one pixel high.
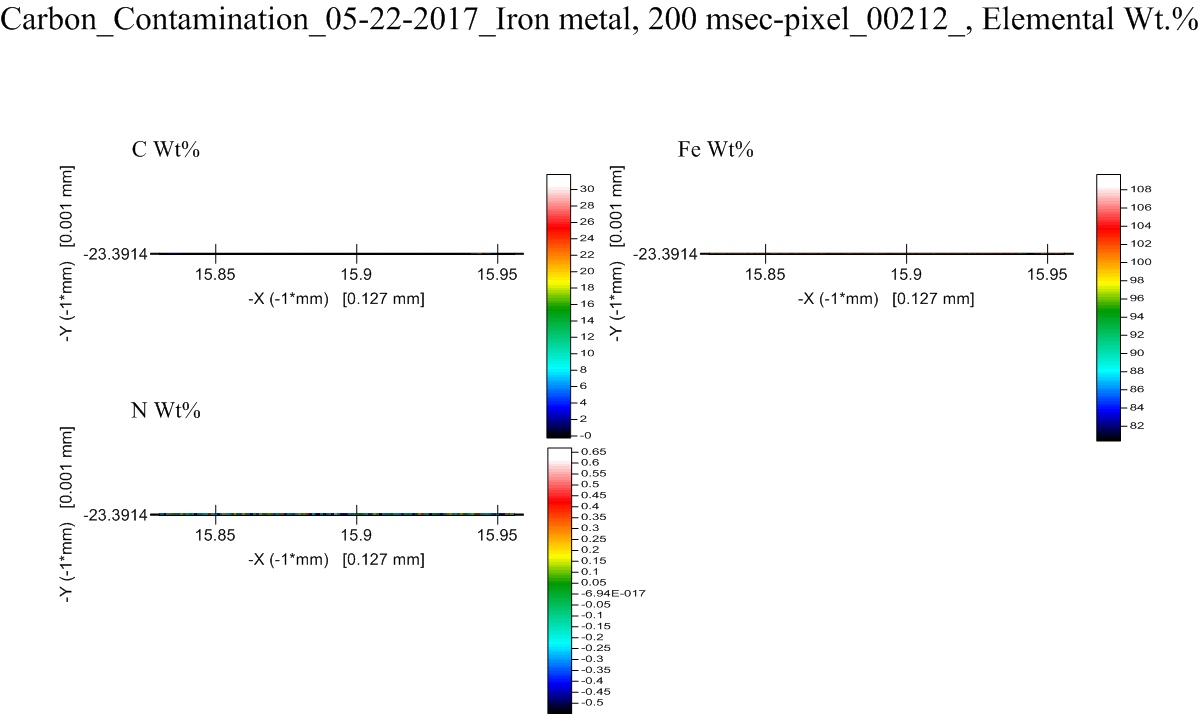
When you quantify such one pixel line scans in CalcImage you might get something like this:
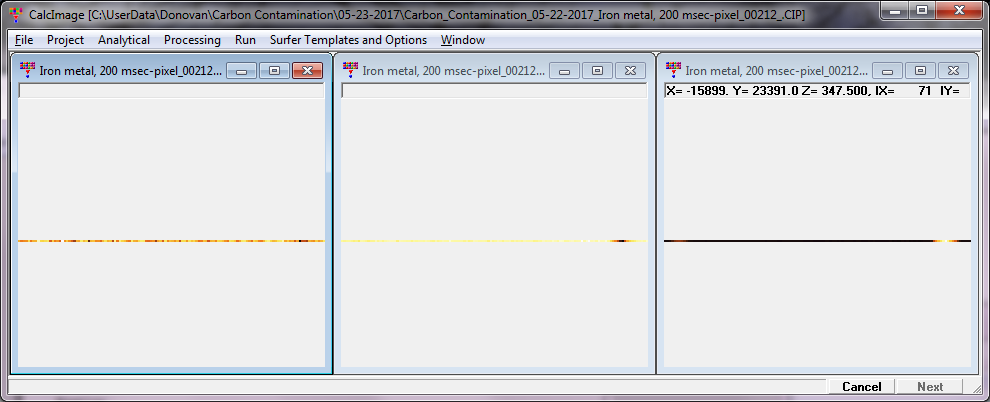
Yes, one can hover the mouse cursor over the image and read out the Z weight percent values, but it's not very satisfactory. And if you decide to output the images to Surfer for presentation output, you'll get this error in the Surfer Scripter app:
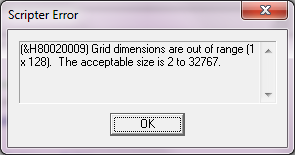
This is because Surfer map grids must have both axes between 2 and 32K pixels.
So I wrote some new code and attached it to the log window menu in CalcImage as seen here:
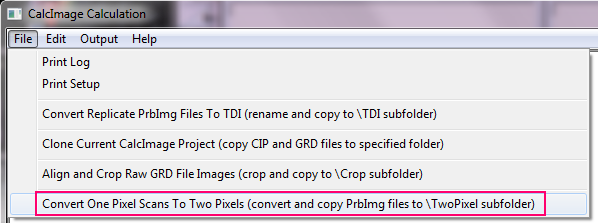
Using this new menu you simply select one PrbImg map file from Probe Image, for the selected acquisition and the software will automatically convert all maps from one pixel wide maps to 2 pixel wide maps. This is done by merely duplicating the single scan line of data, plus adjusting the slow scan axis to be non-zero by setting it to the beam diameter (if the beam size is fully focused (0 microns), the code will set it to one micron, though this can be adjusted).
All maps with the same base name will be converted to two pixels wide, even subsequent element passes (for more than 5 element map acquisitions).
After this is complete you can create a new project using the CalcImage New Project Wizard as usual, but when selecting the PrbImg files, just browse to the \TwoPixel sub folder and select one of the converted two pixel acquisition maps.
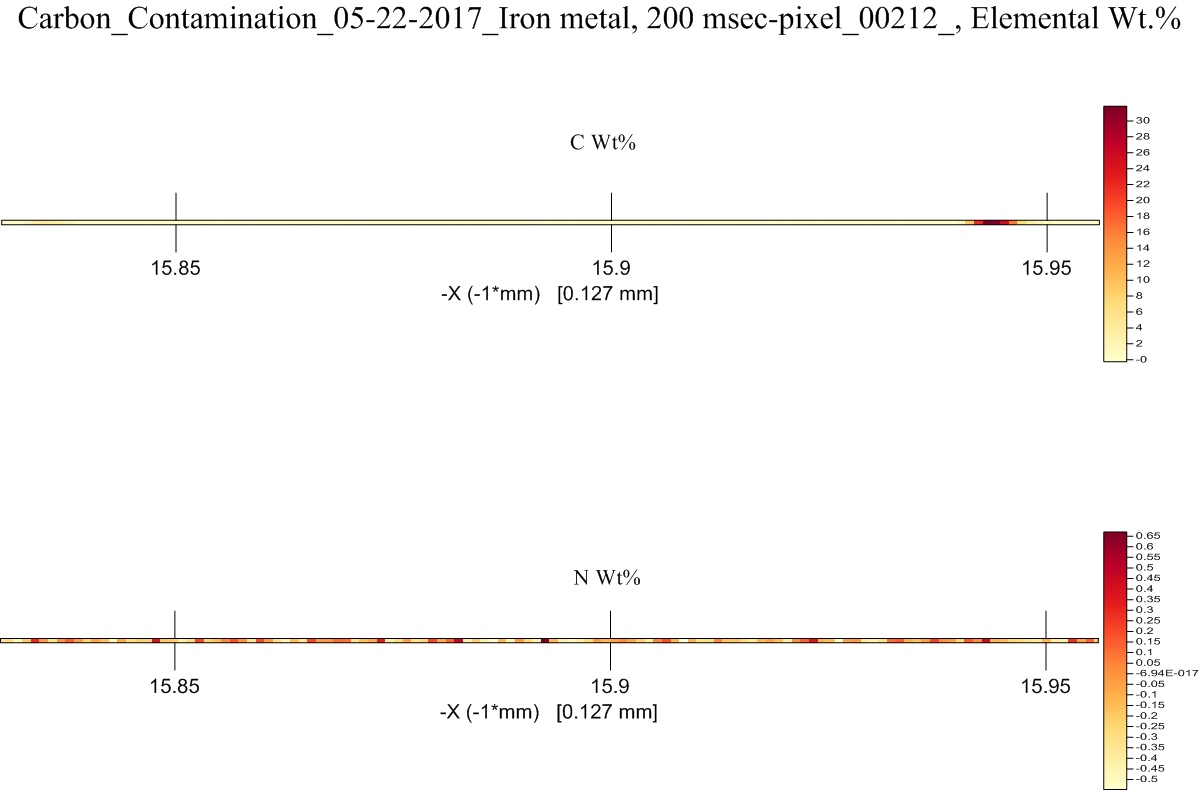
When you are done quantifying the maps you will see the map images in CalcImage looking like this:
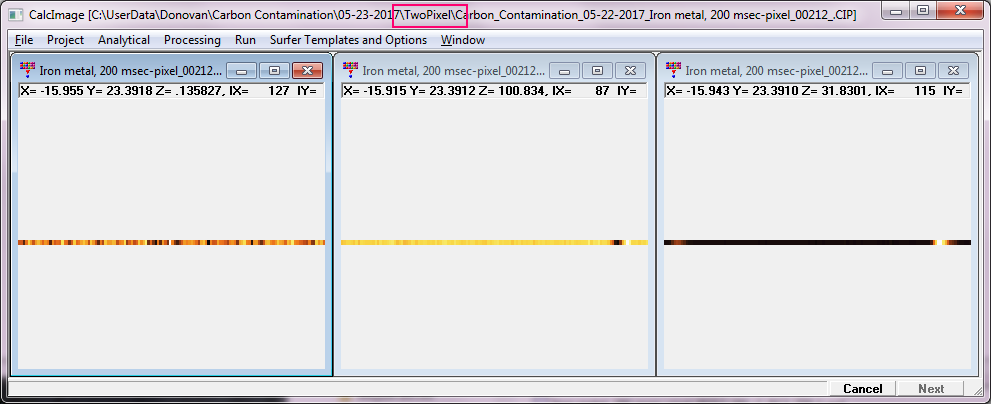
It looks slightly stretched in Y because there are actually two duplicate scan lines. And now you can send the data to Surfer for presentation output as you would for any normal XY map as seen here:
However, you will probably need to tweak the Surfer plot parameters a bit depending on the aspect ratio of the line scan. But after a little mousing around changing the text sizes and labels, you can end up with something like this:
So update PFE and give it a try and let me know what you all think...
john


 To post in-line images, login and click on the Gallery link at the top