Author Topic: Performing Integrated WDS and EDS Acquisition in PFE  (Read 24210 times)

Probeman

  • Emeritus
  • *****
  • Posts: 2833
  • Never sleeps...
    • John Donovan
Re: Performing Integrated WDS and EDS Acquisition in PFE
« Reply #15 on: October 22, 2018, 02:45:03 PM »
Once the JEOL API is all up and running will PfEPMA be able to integrate multiple EDS analyses from multiple spectrometers? For example, my new 8530F+ has both a JEOL EDS and a Thermo EDS. It would be interesting to see if integrating the spectra from both detectors is possible and useful.

Since you will have both a Thermo EDS detector and a JEOL EDS detector on your 8530 instrument, one thing you *will* be able to do is to use Probe for EPMA with the Thermo detector for combined WDS and EDS analyses, and then switch to the JEOL detector (again) for combined WDS and EDS analyses.  That is, once JEOL releases their final EDS API.

It will be interesting to directly compare the two detector systems and their peak stripping capabilities on the same instrument on the same samples. Sounds like a presentation in the making!   :)
The only stupid question is the one not asked!

Probeman

  • Emeritus
  • *****
  • Posts: 2833
  • Never sleeps...
    • John Donovan
Re: Performing Integrated WDS and EDS Acquisition in PFE
« Reply #16 on: October 29, 2018, 06:21:30 PM »
Today I was acquiring some integrated EDS and WDS point analyses and ran into the same problem that another user (Emma Bullock) reported to me a couple of weeks ago, where PFE was complaining that the EDS intensities were zero even though the Get EDS Net Intensities button in the Display EDS Spectra dialog worked fine.

When I looked at her data file I found that she had not checked the Use EDS Element Data checkbox in the Calculation Options dialog. So I let her know that and all was well.

Then today I proceeded to run into *exactly* the same issue because I also forgot to check that damn Use EDS EDS Element Data checkbox in the Calculation Option dialog.  So you know what this means?  It means I'm going to modify the code to automatically set that flag whenever someone adds an element by EDS for quant.   ::)
« Last Edit: October 30, 2018, 12:26:09 PM by Probeman »
The only stupid question is the one not asked!

Probeman

  • Emeritus
  • *****
  • Posts: 2833
  • Never sleeps...
    • John Donovan
Re: Performing Integrated WDS and EDS Acquisition in PFE
« Reply #17 on: November 13, 2018, 02:42:55 PM »
This post is primarily intended for the students in Julie's EPMA class, but there is an interesting twist at the end so even experts might be amused to read through.

The new EDS flags in PFE that are automatically enabled in Probe for EPMA when Bruker or Thermo EDS acquisitions are performed seem to be working great for the students.  Using EDS quant with WDS quant in PFE is quite easy now.

In fact we even discovered another helpful bit of code when the students were setting up a quant lab practical yesterday doing trace elements on WDS and major elements by EDS when we added our trace elements by WDS first, and then we added an element by EDS before we had even acquired an EDS spectrum.  The software then popped up a little message saying that we had forgotten to turn on the "acquire EDS spectra" checkbox, and telling us that it turned it on for us automatically!

Such a nice software!    :D

So here are the results of our integrated EDS-WDS lab practical measuring Rb and Ti in a synthetic quartz.  The idea being to measure Rb and Ti as trace elements using EDS and Si using WDS just to obtain a decent matrix correction.   Specifically: how accurately can we measure "zero" Rb when there is a significant interference of Si Ka on Rb La?  First lets look at the wavescan on Rb La:


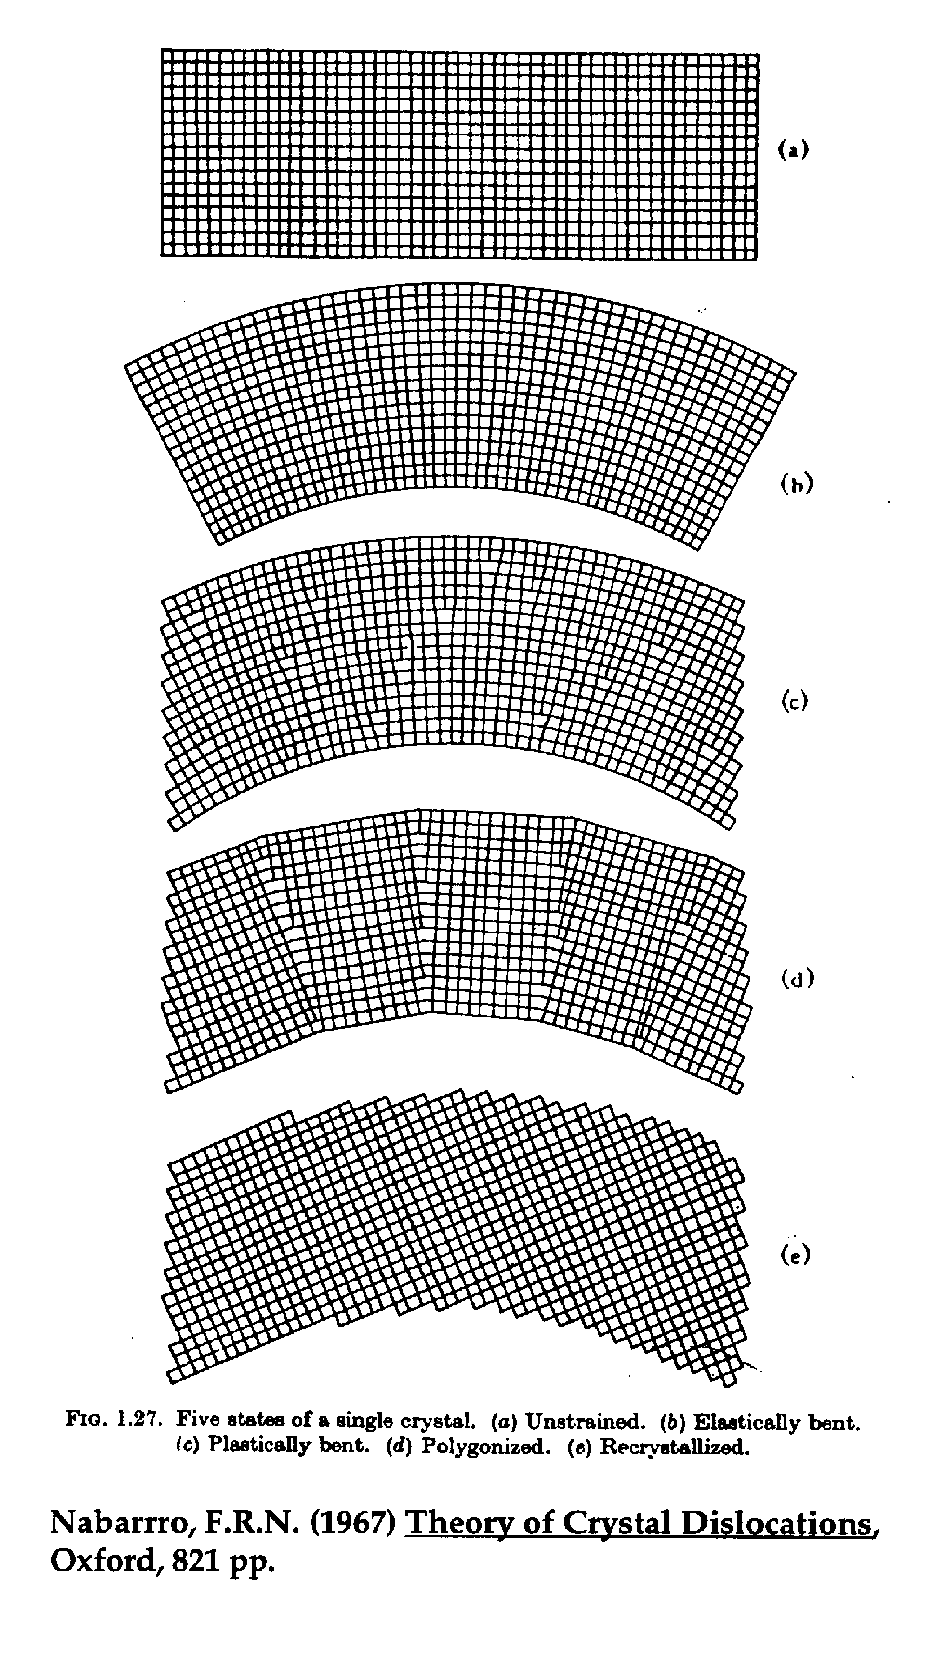
One can see that the tail of the Si Ka peak intrudes on the peak position of the Rb La line mostly due to "polygonization" of the Bragg crystals during manufacturing, which causes these extended tails (from Goldstein et al.) due to micro domain mis-orientation during the thermal cycling utilized to re-crystallize the plastically deformed Bragg crystal to improve reflectivity:


Meanwhile, here are the quant results *without* the interference correction running the SiO2 as an unknown (using standards SiO2 for Si by EDS, and RbTiOPO4 for Rb, and TiO2 for Ti using WDS):

Un    4 SiO2 as unk, Results in Elemental Weight Percents
 
ELEM:       Rb      Ti      Si
TYPE:     ANAL    ANAL    ANAL
BGDS:      LIN     EXP     EDS
TIME:    80.00   80.00   70.00
BEAM:    49.71   49.71   49.71

ELEM:       Rb      Ti      Si   SUM 
   118    .148    .001  40.921  41.071
   119    .156   -.002  40.989  41.143
   120    .156   -.003  40.977  41.130
   121    .149   -.002  40.995  41.143
   122    .145    .000  40.973  41.118

AVER:     .151   -.001  40.971  41.121
SDEV:     .005    .002    .029    .030
SERR:     .002    .001    .013
%RSD:     3.22 -143.58     .07
STDS:     1023      22      14

First of all we note that besides the interference on Rb by Si of around 1500 PPM, the totals are quite low, because although we added Si by EDS, we forgot to add oxygen by EDS. And because it's an unknown sample, the software does not know that oxygen is present. So we could either turn on oxygen by stoichiometry as seen here:

Un    4 SiO2 as unk, Results in Elemental Weight Percents
 
ELEM:       Rb      Ti      Si       O
TYPE:     ANAL    ANAL    ANAL    CALC
BGDS:      LIN     EXP     EDS
TIME:    80.00   80.00   70.00     ---
BEAM:    49.71   49.71   49.71     ---

ELEM:       Rb      Ti      Si       O   SUM 
   118    .171    .001  46.634  53.149  99.954
   119    .180   -.002  46.711  53.236 100.125
   120    .179   -.003  46.698  53.220 100.095
   121    .172   -.002  46.718  53.244 100.133
   122    .167    .000  46.692  53.215 100.075

AVER:     .174   -.001  46.691  53.213 100.076
SDEV:     .006    .002    .034    .038    .072
SERR:     .003    .001    .015    .017
%RSD:     3.22 -143.58     .07     .07
STDS:     1023      22      14     ---

Or, we could leave it as elemental and just add oxygen by EDS using the SiO2 standard as the oxygen standard, since we acquired an EDS spectra automatically on each standard like this:

Un    4 SiO2 as unk, Results in Elemental Weight Percents
 
ELEM:       Rb      Ti      Si       O
TYPE:     ANAL    ANAL    ANAL    ANAL
BGDS:      LIN     EXP     EDS     EDS
TIME:    80.00   80.00   70.00   70.00
BEAM:    49.71   49.71   49.71   49.71

ELEM:       Rb      Ti      Si       O   SUM 
   118    .171    .001  46.656  53.679 100.507
   119    .180   -.002  46.745  54.002 100.925
   120    .180   -.003  46.738  54.104 101.018
   121    .172   -.002  46.756  54.080 101.006
   122    .167    .000  46.732  54.092 100.992

AVER:     .174   -.001  46.725  53.991 100.890
SDEV:     .006    .002    .040    .179    .217
SERR:     .003    .001    .018    .080
%RSD:     3.22 -143.58     .09     .33
STDS:     1023      22      14      14

Either way we get a decent total and more importantly as I will show below, a better matrix correction (and why would a matrix correction matter for a minor element you might ask? See below).

Now it should also be pointed out that the net intensities for Si and O by EDS were obtained from the default Thermo software profile without any special processing for background fitting or peak stripping so this is quite good actually for oxygen. Now let's turn on the interference for Rb La by Si as seen here:


Un    4 SiO2 as unk, Results in Elemental Weight Percents
 
ELEM:       Rb      Ti      Si       O
TYPE:     ANAL    ANAL    ANAL    ANAL
BGDS:      LIN     EXP     EDS     EDS
TIME:    80.00   80.00   70.00   70.00
BEAM:    49.71   49.71   49.71   49.71

ELEM:       Rb      Ti      Si       O   SUM 
   118    .002    .001  46.665  53.588 100.256
   119    .012   -.002  46.754  53.911 100.674
   120    .012   -.003  46.746  54.013 100.768
   121    .005   -.002  46.765  53.989 100.758
   122    .002    .000  46.741  54.002 100.744

AVER:     .007   -.001  46.734  53.901 100.640
SDEV:     .005    .002    .040    .179    .218
SERR:     .002    .001    .018    .080
%RSD:    77.68 -143.58     .09     .33
STDS:     1023      22      14      14

Now that looks better!  70 PPM +/- 50 PPM (one sigma) with only 80 seconds of counting time (15 keV, 50 nA), so essentially zero.  Here's another analysis of the synthetic SiO2 as an unknown, where we obtained 40 PPM +/- 30 PPM, again essentially zero:

Un    5 SiO2 as unk, Results in Elemental Weight Percents
 
ELEM:       Rb      Ti      Si       O
TYPE:     ANAL    ANAL    ANAL    ANAL
BGDS:      LIN     EXP     EDS     EDS
TIME:    80.00   80.00   70.00   70.00
BEAM:    50.46   50.46   50.46   50.46

ELEM:       Rb      Ti      Si       O   SUM 
   153    .004   -.001  47.988  55.251 103.242
   154    .003    .003  46.401  53.169  99.575
   155    .000   -.003  46.745  53.566 100.309
   157    .008    .002  47.002  54.375 101.388

AVER:     .004    .001  47.034  54.090 101.128
SDEV:     .003    .003    .682    .922   1.594
SERR:     .002    .001    .341    .461
%RSD:    88.93  458.16    1.45    1.71
STDS:     1023      22      14      14

STKF:    .3028   .5547   .4101   .2664
STCT:   5506.7 32081.8 48240.1 16388.5

UNKF:    .0000   .0000   .4125   .2712
UNCT:       .5      .3 48522.6 16683.3
UNBG:     41.0    45.9      .0      .0

ZCOR:   1.1959  1.2024  1.1402  1.9948
KRAW:    .0001   .0000  1.0059  1.0180
PKBG:     1.01    1.01     .00     .00
INT%:   -97.89    ----    ----    ----

Now here's the interesting thing about the matrix correction in this analysis. Let's go back to the Un 4 SiO2 as unk sample and this time I'll turn off the oxygen by EDS and so we obtain this result for the Rb:

Un    4 SiO2 as unk, Results in Elemental Weight Percents
 
ELEM:       Rb      Ti      Si       O
TYPE:     ANAL    ANAL    ANAL    ANAL
BGDS:      LIN     EXP     EDS     EDS
TIME:    80.00   80.00   70.00     ---
BEAM:    49.71   49.71   49.71     ---

ELEM:       Rb      Ti      Si     O-D   SUM 
   118    .000    .001  40.929     ---  40.931
   119    .009   -.002  40.997     ---  41.004
   120    .009   -.003  40.985     ---  40.991
   121    .003   -.002  41.003     ---  41.005
   122    .000    .000  40.980     ---  40.980

AVER:     .004   -.001  40.979     ---  40.982
SDEV:     .004    .002    .029     ---    .031
SERR:     .002    .001    .013     ---
%RSD:   105.09 -143.58     .07     ---
STDS:     1023      22      14     ---

STKF:    .3028   .5547   .4101     ---
STCT:   5490.5 32240.2 48315.1     ---

UNKF:    .0000   .0000   .4098     ---
UNCT:       .7     -.6 48279.9     ---
UNBG:     40.5    46.1      .0     ---

ZCOR:   1.0380  1.1985  1.0000     ---
KRAW:    .0001   .0000   .9993     ---
PKBG:     1.02     .99     .00     ---
INT%:   -97.25    ----    ----     ---

Notice that we obtain 40 PPM of Rb without oxygen in the matrix and also notice that the matrix correction for Rb La in this matrix is calculated as 1.038. Now we turn oxygen by EDS back on and we obtain this result:

Un    4 SiO2 as unk, Results in Elemental Weight Percents
 
ELEM:       Rb      Ti      Si       O
TYPE:     ANAL    ANAL    ANAL    ANAL
BGDS:      LIN     EXP     EDS     EDS
TIME:    80.00   80.00   70.00   70.00
BEAM:    49.71   49.71   49.71   49.71

ELEM:       Rb      Ti      Si       O   SUM 
   118    .002    .001  46.665  53.588 100.256
   119    .012   -.002  46.754  53.911 100.674
   120    .012   -.003  46.746  54.013 100.768
   121    .005   -.002  46.765  53.989 100.758
   122    .002    .000  46.741  54.002 100.744

AVER:     .007   -.001  46.734  53.901 100.640
SDEV:     .005    .002    .040    .179    .218
SERR:     .002    .001    .018    .080
%RSD:    77.68 -143.58     .09     .33
STDS:     1023      22      14      14

STKF:    .3028   .5547   .4101   .2664
STCT:   5490.5 32240.2 48315.1 16364.3

UNKF:    .0001   .0000   .4098   .2704
UNCT:      1.0     -.6 48279.9 16614.5
UNBG:     40.5    46.1      .0      .0

ZCOR:   1.1961  1.2024  1.1404  1.9931
KRAW:    .0002   .0000   .9993  1.0153
PKBG:     1.02     .99     .00     .00
INT%:   -96.25    ----    ----    ----

Now we obtain 70 PPM of Rb!  Just by adding oxygen into the matrix correction we raised the Rb content (a trace element since it's probably close to zero in the synthetic SiO2), from 40 PPM to 70 PPM! 

Then we were able to have the students think on this and observe that the Rb La line cannot fluoresce the Si Ka edge since the Rb La = 1.694 keV and Si K edge = 1.84 keV.  But Rb La *can* fluoresce the O K edge, so Rb La is significantly more absorbed by oxygen than Si and the matrix correction goes from 1.038 to to 1.1961! 
« Last Edit: November 13, 2021, 07:19:33 PM by John Donovan »
The only stupid question is the one not asked!

Probeman

  • Emeritus
  • *****
  • Posts: 2833
  • Never sleeps...
    • John Donovan
Re: Performing Integrated WDS and EDS Acquisition in PFE
« Reply #18 on: November 13, 2018, 03:10:01 PM »
Now just to prolong the agony of the above quite tedious trace element analysis posting, I thought I would mention something else.  Even though the Rb concentrations we obtained after the interference correction are just over one standard deviation from zero, I thought to myself, we should have performed a blank correction!

But I had figured we could only assume that the SiO2 had zero Rb since I thought that we didn't have a value for Rb in this synthetic SiO2, but then I remembered that we had an ICP-MS measurement from Alan Konig for this standard material from about 8 years ago, and when I found the Excel file, it says 11 PPM of Rb!

So since we have two samples of the SiO2 run as an unknown and therefore applicable as a blank measurement, I assigned the first SiO2 unk as a blank for the second SiO2 unknown and obtained the following result:

Un    5 SiO2 as unk, Results in Elemental Weight Percents
 
ELEM:       Rb      Ti      Si       O
TYPE:     ANAL    ANAL    ANAL    ANAL
BGDS:      LIN     EXP     EDS     EDS
TIME:    80.00   80.00   70.00   70.00
BEAM:    50.46   50.46   50.46   50.46

ELEM:       Rb      Ti      Si       O   SUM 
   153   -.002   -.001  47.989  55.248 103.234
   154   -.003    .003  46.401  53.166  99.566
   155   -.005   -.003  46.745  53.563 100.301
   157    .002    .002  47.003  54.372 101.379

AVER:    -.002    .001  47.034  54.087 101.120
SDEV:     .003    .003    .682    .922   1.594
SERR:     .002    .001    .341    .461
%RSD:  -162.27  458.16    1.45    1.71
STDS:     1023      22      14      14

So negative 20 PPM average with a 30 PPM one sigma variance.  Now that is again statistically still a zero, but I thought it worth mentioning.  For more on the blank correction for WDS spectrometer artifacts, see this paper:

https://epmalab.uoregon.edu/pdfs/3631Donovan.pdf

and this paper:

https://epmalab.uoregon.edu/publ/A%20new%20EPMA%20method%20for%20fast%20trace%20element%20analysis%20in%20simple%20matrices.pdf

Anyway, the whole point of this exercise was to demonstrate to the students that if we are primarily interested in trace elements, we can dedicate our WDS spectrometers to the trace elements of interest, and just utilize the EDS quant for a matrix correction.  The accuracy of major elements by EDS may not always be as good as using WDS, but they are probably more than good enough for the purposes of obtaining a matrix correction for the trace elements.
« Last Edit: November 13, 2018, 03:14:56 PM by Probeman »
The only stupid question is the one not asked!

John Donovan

  • Administrator
  • Emeritus
  • *****
  • Posts: 3270
  • Other duties as assigned...
    • Probe Software
Re: Performing Integrated WDS and EDS Acquisition in PFE
« Reply #19 on: March 10, 2020, 01:13:15 PM »
I think it's worth mentioning whenever discussing trace elements, that statistics are your friend.   :D

We routinely utilize detection limit statistics when evaluating trace WDS elements, but what about "trace" EDS elements? Well of course statistics are also our friend, but there is a rub.  Not only are trace element statistics generally significantly worse than WDS, but not all vendors can provide background intensities, which are normally the basis for detection limits statistics (of course other methods can be applied to obtain a reproducibility measure of detection).

So currently, Bruker and JEOL both provide background intensities from their "net intensity" EDS API interfaces to allow us to calculate detection statistics just as we do for WDS elements (but not Thermo). In Probe for EPMA, we can turn on detection limit statistics for all elements (WDS and EDS) as seen here:


Here is an example from a Bruker EDS detector (data provided by Karsten Goeman on his SX100) showing the resulting output in his log window:


and of course this data can be exported using the "user specified" output from the Output menu or by right clicking selected samples from the Analyze! window as seen here also saved to an Excel spreadsheet:


Now, if one is looking closely one will notice that a few of the elements (K, Mn, and Ti) are reported as zero statistics and also zero concentrations. This is for a very good reason and is because the returned net intensities for these elements, in these particular cases, were zero. And one cannot calculate statistics on zeros!

Now it may be that these zero net intensities could be avoided by choosing a different background (and peak fitting) fitting method in their EDS software, and I encourage everyone to learn how to optimize the processing of their spectra in their EDS software for optimum results.
John J. Donovan, Pres. 
(541) 343-3400

"Not Absolutely Certain, Yet Reliable"

glennpoirier

  • Professor
  • ****
  • Posts: 54
Re: Performing Integrated WDS and EDS Acquisition in PFE
« Reply #20 on: August 04, 2020, 12:16:37 PM »
Hi All,
Just wanted to show some data collected with the final  JEOL API and PFE software for using the JEOL EDS system on 8230 and 8530 machines.
The beta software has been able to talk to the JEOL EDS for a year or so now but there were various issues (the biggest problems were related to the locking of the interface after the analysis was done and  putting the beam into scanning mode during the analyses) that needed to be worked out in the JEOL API.
The latest version  works well and I haven't seen any issues.
A picture is worth a thousand words, so here it is:


Everything worked as expected and reanalysis of standards as unknowns produced good results. (Just have to remember to check "Use EDS Spectra for Quant" box in the calculations Options menu. I see from other post in the forum that I'm not the only one who forgets to do this!).

As a test I re-analysed some anorthoclase  and acquired Si, Al, Fe, Mg and Ca with EDS and the rest using MAN correction.  EDS acquisition  was 40s livetime,  using  TI pulse processor and the largest detector aperture (#1).


The EDS acquired elements are in yellow. As you can see the results are very close (I didn't analyse the exact same spots so the differences are probably real).
Note how close the Ca and Fe results are despite only being in the thousands of PPM range.

Great to be able to do combined WDS/EDS finally! It'll be interesting to see how this affects workflow.

Cheers

Glenn

Karsten Goemann

  • Global Moderator
  • Professor
  • *****
  • Posts: 227
Re: Performing Integrated WDS and EDS Acquisition in PFE
« Reply #21 on: August 04, 2020, 06:21:00 PM »
Hi Glenn, that's awesome. Great news for many people.
Cheers, Karsten

bgarcia

  • Professor
  • ****
  • Posts: 43
Re: Performing Integrated WDS and EDS Acquisition in PFE
« Reply #22 on: January 06, 2021, 01:39:38 PM »
I was hoping that others with JEOL 8530s could help me. My eds/wds integration is working except for one issue: PfEPMA isn't retaining any spectral data.

Everything else works. I can change the aperture, start an acquisition.. all that. When I ask PfEPMA to use EDS to quantify an element it says there's no spectrum collected, yet during acquisition the EDS window pops up and I can watch the detector view all the x-rays in real time.

My JEOL engineer suggests that this might have something to do with permissions between different versions of Windows, so that JEOL may indeed be collecting a spectrum, but it's putting it somewhere where PfEPMA cant see it or doesn't have permission to read it. The probe is running WinXP and PfEPMA is running on Win7 64x.

So, am I on the right trail? Or is there a check box in PfEPMA I'm missing?

John Donovan

  • Administrator
  • Emeritus
  • *****
  • Posts: 3270
  • Other duties as assigned...
    • Probe Software
Re: Performing Integrated WDS and EDS Acquisition in PFE
« Reply #23 on: January 06, 2021, 02:20:40 PM »
Hi Ben,
Are you getting an error in PFE during the acquisition?  If you go to the Run | Display and Export EDS Spectra menu, do you see any EDS spectra there?
« Last Edit: January 06, 2021, 02:31:03 PM by John Donovan »
John J. Donovan, Pres. 
(541) 343-3400

"Not Absolutely Certain, Yet Reliable"

bgarcia

  • Professor
  • ****
  • Posts: 43
Re: Performing Integrated WDS and EDS Acquisition in PFE
« Reply #24 on: January 06, 2021, 02:33:25 PM »
Yes. And when I use the "Display Net Intensities" button, I get a message that says "No EDS elements specified for analysis in Sample 67 Set 2 Ge".

John Donovan

  • Administrator
  • Emeritus
  • *****
  • Posts: 3270
  • Other duties as assigned...
    • Probe Software
Re: Performing Integrated WDS and EDS Acquisition in PFE
« Reply #25 on: January 06, 2021, 02:38:50 PM »
Yes, what? Yes, you are getting an error in PFE or yes you can see spectra in the Run menu?
« Last Edit: January 06, 2021, 02:44:53 PM by John Donovan »
John J. Donovan, Pres. 
(541) 343-3400

"Not Absolutely Certain, Yet Reliable"

bgarcia

  • Professor
  • ****
  • Posts: 43
Re: Performing Integrated WDS and EDS Acquisition in PFE
« Reply #26 on: January 06, 2021, 02:42:51 PM »
Sorry! Yes, I'm able to see spectra for each of the standards and unknowns I've acquired. When I quantify, though, there are no raw counts (even with the "Use EDS for quant" box checked).


John Donovan

  • Administrator
  • Emeritus
  • *****
  • Posts: 3270
  • Other duties as assigned...
    • Probe Software
Re: Performing Integrated WDS and EDS Acquisition in PFE
« Reply #27 on: January 06, 2021, 02:45:20 PM »
So it is acquiring EDS spectra and saving it to PFE OK.

Are you entering EDS elements in the Elements/Cations dialog?
« Last Edit: January 06, 2021, 02:58:15 PM by John Donovan »
John J. Donovan, Pres. 
(541) 343-3400

"Not Absolutely Certain, Yet Reliable"

bgarcia

  • Professor
  • ****
  • Posts: 43
Re: Performing Integrated WDS and EDS Acquisition in PFE
« Reply #28 on: January 06, 2021, 03:05:53 PM »
I've entered elements once each in the E/C dialog.

John Donovan

  • Administrator
  • Emeritus
  • *****
  • Posts: 3270
  • Other duties as assigned...
    • Probe Software
Re: Performing Integrated WDS and EDS Acquisition in PFE
« Reply #29 on: January 06, 2021, 03:11:59 PM »
Did you select the EDS (vs. WDS) option?   Does it list the EDS elements in the Elements/Cations dialog?

Maybe we should discuss this off-line. Please send me the MDB file and call me at Probe Software.
John J. Donovan, Pres. 
(541) 343-3400

"Not Absolutely Certain, Yet Reliable"