A colleague of ours contacted us recently about a problem they were having performing EDS analyses in PFE. That is, acquiring only EDS spectra and no WDS elements. They had this method working great for them when they had been using Thermo NSS, but they recently upgraded to the new Thermo Pathfinder software, and now they are just seeing zero intensities when displaying the raw data (by double-clicking on the sample) as seen here:
EDS Spectrum Parameters (for datarow=1):
Time Constant= 0, Sample Time= 60.0
Elapsed Time= 75.3, Dead Time(%)= 20.4
Live Time= 60.0, Channels= 2048
Ev Per Chan= 10, Max Counts= 69277
On-Peak (off-peak corrected) or EDS (bgd corrected) or MAN On-Peak X-ray Counts (cps/1nA) (and Faraday/Absorbed Currents):
ELEM: Al ka Si ka Ca ka Mg ka Fe ka BEAM1 BEAM2
BGD: EDS EDS EDS EDS EDS
SPEC: 0 0 0 0 0
CRYST: EDS EDS EDS EDS EDS
ORDER: 1 1 1 1 1
5G .00 .00 .00 .00 .00 19.970 19.970
AVER: .00 .00 .00 .00 .00 19.970 19.970
SDEV: .00 .00 .00 .00 .00 .000 .000
1SIG: .00 .00 .00 .00 .00
SIGR: .00 .00 .00 .00 .00
SERR: .00 .00 .00 .00 .00
%RSD: .00 .00 .00 .00 .00
This made us wonder if there was an issue with the new Thermo Pathfinder software, but as it turns out, it was working fine. I should mention that the new Thermo Pathfinder software is really awesome, but you want to be at v. 1.3.22 or higher.
If our colleague had been acquiring both EDS and WDS elements, the actual problem would have been more obvious as you will see. The other clue was that we could see the net intensities properly displayed in the EDS spectra display dialog in Probe for EPMA (from the Run menu) as seen here:
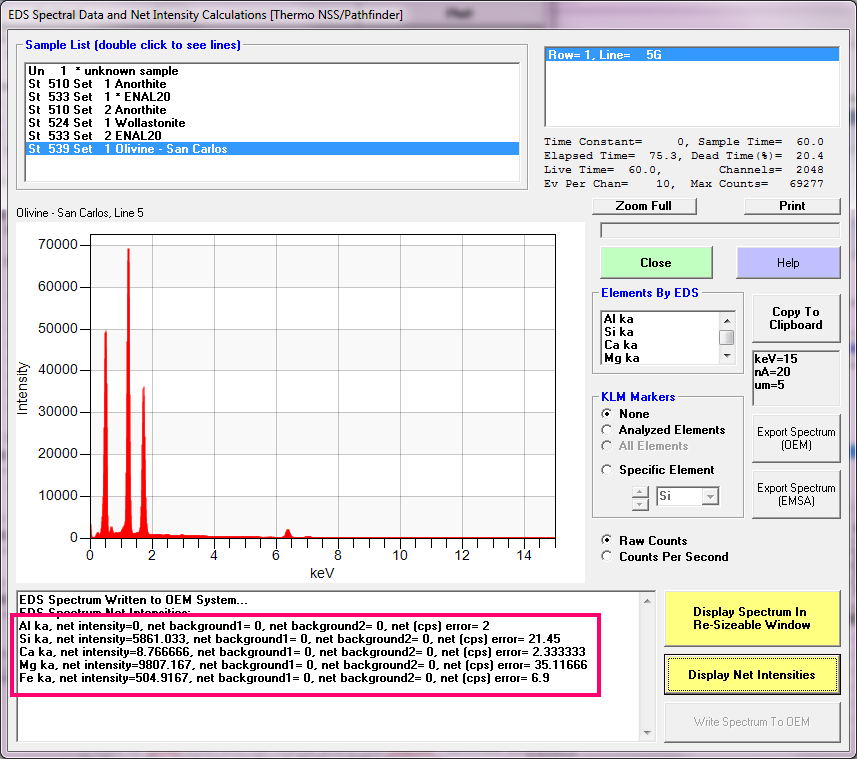
and *also* in the Thermo Pathfinder software. But when we clicked the Analyze button in the Analyze! window it displayed this message:
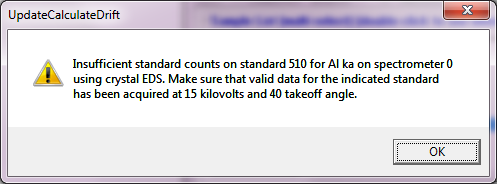
Huh, I thought. That's weird. Then scrolling up the log window output a bit we discovered this message:
EDS Acquisition (user specified) Time: 60.00
Number of Data Lines: 1 Number of 'Good' Data Lines: 1
First/Last Date-Time: 10/19/2018 02:45:13 PM to 10/19/2018 02:45:13 PM
WARNING- EDS Spectrum Data Analysis is disabled
Wait, what? What is this "WARNING- EDS Spectrum Data Analysis is disabled" message?
It turns out that Probe for EPMA is very flexible, one can acquire EDS spectra with WDS elements, or just WDS elements, or just EDS spectra elements, but if you want to include them in your quant calculations, one needs to "turn them on" using the Calculation Options dialog from the Analyze! window as seen here:
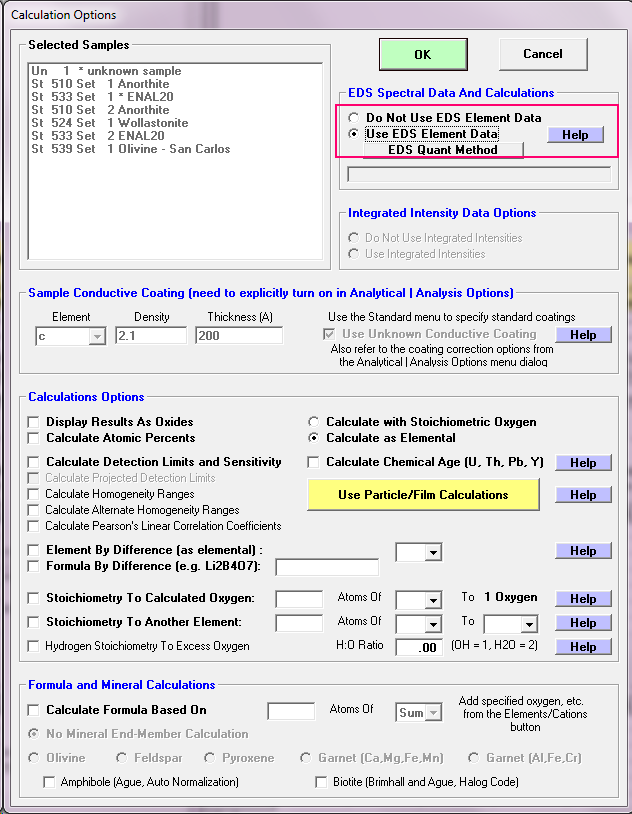
Now you might say "Why is there an option for this? Why not have it turned on all the time?". Well, we often acquire EDS spectra routinely with our WDS data just to check for missing elements or for checking sample charging (observing the Duane-Hunt limit). Also sometime we want to switch back and forth between a WDS acquired element and an EDS acquired element.
Also, sometimes we don't want to have to fire up the EDS software, if we are not interested in seeing EDS intensities (we utilize the Bruker and Thermo software obtain the EDS net intensities because, well, they know what they are doing with EDS spectra!). Once we have the net intensities from our standards and our unknowns we can run them through the matrix and interference, etc., corrections with or without the WDS elements. Pretty cool!
If our colleague had been analyzing some WDS elements also, this problematic option would have been more obvious because the WDS element intensities would have been properly displayed, and only the EDS elements would have had zero intensities.
So we realized that we needed to make that warning about the missing standard intensities more explicit, if the missing standard intensity is an EDS element. So now the error dialog (as soon we upload the next version) will show this message:
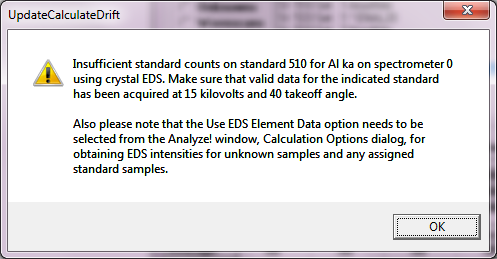
We also now display the "EDS Spectrum Data Analysis is disabled" warning in the log window using a magenta font color! So now, once the Use EDS Element Data option is selected, we obtain these EDS net intensities:
EDS Spectrum Parameters (for datarow=1):
Time Constant= 0, Sample Time= 60.0
Elapsed Time= 75.3, Dead Time(%)= 20.4
Live Time= 60.0, Channels= 2048
Ev Per Chan= 10, Max Counts= 69277
On-Peak (off-peak corrected) or EDS (bgd corrected) or MAN On-Peak X-ray Counts (cps/1nA) (and Faraday/Absorbed Currents):
ELEM: Al ka Si ka Ca ka Mg ka Fe ka BEAM1 BEAM2
BGD: EDS EDS EDS EDS EDS
SPEC: 0 0 0 0 0
CRYST: EDS EDS EDS EDS EDS
ORDER: 1 1 1 1 1
5G .00 293.49 .44 491.10 25.28 19.970 19.970
AVER: .00 293.49 .44 491.10 25.28 19.970 19.970
SDEV: .00 .00 .00 .00 .00 .000 .000
1SIG: .00 .49 .02 .64 .15
SIGR: .00 .00 .00 .00 .00
SERR: .00 .00 .00 .00 .00
%RSD: .00 .00 .00 .00 .00
And these quant results:
St 539 Set 1 Olivine - San Carlos, Results in Elemental Weight Percents
ELEM: Al Si Ca Mg Fe Mn Ni O
TYPE: ANAL ANAL ANAL ANAL ANAL SPEC SPEC SPEC
BGDS: EDS EDS EDS EDS EDS
TIME: 60.00 60.00 60.00 60.00 60.00 --- --- ---
BEAM: 19.97 19.97 19.97 19.97 19.97 --- --- ---
ELEM: Al Si Ca Mg Fe Mn Ni O SUM
5 .000 19.398 .046 29.780 7.423 .108 .291 43.593 100.639
AVER: .000 19.398 .046 29.780 7.423 .108 .291 43.593 100.639
SDEV: .000 .000 .000 .000 .000 .000 .000 .000 .000
SERR: .000 .000 .000 .000 .000 .000 .000 .000
%RSD: .00 .00 .00 .00 .00 .00 .00 .00
PUBL: n.a. 19.076 .007 29.802 7.423 .108 .291 43.593 100.300
%VAR: --- 1.69 547.87 (-.07) (.00) .00 .00 .00
DIFF: --- .322 .039 (-.02) (.00) .000 .000 .000
STDS: 510 510 524 539 539 --- --- ---
Note that the olivine standard was assigned for Fe and Mg, and the Si (and other elements) were analyzed using a secondary standard. This is the best thing about performing EDS analyses in Probe for EPMA- one *must* utilize actual, honest, got to love 'em, standards!
 Edit by John: the latest PFE update now includes improved warning messages regarding this issue.

 To see the latest forum posts scroll to the bottom of the main page and click on the View the most recent posts on the forum link