We all occasionally come across a sample that is a complete unknown and we need to perform a careful qualitative analysis before we make any attempt at quantitative analysis. In other words, if the element you are attempting to quantify is only an artifact (e.g., secondary spectral interferences (WDS) or sum or escape peaks (EDS)), and not really present in the sample, you are wasting everyone's time and money or worse!
Some of these "blunders" using Auto ID features in EDS software, as they have been characterized by Dale Newbury at NIST, are described here:
http://epmalab.uoregon.edu/Workshop3/Peak_ID_Workshop08-Handout.pdfThe following post will describe some approaches for identification of unknown peaks in WDS spectra from an EPMA perspective where many trace elements can be detected, with moderate counting times per scan point (e.g., 25 seconds or so).
These spectra were acquired by Paul Carpenter at NASA Marshall Flight Center on the JEOL 8900 instrument and the complete set of wavescans can be obtained as an attachment below. This file can be opened easily using Probe for EPMA and does not require a specific standard database.
The conditions were 20 keV, 100 nA, and the spectrometers were calibrated to Cu (LiFH), Fe (LIF), K (PETJ) and Mg (TAP). Since Fe and Cu were both on LIF we can use either crystal as a starting place for our peak identification since it is generally observed that starting with the highest energy lines is less likely to confuse the analyst with higher order Bragg reflections.
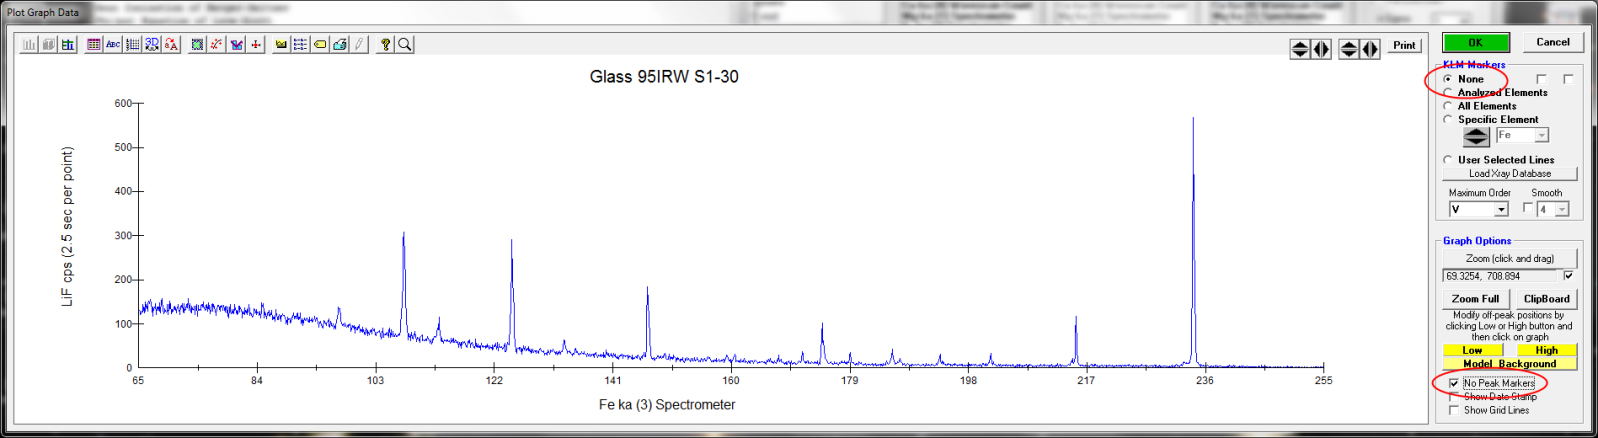
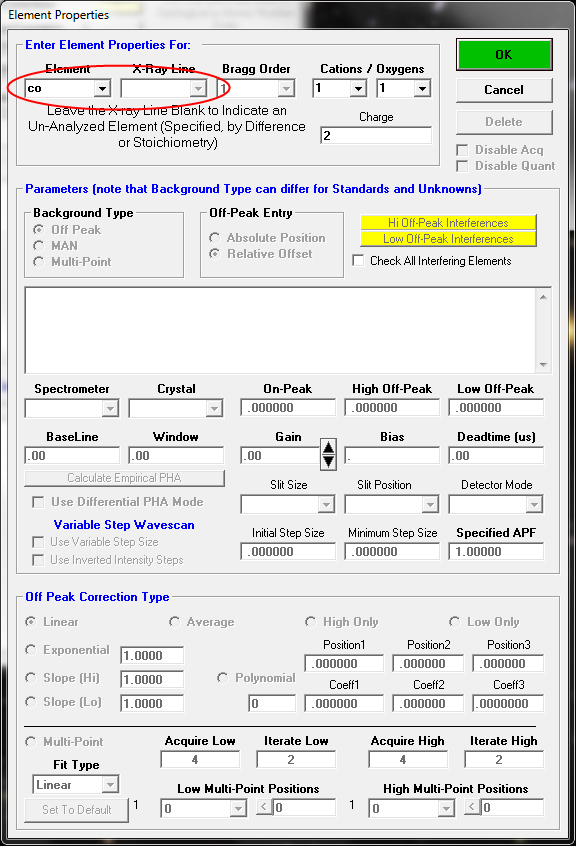
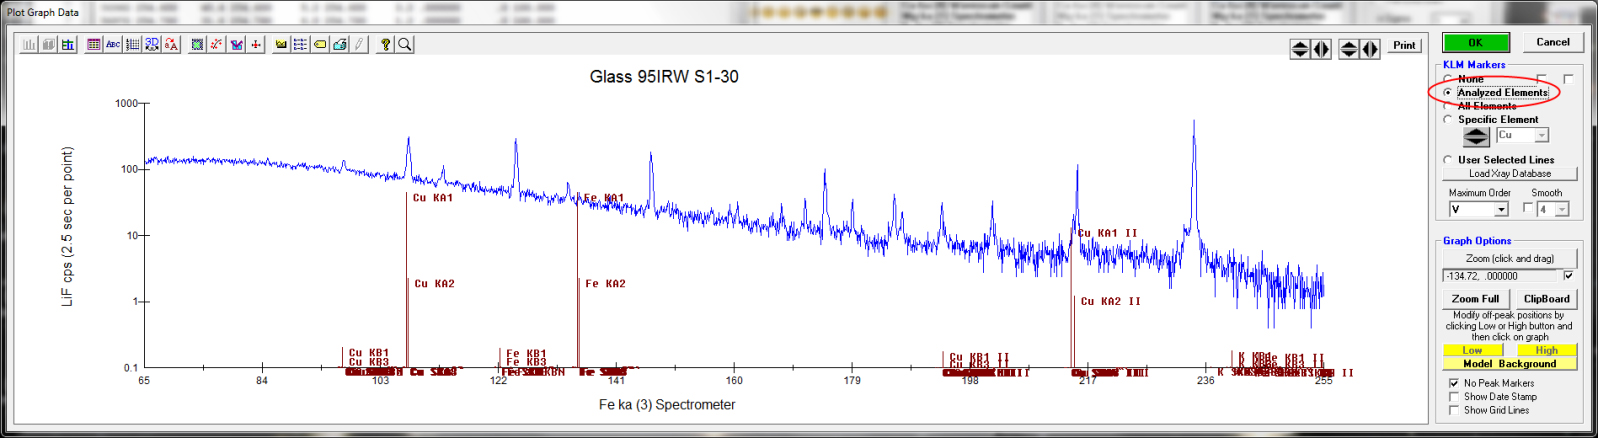
Note that no KLM markers are displayed and that the on/hi/lo off-peak positions (for Fe) are turned off in the display. We then start by attempting to find the identify of the highest intensity peaks in the spectrum by selecting the single element option and scrolling through the periodic table looking for matches to our unknown spectra as seen here:
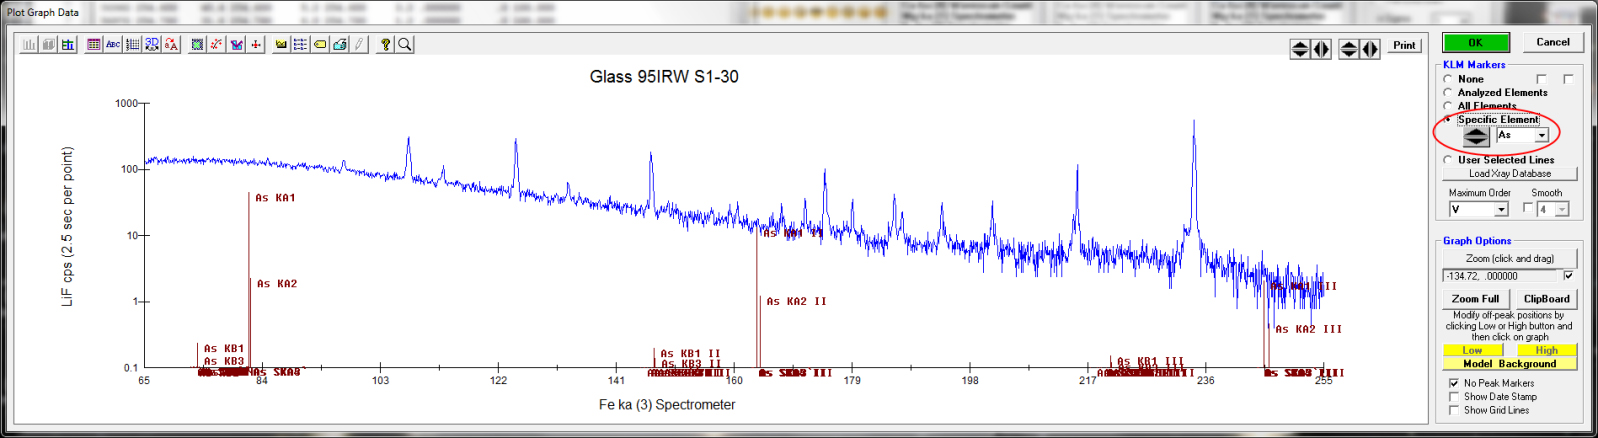
I generally use the log-linear option from the Plot! window and start with the highest energy element that is possible for this energy range, such as As or Se.
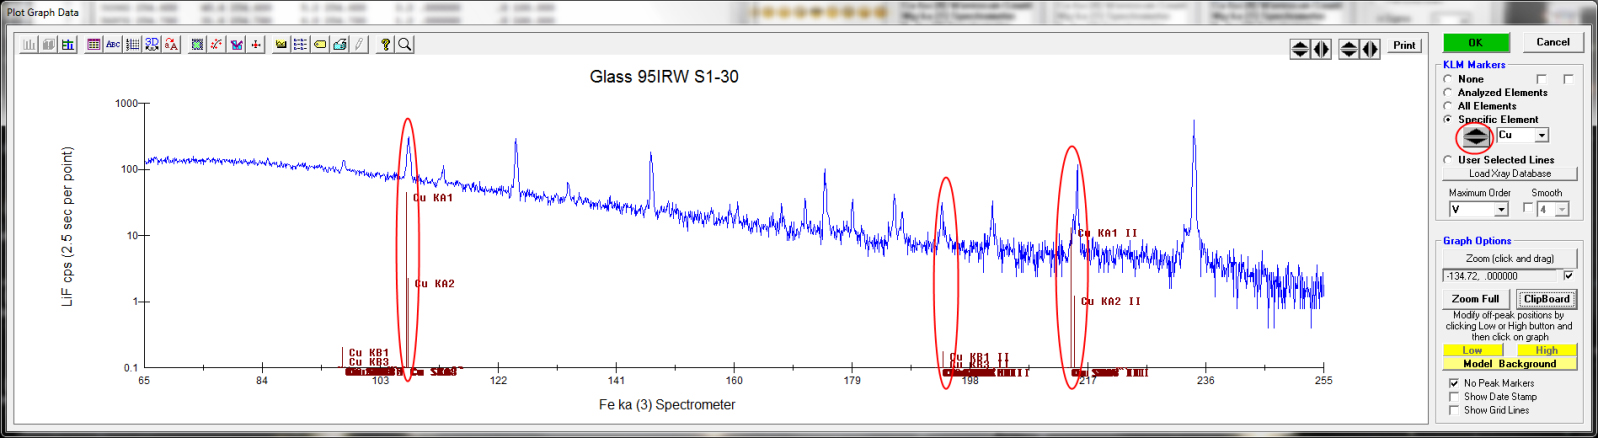
Scrolling downwards in atomic number we see a possible match for Cu and after exiting the graph window we can add the element to our element list in the Elements/Cations dialog.
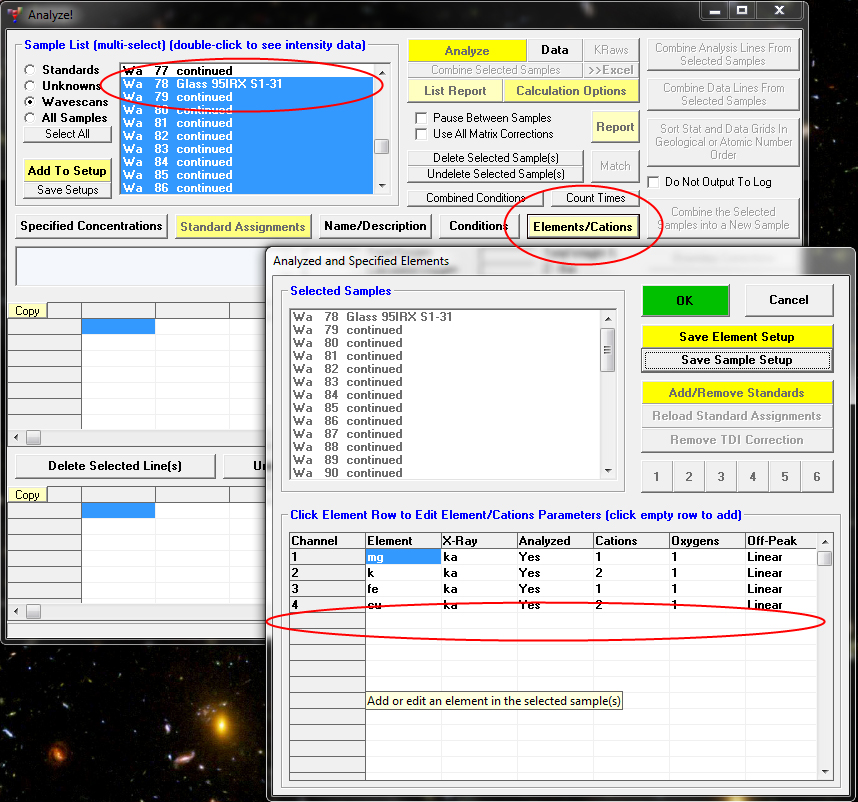
Be sure to select the wavescan sample when adding unanalyzed elements (with no x-ray line specified) so the program automatically displays the analyzed *and* unanalyzed KLM markers in the graph.
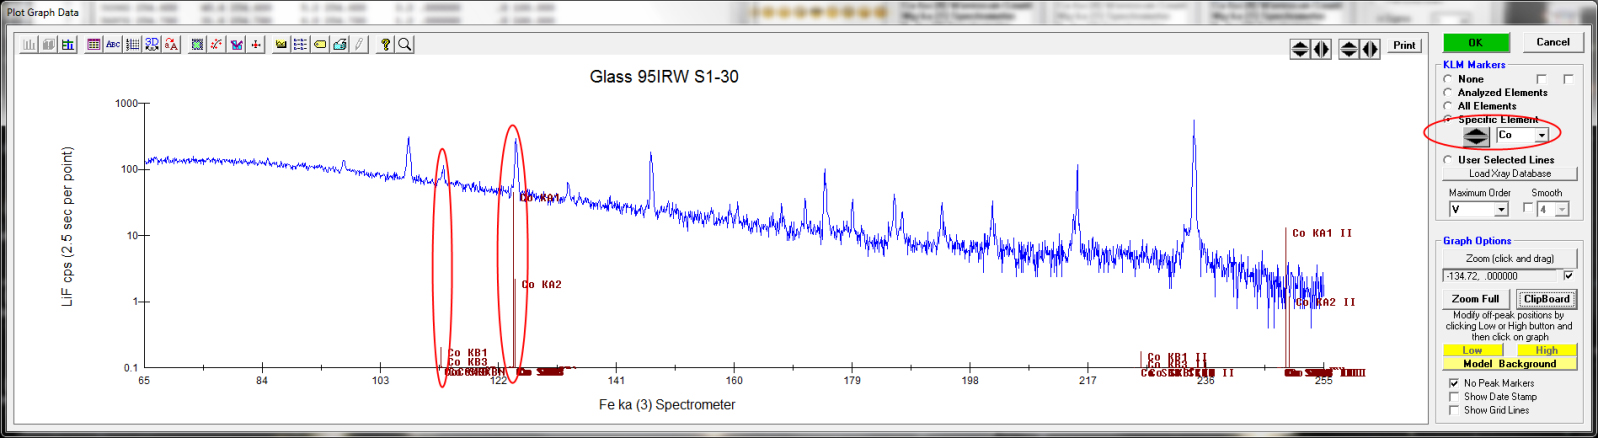
However, since Cu is already one of the elements we used to tune our spectrometers, we can skip this step, though since Co is the next element we get a possible identification for (see below), we add it as an UNanalyzed element in the Elements/Cations dialog.
The point is that by alternately selecting the Specific Element and Analyzed Elements options we can see if the peak(s) in question have already been identified as seen here:
Though it would appear that Fe is not present at this precision level, we continue scrolling through the atomic numbers as we make a possible identification of Co, since both the alpha and beta lines appear to be present and they do not match peaks already tentatively identified:
After further scrolling we note the possible presence of Mn, V and Ca and when we click the Analyzed Elements KLM option (which automatically includes the UNanalyzed elements also), we see that most of the lines are identified by two or more KL markers.
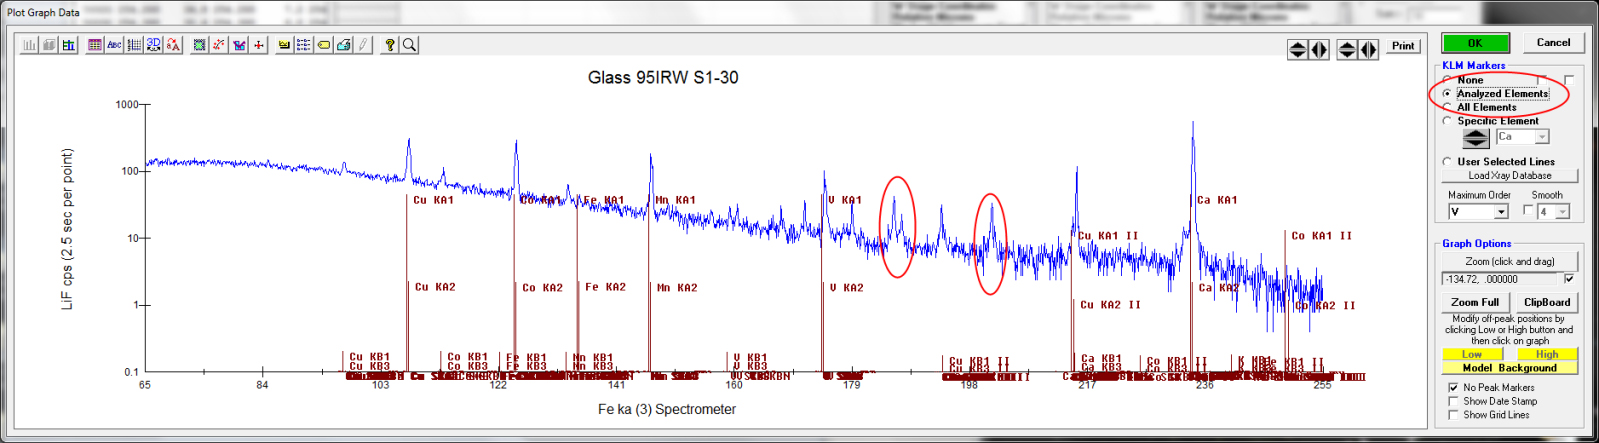
Except the two circled above! So what would be your next step?


 To protect your privacy, you must first log in before you can view forum statistics and user profiles