Hi,
could you also add raw intensities as an option for export as slice/polygon/etc to Surfer?
Thanks!
Hi Anette,
I went to look into this and found the reason one can output x-ray maps of raw intensities, but not for the slice, polygon, etc outputs. It's because there are 256 menus and sub menus in CalcImage (there a lot of output types!) and that is the maximum number of menus allowed in one window, so I would have to re-design things a bit before I can add any new menus to CalcImage.
In the meantime I have a practical suggestion: simply output a slice script for one of the quant types for the project you are working on, and copy that script to another file name. For example, let's say you output a quant script named:
Fe-Mo-Cr-Ni_04-20-2012_Fe-Mo-Cr-1_00451__Quant_Slice.bas
So rename it to something like:
Fe-Mo-Cr-Ni_04-20-2012_Fe-Mo-Cr-1_00451__Raw_Int_Slice.bas
Then open the script in Scripter (or any text editor) and edit the section near the top, to utilize the raw intensity GRD files. So edit this section:
Dim Sample As String
Sample$ = "Fe-Mo-Cr-Ni_04-20-2012_Fe-Mo-Cr-1_00451__Quant_Slice"
Dim SampleTitle As String
SampleTitle$ = "Fe-Mo-Cr-Ni_04-20-2012_Fe-Mo-Cr-1_00451_, Elemental Wt.%"
Dim iMax As Integer
iMax% = 6
XInvert% = -1
YInvert% = -1
XLabel$ = "X (mm) [0.381 mm]"
YLabel$ = "Y (mm) [0.381 mm]"
ReDim FileArray(1 To iMax%) As String
FileArray$(1) = "Fe-Mo-Cr-1_00451_SP1_O_PC1__Quant"
FileArray$(2) = "Fe-Mo-Cr-1_00451_SP2_Mo_LPET__Quant"
FileArray$(3) = "Fe-Mo-Cr-1_00451_SP3_Ni_LLIF__Quant"
FileArray$(4) = "Fe-Mo-Cr-1_00451_SP4_Cr_PET__Quant"
FileArray$(5) = "Fe-Mo-Cr-1_00451_SP5_Fe_LIF__Quant"
FileArray$(6) = "Fe-Mo-Cr-Ni_04-20-2012_Fe-Mo-Cr-1_00451__Total_Quant"
ReDim ZLabel(1 To iMax%) As String
ZLabel$(1) = "O Wt%"
ZLabel$(2) = "Mo Wt%"
ZLabel$(3) = "Ni Wt%"
ZLabel$(4) = "Cr Wt%"
ZLabel$(5) = "Fe Wt%"
ZLabel$(6) = "Total Wt%"
to something like this:
Dim Sample As String
Sample$ = "Fe-Mo-Cr-Ni_04-20-2012_Fe-Mo-Cr-1_00451__Raw_Int_Slice"
Dim SampleTitle As String
SampleTitle$ = "Fe-Mo-Cr-Ni_04-20-2012_Fe-Mo-Cr-1_00451_, Raw Intensity (cps)"
Dim iMax As Integer
iMax% = 5
XInvert% = -1
YInvert% = -1
XLabel$ = "X (mm) [0.381 mm]"
YLabel$ = "Y (mm) [0.381 mm]"
ReDim FileArray(1 To iMax%) As String
FileArray$(1) = "Fe-Mo-Cr-1_00451_SP1_O_PC1_"
FileArray$(2) = "Fe-Mo-Cr-1_00451_SP2_Mo_LPET_"
FileArray$(3) = "Fe-Mo-Cr-1_00451_SP3_Ni_LLIF_"
FileArray$(4) = "Fe-Mo-Cr-1_00451_SP4_Cr_PET_"
FileArray$(5) = "Fe-Mo-Cr-1_00451_SP5_Fe_LIF_"
ReDim ZLabel(1 To iMax%) As String
ZLabel$(1) = "O Intensity (cps)"
ZLabel$(2) = "Mo Intensity (cps)"
ZLabel$(3) = "Ni Intensity (cps)"
ZLabel$(4) = "Cr Intensity (cps)"
ZLabel$(5) = "Fe Intensity (cps)"
Note that I edited (highlighted in red), the sample type and the sample title, and the GRD file names and the label for each raw intensity GRD file and most importantly, changed the number of files to 5 since there is no such thing as a "total" raw intensity file!
I hope this helps whatever you are trying to accomplish. The same technique could be used to output raw intensities using the polygon and strip scripts.
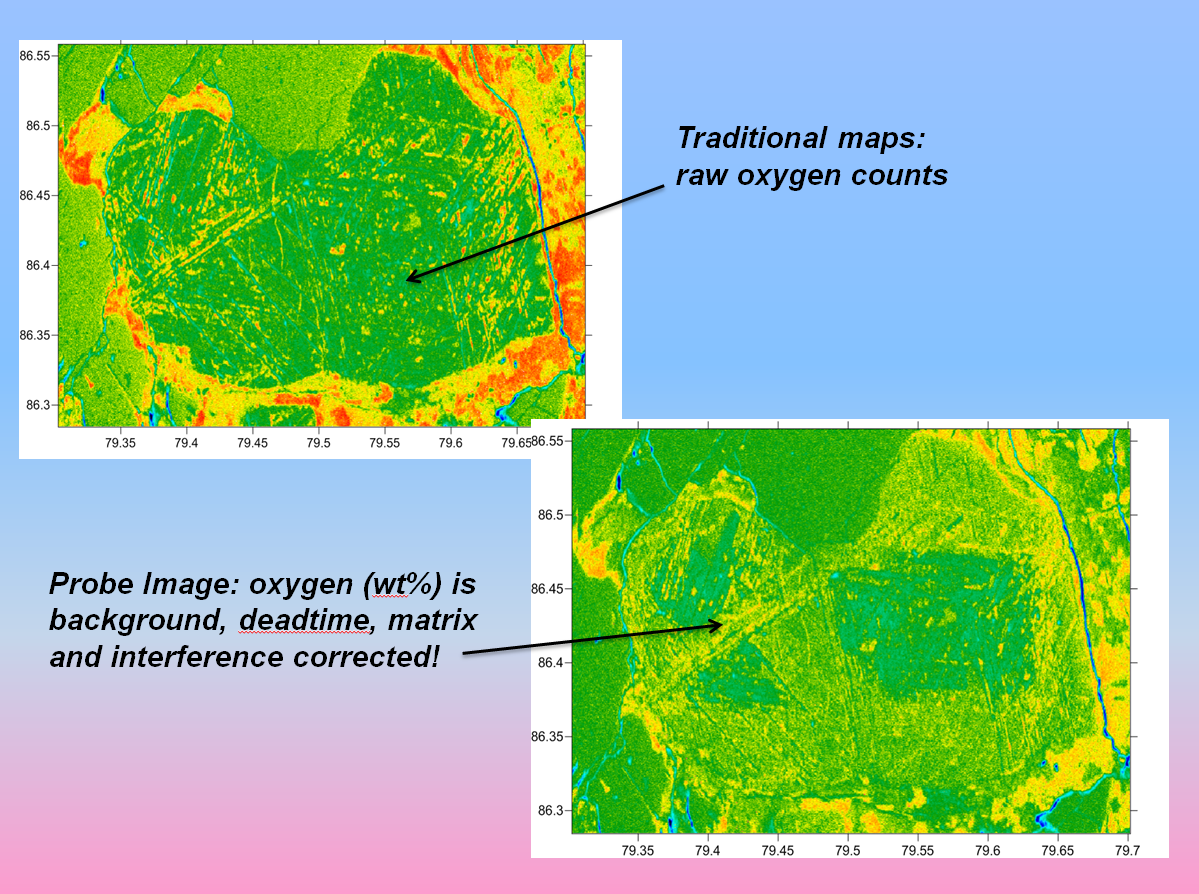
The only useful thing I can think of (though I'm sure there are other useful things one could do) with slices of the raw intensities, is to compare the differences between raw x-ray intensities with the quant values to demonstrate the importance of the background correction, matrix correction and interference corrections, etc. for quantitative maps.
Sort of what you did here (but not using slices through the data):
Hope this works for you until I can re-design the CalcImage menus.
Note that if you have version 13 or higher of Surfer, the XInvert and YInvert flags tells Surfer to automatically utilize an anti-Cartesian stage orientation so the slice image will appear in the correct orientation for JEOL instruments!
See attached below, my attempt at modifying a quant slice to use raw intensity GRD files.
john


 If you can't see some "in-line" images in a post, try "refreshing" your browser!