Author Topic: MAN features questions  (Read 5535 times)

JohnF

  • Professor
  • ****
  • Posts: 105
  • CQ DX DE WA3BTA
    • John's EPMA
MAN features questions
« on: February 16, 2016, 10:36:07 AM »
Running most recent PfE 11.3.4.

2 questions:

1. This is a brand new setup, and I am not importing anything. So it came as a surprise, when after first clearing MAN bkgs (just to see if this made any difference, it did not), many UPDATEGETMANSTANDARDS windows starting popping up saying I had not acquired MAN intensity data for element y on standard Z.....when I was NOT using standard Z. Yes, I had added standard Z to the run originally but decided not to acquire any MAN counts on it. Is there a reason for assuming there are missing standards counts? It would seem more logically to only consider standards which have had counts acquired for them.

2. Checking on some possible inconsistencies in MAN values showing up in the MAN plot window. Therefore, I ran some wavescans on the MAN standards in question, to determine what an independent view might show for the MAN bkg value.
For example , Using MgO, Al2O3 and SiO2 to determine MAN bkg of Na Ka, running the MAN acquisition gave the following values
MgO 24, Al2O3 18 and SiO2 17, and when I ran wavescans I verified those were correct. But I was initially confused when I saw that the values on the MAN graphic plot were different: MgO 37, Al2O3 31 and SiO2 9.5...until I guessed that these were continuum corrected, so I turned off that box and bang...there was 24, 18, and 17. Cool.

But now I am scratching my head...what number then does PfE use for the background? So is the continuum-modified value on the curve used directly as the background? Or is it then uncorrected for when it is subtracted from the raw peak counts (which at first instance aren't corrected for anything, one assumes).

Probeman

  • Emeritus
  • *****
  • Posts: 2858
  • Never sleeps...
    • John Donovan
Re: MAN features questions
« Reply #1 on: February 16, 2016, 11:23:50 AM »
2. Checking on some possible inconsistencies in MAN values showing up in the MAN plot window. Therefore, I ran some wavescans on the MAN standards in question, to determine what an independent view might show for the MAN bkg value.
For example , Using MgO, Al2O3 and SiO2 to determine MAN bkg of Na Ka, running the MAN acquisition gave the following values
MgO 24, Al2O3 18 and SiO2 17, and when I ran wavescans I verified those were correct. But I was initially confused when I saw that the values on the MAN graphic plot were different: MgO 37, Al2O3 31 and SiO2 9.5...until I guessed that these were continuum corrected, so I turned off that box and bang...there was 24, 18, and 17. Cool.

But now I am scratching my head...what number then does PfE use for the background? So is the continuum-modified value on the curve used directly as the background? Or is it then uncorrected for when it is subtracted from the raw peak counts (which at first instance aren't corrected for anything, one assumes).

Hi John,
Yes, the displayed MAN curve is by default corrected for continuum absorption for each MAN standard.  One can display the raw data in the MAN dialog, but the stored MAN background curve is always corrected for absorption as suggested by John Armstrong.  Essentially this creates a calibration curve of the GENERATED intensities (as opposed to the emitted intensities one measured).   Why do we need this?  Because we want to understand the relationship between continuum intensity and Z, without the complications of the continuum absorption, which will be different for every material (including our unknowns!).

So now that we have a continuum corrected curve we need to apply this to our unknown material, which is of course a measurement of the emitted intensities. So we de-correct the calculated MAN intensity value (based on the sample z-bar) for the actual matrix physics of our unknown and then subtract that from the measured emitted intensity of our sample.

My trace MAN paper is under review currently but here's an excerpt from it regarding this point:

Quote
This “virtual” intensity MAN calibration curve which has been corrected for continuum absorption, is then stored for subsequent use for MAN background correction of unknown compositions.  During the iterated matrix correction of the unknown intensities, we initially assume an arbitrary Z-bar for the unknown, and then calculate the background intensity from our previously acquired and stored “virtual” MAN intensity regression. This calculated average Z is then improved as the composition converges during the matrix iteration. Finally we de-correct the calculated background intensity for the continuum absorption associated with the actual unknown composition as seen here:

         Iraw = Icor/ZAFu

where ZAFu is the absorption term for the unknown composition undergoing iteration. The IRAW background intensity is then simply subtracted from the measured unknown on-peak intensity to obtain the background corrected intensity for the unknown composition. This calculation proceeds until the composition (and hence average Z) converges, and a proper background correction has been applied.
The only stupid question is the one not asked!

Probeman

  • Emeritus
  • *****
  • Posts: 2858
  • Never sleeps...
    • John Donovan
Re: MAN features questions
« Reply #2 on: February 17, 2016, 10:40:39 PM »
1. This is a brand new setup, and I am not importing anything. So it came as a surprise, when after first clearing MAN bkgs (just to see if this made any difference, it did not), many UPDATEGETMANSTANDARDS windows starting popping up saying I had not acquired MAN intensity data for element y on standard Z.....when I was NOT using standard Z. Yes, I had added standard Z to the run originally but decided not to acquire any MAN counts on it. Is there a reason for assuming there are missing standards counts? It would seem more logically to only consider standards which have had counts acquired for them.

Hi John,
I will try to have the program ignore MAN standards that have no data.  But it's complicated because when you load in a new file setup, the MAN assignments get loaded in automatically even if there are no standards acquired yet. If you want to avoid error messages about MAN standards with no data, it might be best to wait until all standards have been acquired before clicking the Assign MAN Fits menu.

Or you can deselect the offending standard from each MAN fit and click the Update Fit button.

Or you can remove the offending standard from the run completely, using the Add/Remove Standards To/From Run menu.
john
« Last Edit: February 18, 2016, 03:58:16 PM by Probeman »
The only stupid question is the one not asked!

Ben Buse

  • Professor
  • ****
  • Posts: 499
Re: MAN features questions
« Reply #3 on: November 30, 2016, 09:10:51 AM »


         Iraw = Icor/ZAFu


Hi John,

Can I just check is ZAFu = 1/[f(x)u] where [f(x)u] is given by calczaf for a material.

e.g.


Thanks

Ben
« Last Edit: April 12, 2020, 07:43:55 PM by John Donovan »

Probeman

  • Emeritus
  • *****
  • Posts: 2858
  • Never sleeps...
    • John Donovan
Re: MAN features questions
« Reply #4 on: November 30, 2016, 02:52:05 PM »

         Iraw = Icor/ZAFu


Can I just check is ZAFu = 1/[f(x)u] where [f(x)u] is given by calczaf for a material.

Hi Ben,
I think you just found two mistakes in our paper! One descriptive mistake and one small physics mistake but still... worth noting.  :-[

First, although I denote it as ZAF^s in the paper, the term is referring to the bulk matrix *absorption correction* term for the standards used in the MAN calibration curve. Not the full ZAF correction term. Just FYI, the process of continuum production and emission should be calculated using an actual continuum absorption correction, but when I tried some continuum absorption corrections from the literature (e.g., Myklebust), I got much worse results than using a bulk matrix absorption correction.  As for stopping power, backscatter and fluorescence effects, the physics of continuum production is so entirely different from characteristic emission, that I decided to just use the absorption correction term in the MAN fit correction. And the bulk matrix absorption term seems to work well as shown in the Trace MAN paper in figures 1, 2, and 3, 4 linked here:

http://epmalab.uoregon.edu/publ/A%20new%20EPMA%20method%20for%20fast%20trace%20element%20analysis%20in%20simple%20matrices.pdf

Second, the paper states "note that the ZAF^s term here is the inverse of the f(x) term in Ware and Reed’s expression" and that is not exactly correct. The f(chi) term is the ratio between the generated and emitted intensities and the matrix absorption correction is the absorption correction relative to the pure element absorption correction and therefore is 1.0 for all pure elements. So we shouldn't be using the absorption correction term in the MAN fit (at least for pure element MAN standards), but rather the f(chi) term as you point out. The effect is going to be small, but worth doing, especially for trace elements I think.

I almost always use pure oxides (MgO, SiO2, TiO2, etc.) for my MAN curves and when one does that, the differences between the absorption correction are quite similar to the f(chi) term. Here I've plotted the MAN curve for Na Ka (a very highly absorbed wavelength) using the absorption correction term:


and here is the same but corrected using the f(chi) term:


The absolute values are slightly different (which when de-corrected for the unknown matrix gives the same result because they are multiplied in the standard fit, but divided in the unknown correction), but the error in the regression fits are exactly the same!  These are all compound standards so as I said above this is expected, but I think the curves will look more different when some pure elements are included in the MAN fit as you pointed out. But I can't lay my hands on an MAN curve with pure elements at the moment, but I will look further.

So yes, I agree we should be using the f(chi) values for the MAN continuum absorption correction.  Good catch!
john

PS By the way you might want to use the gallery feature here on the user forum rather than a Dropbox link, so your images will be preserved along with your post!
« Last Edit: April 12, 2020, 07:44:16 PM by John Donovan »
The only stupid question is the one not asked!

Probeman

  • Emeritus
  • *****
  • Posts: 2858
  • Never sleeps...
    • John Donovan
Re: MAN features questions
« Reply #5 on: December 01, 2016, 07:38:44 AM »
Doh! Nevermind! I was wrong about being wrong...

It doesn't matter whether one uses the absorption correction term or the f(chi) term for the MAN regression and MAN correction, the results are exactly the same! Why? Because the absorption correction is the f(chi) term just re-normalized to the pure element *for that emission line*. The absorption correction for *that emission line* for other pure elements is of course, *not* 1.0!

So because in the MAN regression, the intensities are corrected for continuum absorption using this expression:

Icor = Iraw * ACORs

where Icor is the absorption corrected intensity, Iraw is the measured intensity and ACORs is the absorption correction for the emission line is each standard material (pure of compound).

And the unknown background intensities are de-corrected for the unknown absorption correction in the actual MAN bgd correction for the unknown, using this expression:

Iraw = Icor / ACORu

where Iraw is the calculated "raw" background for the unknown composition (to be subtracted from the raw P + B measurement to obtain the net intensity), Icor is the interpolated background from the previous MAN regression curve and ACORu is the absorption correction for the emission line in the unknown composition, there is, *in the end*,
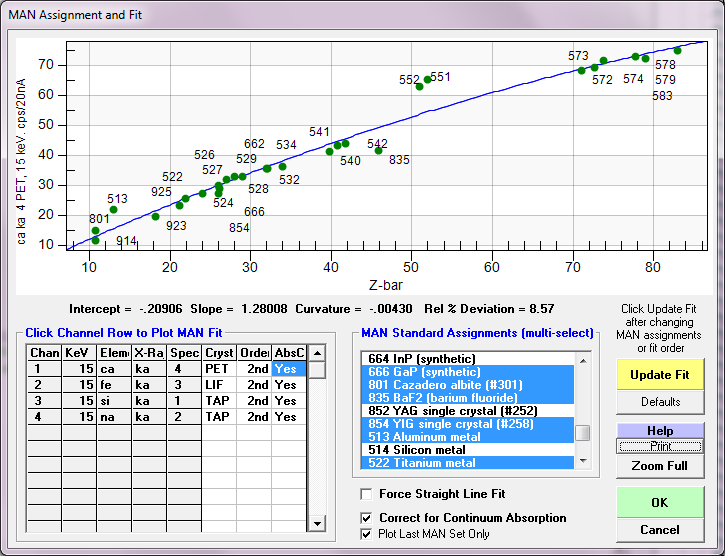
 no difference in the calculation!

That is, because we multiply, and then divide, it doesn't really matter what absorption correction term we use, as long as we use the same term for both operations.  To demonstrate this I found a probe run from 2004 where I had measured MAN calibration curves for 42 standards including compounds and pure elements. Here is the MAN plot for Ca Ka using the absorption correction term for the MAN regression (and MAN correction):


Now here is the same plot but using the f(chi) term:


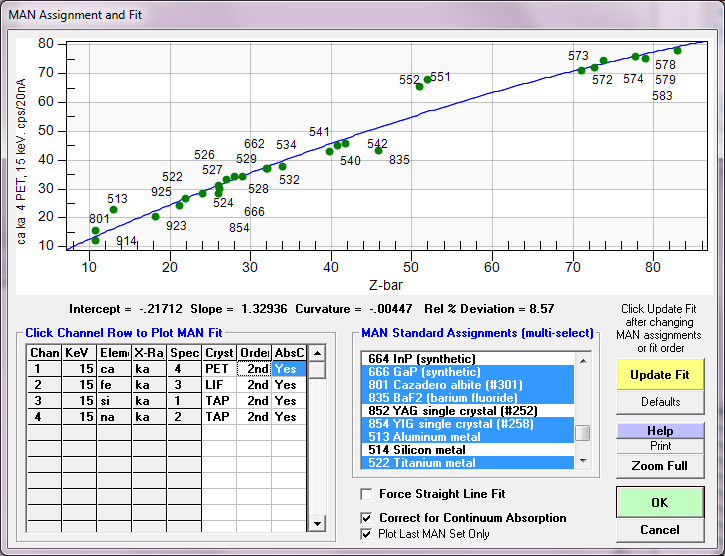
Yes, the absolute values are slightly different because the absorption correction term is normalized to pure Ca, and the f(chi) is not, but the results are *exactly* the same after both multiplying and dividing the MAN intensities.

Sorry about that- false alarm... we can all "go home now"   ;D
john

PS What caused some confusion in the paper was that I denoted the continuum absorption correction as ZAFs and ZAFu, when I should have named it ACORs and ACORu.
« Last Edit: April 12, 2020, 07:44:37 PM by John Donovan »
The only stupid question is the one not asked!

Brian Joy

  • Professor
  • ****
  • Posts: 296
Re: MAN features questions
« Reply #6 on: December 01, 2016, 01:49:19 PM »
First, although I denote it as ZAF^s in the paper, the term is referring to the bulk matrix *absorption correction* term for the standards used in the MAN calibration curve. Not the full ZAF correction term. Just FYI, the process of continuum production and emission should be calculated using an actual continuum absorption correction, but when I tried some continuum absorption corrections from the literature (e.g., Myklebust), I got much worse results than using a bulk matrix absorption correction.  As for stopping power, backscatter and fluorescence effects, the physics of continuum production is so entirely different from characteristic emission, that I decided to just use the absorption correction term in the MAN fit correction.

A couple years ago, I tried to model WD background intensity for arsenic at and around the La peak position (comparing to the spectrum measured on high-purity, uncoated As) using the method of Smith and Reed (1981, attached), in which the spectrum of the element or compound of interest is normalized to a spectrum collected on an element or compound that produces no characteristic X-rays within the Bragg-angle region of interest.  I collected reference spectra on high-purity Nb and Fe* and applied the continuum intensity expression of Smith and Reed (modified from Kramers) along with the continuum absorption and backscatter loss corrections of Small et al. (1987, also attached).  I found that the results were not really satisfactory and differed significantly depending on the reference material chosen (see below).  My next project is to try the MAN approach instead.


Note:  The curves labeled "Fe reference" and "Nb reference" represent the calculated As continuum intensities normalized to spectra collected on Fe and Nb, respectively.

* I should note that I substituted polynomials for the actual measured Fe and Nb continuum intensities.  This way I was able to produce smooth curves and ignore minor interferences from high-order reflections of the Fe K lines.
« Last Edit: April 12, 2020, 07:44:56 PM by John Donovan »
Brian Joy
Queen's University
Kingston, Ontario
JEOL JXA-8230

Probeman

  • Emeritus
  • *****
  • Posts: 2858
  • Never sleeps...
    • John Donovan
Re: MAN features questions
« Reply #7 on: December 01, 2016, 02:16:44 PM »
I found that the results were not really satisfactory and differed significantly depending on the reference material chosen (see below).  My next project is to try the MAN approach instead.

Here's what I would say about the MAN method- it's hard to beat modeling the background intensity *at* the peak position!   :)

With the MAN method not only does one save a lot of time, but there are no absorption edges to deal with, no off-peak interferences to avoid, no curvature of the continuum to fit, etc., etc.
john
The only stupid question is the one not asked!

Brian Joy

  • Professor
  • ****
  • Posts: 296
Re: MAN features questions
« Reply #8 on: December 02, 2016, 05:59:28 AM »
I found that the results were not really satisfactory and differed significantly depending on the reference material chosen (see below).  My next project is to try the MAN approach instead.

Here's what I would say about the MAN method- it's hard to beat modeling the background intensity *at* the peak position!   :)

With the MAN method not only does one save a lot of time, but there are no absorption edges to deal with, no off-peak interferences to avoid, no curvature of the continuum to fit, etc., etc.
john

Of course it would be snap if I had PfE.
Brian Joy
Queen's University
Kingston, Ontario
JEOL JXA-8230

Probeman

  • Emeritus
  • *****
  • Posts: 2858
  • Never sleeps...
    • John Donovan
Re: MAN features questions
« Reply #9 on: December 02, 2016, 11:37:26 AM »
Ben (and Brian),
Just to be clear, one can utilize either the absorption correction term or the f(chi) terms for the MAN regression/correction, as long as one is consistent in their choice.  That is, for the ZAFs (or ACORs) term use either the absorption correction term or the 1/f(chi) term (inverted to be consistent with the absorption correction term), but do not mix them.

MAN Regression:
Icor = Iraw * ACORs

where ACORs is the absorption correction for each standard in the MAN regression

MAN Correction:
Iraw = Icor / ACORu

where ACORu is the absorption correction term for the unknown being corrected for background.

One obvious implication of this is that because the absorption correction for the unknown cannot be calculated until the composition is known, one must iterate the MAN background correction *during* the bulk matrix correction.  This graph should help explain it:


Please let me know if this is unclear.
john
« Last Edit: April 12, 2020, 07:45:10 PM by John Donovan »
The only stupid question is the one not asked!

Malcolm Roberts

  • Professor
  • ****
  • Posts: 134
Re: MAN features questions
« Reply #10 on: April 26, 2018, 07:07:08 PM »
John
Talking of MAN backgrounds, I mentioned a while back how nice it would be to be able to select ranges of Z for MAN samples for working out fits., lighter elements vs heavier and etc. Any ideas? When fitting I generally start broad and work towards the Z of the unknowns and often end up per element deleting the same standards for that run. It would speed things up big time if I could specify Z range to work within.
Cheers,
Malc.

John Donovan

  • Administrator
  • Emeritus
  • *****
  • Posts: 3304
  • Other duties as assigned...
    • Probe Software
Re: MAN features questions
« Reply #11 on: April 27, 2018, 09:03:16 AM »
John
Talking of MAN backgrounds, I mentioned a while back how nice it would be to be able to select ranges of Z for MAN samples for working out fits., lighter elements vs heavier and etc. Any ideas? When fitting I generally start broad and work towards the Z of the unknowns and often end up per element deleting the same standards for that run. It would speed things up big time if I could specify Z range to work within.
Cheers,
Malc.

Hi Malcolm,
I'm not sure I understand what you are saying.   Are you saying that in a particular run you have standards that cover a very large range of average Z, but your unknowns only cover a narrow range of average Z, and you want to only utilize the range of average Z used by your unknowns?

If I understand this correctly I would say the problem with restricting the range of average Z used in the MAN fits is, that your standards also need to be corrected for background, so the MAN fit needs cover the range of average Z utilized by *both* your unknowns and your standards.

Maybe you can post an example of what you are trying to accomplish.
john
John J. Donovan, Pres. 
(541) 343-3400

"Not Absolutely Certain, Yet Reliable"