This is a very subtle example (I probably should have chosen something more egregious!), but it serves to illustrate the steps in adjusting one's off-peak positions based on the background model fit to a wavescan (we all run wavescans before we acquire any data, right?).
This is a complex mineral with a lot of REEs, so here is a scan of Pr in the sample at default precision (6 secs per point using the continuous (ROM) scanning mode:
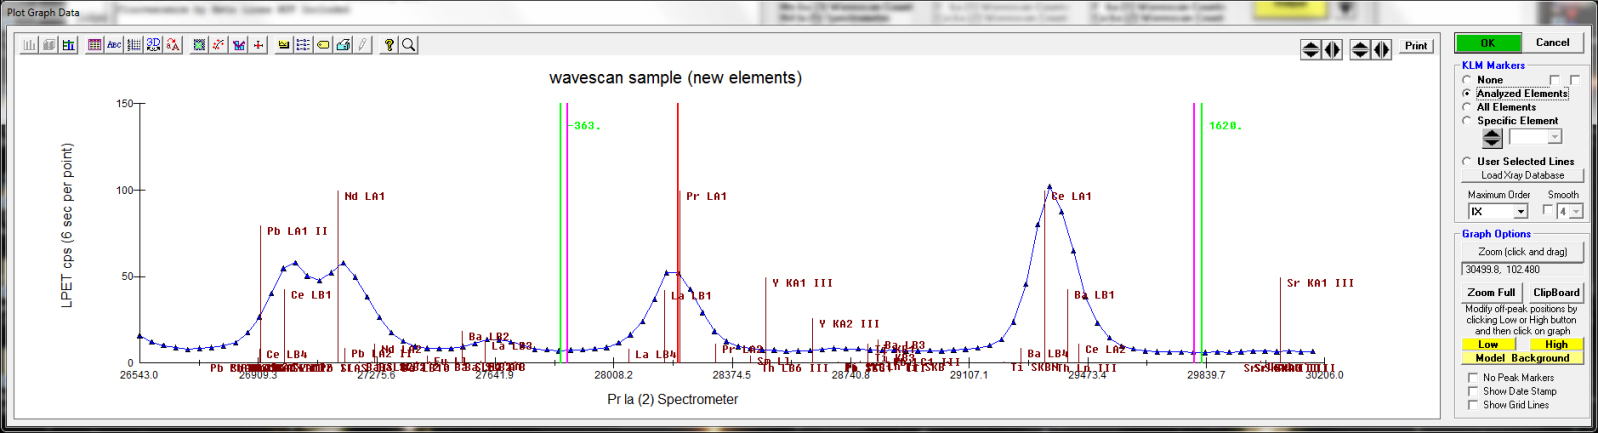
and here is a slightly "zoomed in" view:
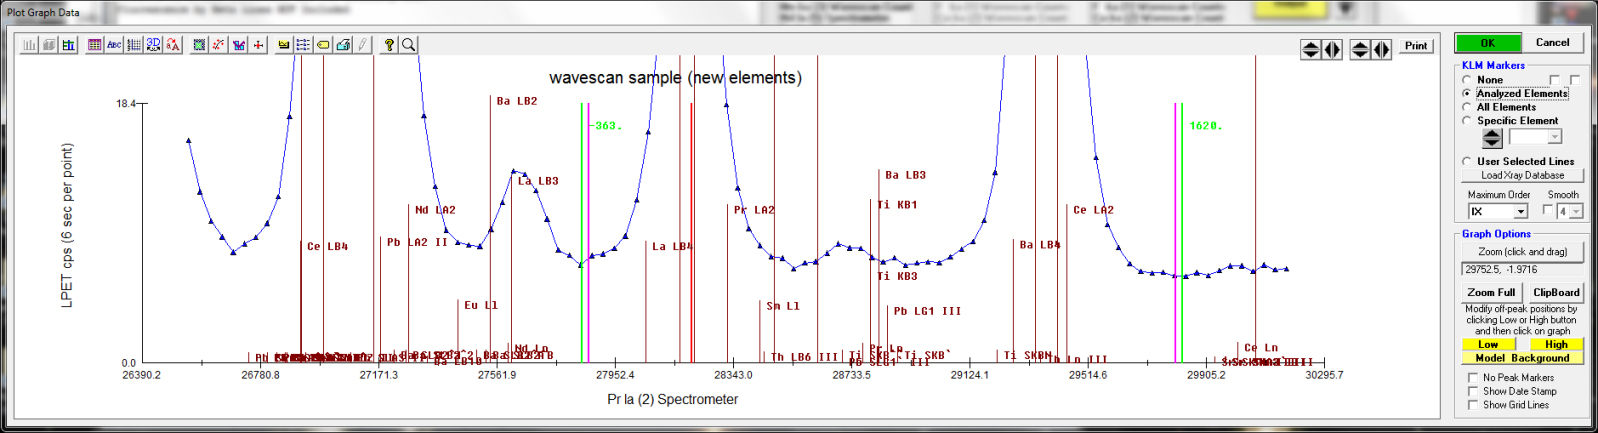
Note that there are previous off peak positions specified in magenta and new (current) selections in green. Why? Because in the zoomed in view we can see that in the case of the low off-peak position (left side), the off-peak position was not quite at the lowest measured continuum intensity, while the high off-peak position was just a little too close to the tail of the Ce La1 peak.
So both off-peak positions where moved slightly outwards. But what about the background fit?
So next click the Model Background button as seen here and you will see the fit to the default (linear) model:
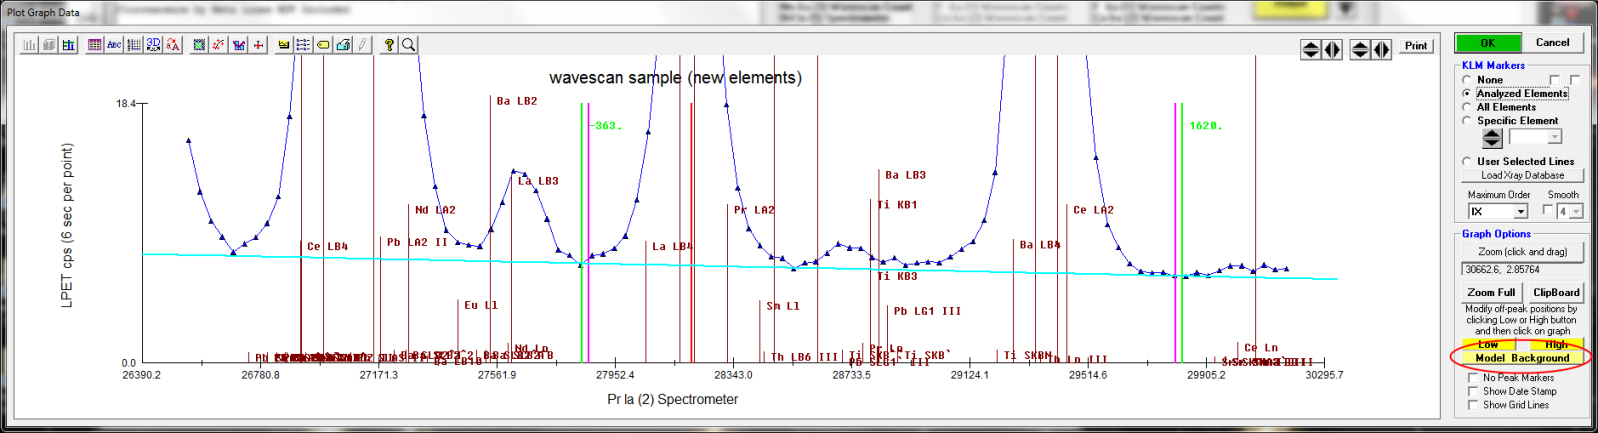
Not bad, but this spectrometer range is near the low side and therefore the background tends to be more exponential. We can see the default bgd fit intensity here:
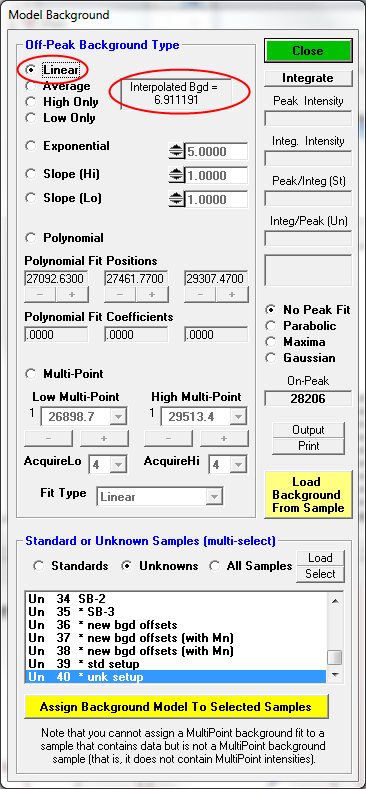
So now lets try an exponential fit as seen here:
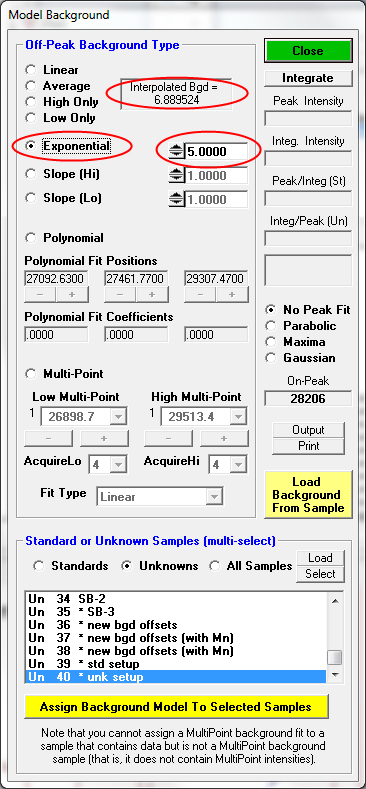
Note the lower background intensity value and also the ability to adjust the "tension" of the exponential fit.
The new off-peak positions are automatically saved, but if we want to save changes to the background fit type we can simply select the samples to assign it to specific samples at the bottom of the dialog (note All Samples option and Select button) using the mouse and then click the Assign Background Model To Selected Samples button as seen here:
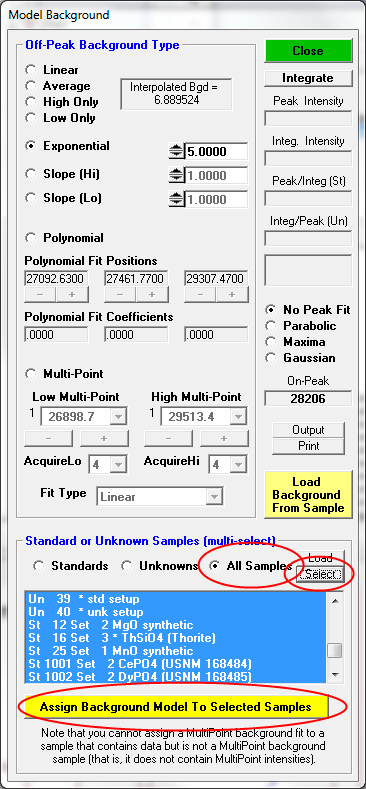
Remember, if you also include the currently displayed wavescan sample in this background fit assignment, the software will automatically load that assignment the next time you click the Model Backgrounds button.
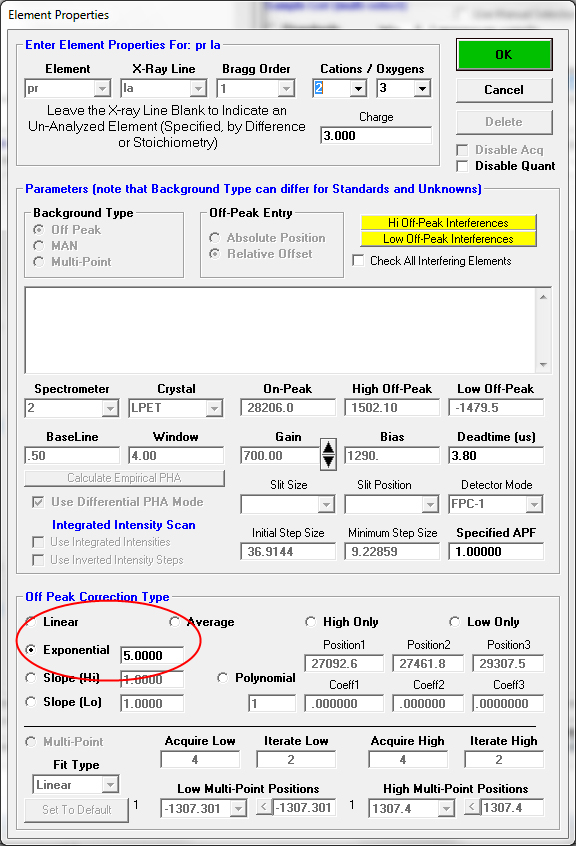
Or you can modify the fits from the Elements/Cations dialog as seen here:


 Welcome to the Probe Software forum area!