Author Topic: Searchable Excel L-value table  (Read 5686 times)

Ben Buse

  • Professor
  • ****
  • Posts: 488
Searchable Excel L-value table
« on: July 02, 2015, 01:15:05 AM »
I got distracted and wrote a Excel spreadsheet - using the NIST database from calczaf - in which you can type an element and it will give you the L-value. Or more useful you can type an L-value and it will give you the x-ray and list the adjacent x-rays - useful for checking interferences - when you don't have the L-value book to hand. I've uploaded in case its any use to anyone. Minimum intensity x-rays listed 0.5-1%.

The l-values are in pretty good agreement with JEOL published values usually within 0.02-4 mm. I presume the not complete agreement is due to not enough decimals within the 2d values for the crystals - values taken from Jeol L-value book.

   2d
TAP   25.757
PET   8.742
LIF   4.0267
« Last Edit: March 23, 2017, 01:54:32 PM by Ben Buse »

John Donovan

  • Administrator
  • Emeritus
  • *****
  • Posts: 3265
  • Other duties as assigned...
    • Probe Software
Re: Searchable Excel L-value table
« Reply #1 on: July 02, 2015, 08:45:37 AM »
I got distracted and wrote a Excel spreadsheet - using the NIST database from calczaf - in which you can type an element and it will give you the L-value. Or more useful you can type an L-value and it will give you the x-ray and list the adjacent x-rays - useful for checking interferences - when you don't have the L-value book to hand. I've uploaded in case its any use to anyone. Minimum intensity x-rays listed 0.5-1%.
Hi Ben,
Very nice. 

This spreadsheet is complemented by the CalcZAF X-Ray | Calculate Spectrometer Position menu dialog which includes refractive index effects for spectrometer positions as described here:

http://probesoftware.com/smf/index.php?topic=375.msg1979#msg1979

The l-values are in pretty good agreement with Jeol published values usually within 0.02-4 mm. I presume the not complete agreement is due to not enough decimals within the 2d values for the crystals - values taken from JEOL L-value book.
The reason for the discrepancy is that JEOL is not using the NIST table as a starting point.
« Last Edit: July 02, 2015, 08:47:18 AM by John Donovan »
John J. Donovan, Pres. 
(541) 343-3400

"Not Absolutely Certain, Yet Reliable"

John Donovan

  • Administrator
  • Emeritus
  • *****
  • Posts: 3265
  • Other duties as assigned...
    • Probe Software
Re: Searchable Excel L-value table
« Reply #2 on: July 02, 2015, 11:06:49 AM »
I got distracted and wrote a Excel spreadsheet - using the NIST database from calczaf...

Hi Ben,
Feel free to also post (attach) the .xlsm file. That is the Excel file that contains the actual macro code.
john
John J. Donovan, Pres. 
(541) 343-3400

"Not Absolutely Certain, Yet Reliable"

Ben Buse

  • Professor
  • ****
  • Posts: 488
Re: Searchable Excel L-value table
« Reply #3 on: November 25, 2016, 12:23:54 PM »
I just realised a better way of doing the same thing. I just discovered excel can filter tables.

Using the filter function you can specify the element of interest, or L-value range etc...

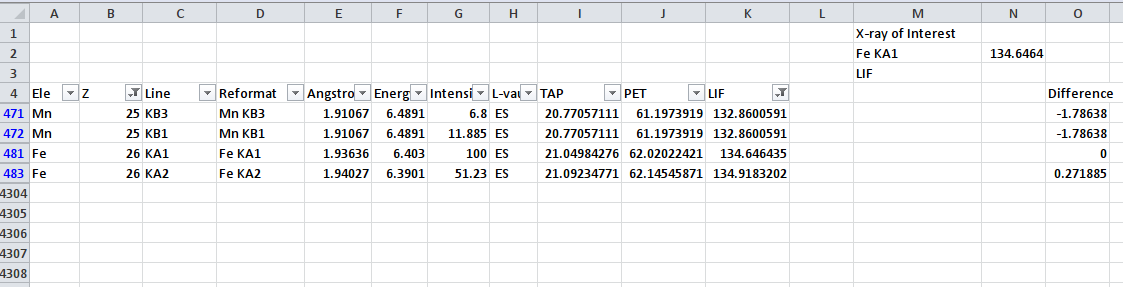
In the screen shot attached I have a filter for LIF between 124-144 mm. AND Z bettween 5-26.

I've also added a field where you specify x-ray of interest (Fe Ka1) and xtal (LIF) [the green box] - and it calculates the difference in L-value between interfering element and the element of interest

Ben

Just updated "Lvale Table complete.xlsx" complete table from calczaf and LDE's


« Last Edit: April 14, 2020, 12:18:57 PM by John Donovan »

Ben Buse

  • Professor
  • ****
  • Posts: 488
Re: Searchable Excel L-value table
« Reply #4 on: December 06, 2016, 02:54:43 AM »
Modify spreadsheet to include all lines (not just intensity >1%).

This has all >0.1%. Excited by 25kV beam. Between 0.5 and 90 Angstrom. All higher orders upto XX.