Author Topic: Ti in Quartz (without PFE)  (Read 6620 times)

KVenance

  • Graduate
  • **
  • Posts: 5
Ti in Quartz (without PFE)
« on: June 09, 2015, 02:21:44 PM »
I am looking to try the Ti in quartz application, however, it is not possible to model the background as a curve with the JEOL software (nor can it handle aggregate spectrometer counts). So if I am to use only one spectrometer with a LPET and linear background, can I expect this to give useful results, given that I will acquire a high resolution wavescan over the Ti Ka peak and choose the best bkgs for that xtal and the conditions of 20kV, 200nA and 20um?
 
And with respect to standards and reference materials:  For Ti, I was thinking of using a synthetic rutile. Is that sufficient or do you recommend something else? 
Thanks,
Katherine


Probeman

  • Emeritus
  • *****
  • Posts: 2823
  • Never sleeps...
    • John Donovan
Re: Ti in Quartz (without PFE)
« Reply #1 on: June 09, 2015, 03:10:33 PM »
I am looking to try the Ti in quartz application, however, it is not possible to model the background as a curve with the JEOL software (nor can it handle aggregate spectrometer counts). So if I am to use only one spectrometer with a LPET and linear background, can I expect this to give useful results, given that I will acquire a high resolution wavescan over the Ti Ka peak and choose the best bkgs for that xtal and the conditions of 20kV, 200nA and 20um?

Hi Katherine,
Is your Sx50 down?  Many of these features are even in my v. 9 software.  But if you have to run using the JEOL software, you don't need to worry about the curved background for Ti Ka, just for Al Ka (due to the tail of the Si peak).

You'll definitely want to use a large area PET crystal if you are limited to one spectrometer.  The conditions are reasonable, I counted for several hundreds of seconds on and off-peak for my paper.
 
And with respect to standards and reference materials:  For Ti, I was thinking of using a synthetic rutile. Is that sufficient or do you recommend something else? 
Thanks,
Katherine

For trace elements, the choice of standard is not important. You could use Ti metal or TiO2.  The critical calibration is the background.  For testing that you'll want to obtain a quartz standard with a zero or known non-zero Ti characterization.  I have a synthetic quartz with 1.42 PPM Ti.  But even SiO2 glass will work if it is pure enough or has been characterized for Ti.  See this topic for more info:

http://probesoftware.com/smf/index.php?topic=130.0

The blank correction uses a standard SiO2 measured as an unknown to correct errors in the background measurement (e.g., holes in the continuum).
john
« Last Edit: June 09, 2015, 03:19:24 PM by Probeman »
The only stupid question is the one not asked!

Probeman

  • Emeritus
  • *****
  • Posts: 2823
  • Never sleeps...
    • John Donovan
Re: Ti in Quartz (without PFE)
« Reply #2 on: March 19, 2019, 12:08:48 PM »
Attached below is a recent paper that looks at Ti and Al trace element measurements in quartz.

The authors did a good job covering the several issues affecting accuracy for this analytical situation (e.g., beam damage, TDI effects), and confirmed other issues covered in prior work (background artifacts, secondary fluorescence effects). I can confirm that using a 20 um beam the beam damage effects on Al and Ti are negligible as seen here for the alternating on/off, on-peak only intensities:


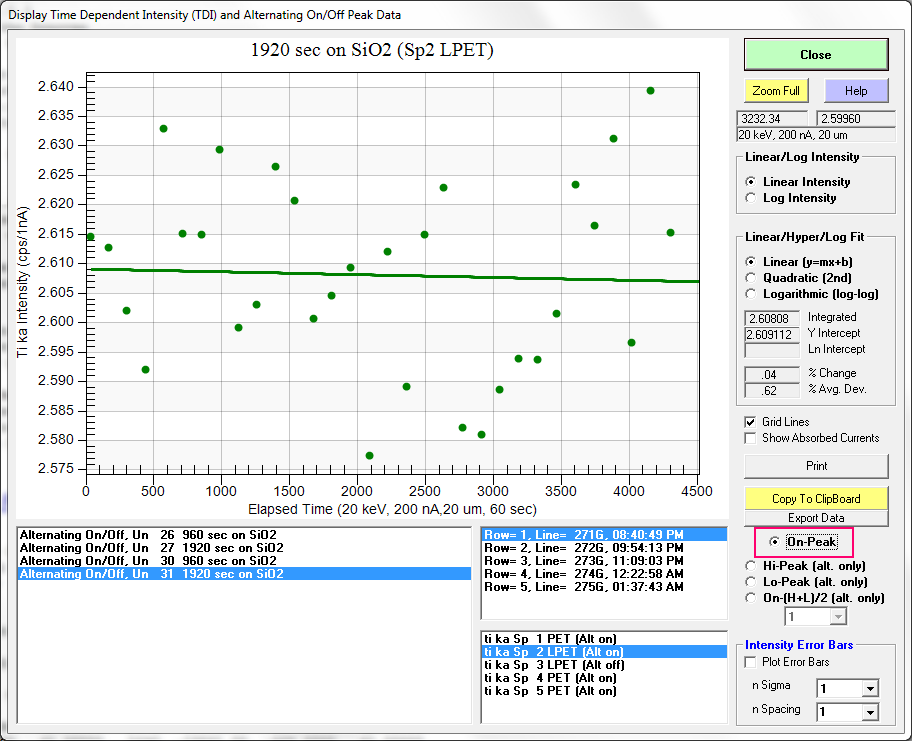
and here for the alternating on/off, on minus off peak intensities:


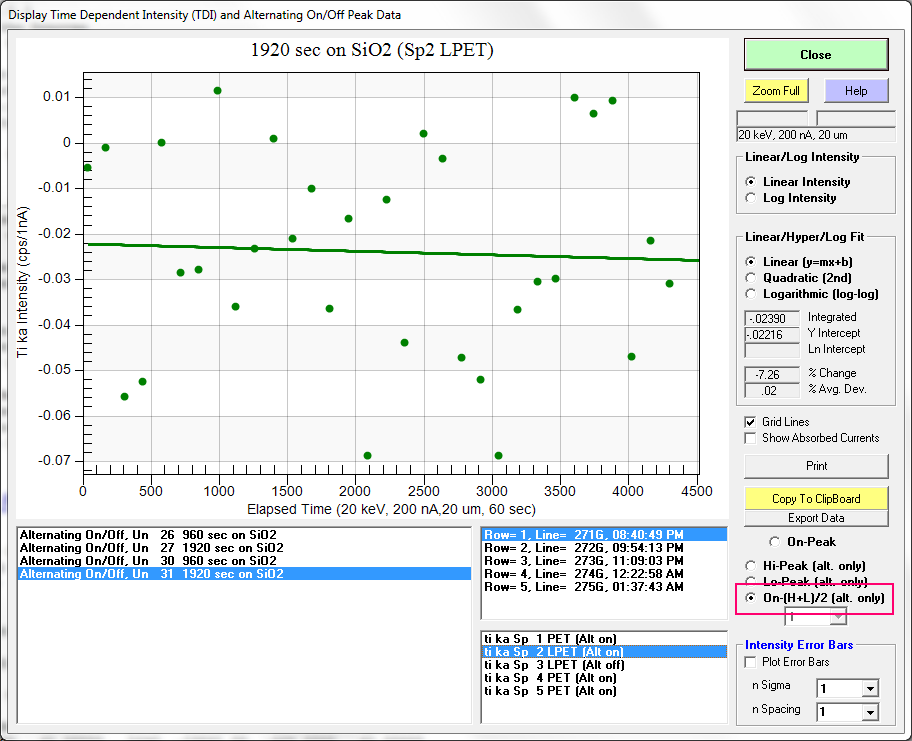
The main difference being that the variance increases when the off-peak background correction is applied as expected since the variances add in quadrature.  In fact their data (fig 4) indicates that beam diameters as small as 5 um are totally suitable for quartz, even at 500nA of beam current!

It was also interesting that they did not observe a "hole" in the continuum on their PETJ crystal (note also the unfortunate typo on page 2 where they mention Ti Ka TAP), and since the presence of this continuum artifact may depend on the mounting orientation of the PET crystal during manufacturing, they may have gotten lucky. However I suspect this was because they did not acquire a sensitive enough wavelength scan. They utilized only 5 sec per point in fig 2, but we utilized 300 sec per point as seen here:


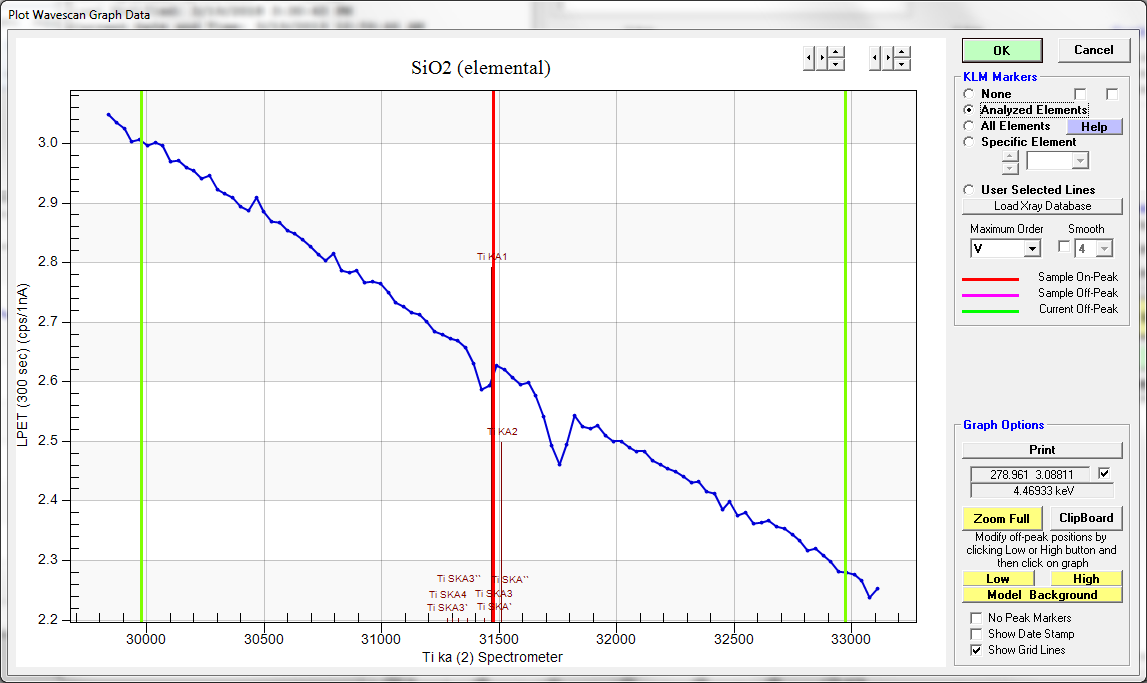
It would be interesting obtain additional high precision Ti Ka PET scans from other labs to see how often this hole in the continuum appears. I note that the hole is visible in both of my LPET crystals, but not in any of the normal sized PET crystals.  Could this artifact be related to Bragg crystal size?  Can anyone share additional observations on this question?

However, they made an interesting claim that "The use of blank corrections is not often possible due to the lack of suitable blank samples in most laboratories."  I find this a little strange since it is trivially easy to obtain ultra pure SiO2 these days, for example Karsten Goemann utilizes the Spectrosil glass material for a blank:

https://probesoftware.com/smf/index.php?topic=130.0

The point being that if you don't measure a blank when performing trace element analysis it is not easy to know one's accuracy.  Yes, one may not have available a suitable matrix matched blank for monazite trace analysis, but for quartz that is not the problem.
The only stupid question is the one not asked!

Probeman

  • Emeritus
  • *****
  • Posts: 2823
  • Never sleeps...
    • John Donovan
Re: Ti in Quartz (without PFE)
« Reply #3 on: March 19, 2019, 03:50:24 PM »
Here's fig 4 from the Cui et al (2018) M&M paper attached in the previous post:


showing TDI effects for a 500nA beam from 0 um to 20 um.  Only the 0, 1 and 2 um beam sizes show significant changes in intensity over time. What I find quite interesting is that the intensities at first decrease over time (~300 sec), but then increase back up after another 300 sec or so.

I've seen almost every type of trend in TDI plots so this could be quite real, but I have to wonder if the beam or stage could have drifted slightly over time with these very focused beam spots, and then eventually started hitting some undamaged areas around the original beam incident spot causing an apparent increase in intensity after the initial decrease in intensity.

Has anyone made similar measurements that they can speak to?
The only stupid question is the one not asked!

BenjaminWade

  • Professor
  • ****
  • Posts: 199
Re: Ti in Quartz (without PFE)
« Reply #4 on: March 19, 2019, 10:52:18 PM »
Hi John
I don't have any for 0 or 1 um or beam currents that high, but some measurements at 2um and 200nA. My alternating On/Off peak number is a lot coarser than in the documented study though so hard to compare. Also my total counting was for more than double the time. On a gross scale though all of my analyses at 2um display and initial sharp decrease in the first couple of minutes followed by a flattening out/slow decline. Some examples below of On-Peak and corresponding -bkgd.


« Last Edit: April 13, 2020, 08:43:00 PM by BenjaminWade »

Probeman

  • Emeritus
  • *****
  • Posts: 2823
  • Never sleeps...
    • John Donovan
Re: Ti in Quartz (without PFE)
« Reply #5 on: March 20, 2019, 12:32:10 PM »
Hi Ben,
This is interesting that you did not see the decrease, then increase in Ti intensities that the Cui et al. (2018) paper reported.  And your measurements were over a longer time span.  Your results seem more intuitive to me that sample damage would decrease intensities over time and level off eventually. This makes me suspect that they were actually observing beam or stage drift into undamaged adjacent areas of the sample.

Can you also report the blank levels that you obtained for your PET and LPET crystals?  I'm curious if the "holes" in the continuum are related to crystal size or something else.
The only stupid question is the one not asked!

BenjaminWade

  • Professor
  • ****
  • Posts: 199
Re: Ti in Quartz (without PFE)
« Reply #6 on: March 20, 2019, 09:53:22 PM »
Hi John
Here are wavescans done on my Spectrosil glass at 200nA/300s count time per point. If the holes are there they are not obvious.


With regards to the actual analyses at the time, here are some screen captures of a presentation I gave at the time, of my analyses on my Spectrosil Glass #3 (3.94+/-0.33PPM Ti - LA-ICPMS):

Data with no blank correction or aggregation


Data WITH blank correction using a different Spectrosil Glass, and NO aggregation


Data WITH blank correction and aggregation


Perhaps one could argue that its circular using a Spectrosil glass to blank correct a different spectrosil glass (despite them having different Ti concentrations). I didn't have the Hot Springs quartz at the time so should repeat the experiment. I did analyse some other real samples which had Ti concs down to 10ppm or so which matched well with subsequent LA-ICP-MS studies on it.
« Last Edit: April 13, 2020, 09:10:17 PM by BenjaminWade »

Probeman

  • Emeritus
  • *****
  • Posts: 2823
  • Never sleeps...
    • John Donovan
Re: Ti in Quartz (without PFE)
« Reply #7 on: March 21, 2019, 09:29:11 AM »
Hi Ben,
All I wanted to see was this line below from the log window output (highlighted in red):

ELEM:       Ti      Ti      Ti      Ti      Ti      Si       O   SUM 
XRAY:     (ka)    (ka)    (ka)    (ka)    (ka)      ()      ()
   271 -.00003  .00039  .00003 -.00006  .00051 46.7430 53.2576 100.001
   272  .00010  .00039  .00022 -.00036 -.00030 46.7430 53.2570 100.000
   273  .00003  .00037  .00008  .00007  .00048 46.7430 53.2577 100.002
   274  .00002  .00016  .00015 -.00005  .00009 46.7430 53.2572 100.001
   275 -.00010  .00019 -.00002  .00016  .00009 46.7430 53.2572 100.001

AVER:   .00000  .00030  .00009 -.00005  .00017  46.743  53.257 100.001
SDEV:   .00007  .00011  .00010  .00020  .00034    .000    .000  .00067
SERR:   .00003  .00005  .00004  .00009  .00015  .00000  .00012
%RSD:  4057.70 37.3350 103.073 -404.32 193.525  .00000  .00050
STDS:      922     922     922     922     922     ---     ---

STKF:    .5621   .5621   .5621   .5621   .5621     ---     ---
STCT:   667.34 1600.07 1901.70  531.93  828.32     ---     ---

UNKF:    .0000   .0000   .0000   .0000   .0000     ---     ---
UNCT:      .00     .01     .00     .00     .00     ---     ---
UNBG:      .99    2.63    3.41     .79    1.38     ---     ---

ZCOR:   1.1969  1.1969  1.1969  1.1969  1.1969     ---     ---
KRAW:   .00000  .00000  .00000  .00000  .00000     ---     ---
PKBG:  1.00002 1.00271 1.00077  .99951 1.00155     ---     ---
BLNK#:      27      27      27      27      27     ---     ---
BLNKL: .000142 .000142 .000142 .000142 .000142     ---     ---
BLNKV: .000000 -.00125 -.00272 .000689 -.00040     ---     ---

The "blank level" indicates the size of the blank correction relative to the specified blank value in the blank standard (usually zero for a pure synthetic SiO2 glass such as Spectrosil, but is 0.000142 (1.42 PPM) in my synthetic quartz from ICP-MS). For those that haven't utilized the blank correction in Probe for EPMA, the blank standard is run as an unknown to keep the conditions the same as your other unknowns.

So looking at the last line we have for my 5 spectrometers:

ELEM:    ti ka   ti ka   ti ka   ti ka   ti ka   BEAM1
BGD:       OFF     OFF     OFF     OFF     OFF
SPEC:        1       2       3       4       5
CRYST:     PET    LPET    LPET     PET     PET

BLNKV: .000000 -.00125 -.00272 .000689 -.00040     ---     ---

Or in PPM:

BLNKV:       0   -12.5   -27.2    6.89      -4     ---     ---

So the three normal sized crystals have blank corrections in the zero to 7 PPM range while the two large area crystals have *negative* blank corrections of 12.5 and 27.2 PPM.  These negative blank corrections are due to the "holes" in the continuum that I only see in my two large area LPET crystals.

You said you only used a wavescan counting time of 30 seconds (at 200nA?), so you would definitely have trouble seeing the blank corrections in the range of a few PPM as you showed in your presentation slides.

Please post the BLNKV: line from the log output and then we'll be comparing apples to apples.
The only stupid question is the one not asked!

Shui-Yuan Yang

  • Student
  • *
  • Posts: 2
Re: Ti in Quartz (without PFE)
« Reply #8 on: March 23, 2019, 08:53:57 AM »
Hi John,
It seems that there are still some shortcomings in our paper, however, I am glad to join the discussion. For a “hole” in the PET crystal, we did some wavescans in other two JEOL EPMA instruments last year, with 3s/step and 0.01mm/step. We found that the hole is visible in large PET crystal, but not obvious in normal PET crystals. It seems that the hole is related to crystal size, or related to the Johanson type crystal or Johan type crystal (I am confused that the JEOL PETJ crystal is a Johanson type or a Johan type). I will repeat the wavescans with long enough dwell times, and also repeat the wavescans in SHIMADZU EPMA instruments (The crystals in SHIMADZU EPMA are all Johanson type).

The wavescans in first JEOL EPMA instrument (the green line is the Ti Ka peak position):


The wavescans in second JEOL EPMA instrument (the green line is the Ti Ka peak position):


For the TDI effects of Ti, based on Ben’s measurements, I now also suspect that we were actually observing beam or stage drift into undamaged adjacent areas of the quartz. However, I am just curious that if that is the case, the Al Ka intensities would at first increase and then decrease, since the TDI of Al and Ti were carried out at the same point and same time. We will repeat the TDI measurements in our lab and other labs.
« Last Edit: March 23, 2019, 08:00:10 PM by Shui-Yuan Yang »

Probeman

  • Emeritus
  • *****
  • Posts: 2823
  • Never sleeps...
    • John Donovan
Re: Ti in Quartz (without PFE)
« Reply #9 on: March 23, 2019, 03:51:38 PM »
Hi Shui-Yuan,
Your paper is excellent, in fact you beat us to publication on the trace element TDI effect. Annette von der Handt and I have been recently writing up this trace element TDI effect, but you got it published first, so good for you!

Also, that is very interesting that you only find the hole in the continuum for Ti Ka with the large area PET crystal. You should post an example when you get a chance. Do you also see two holes, a smaller one right under the peak and another larger one just to the side?  We had to count 300 seconds per wavescan point to see these.
john

Edit: now that I see your in-line images, it does appear that you have two holes possibly. And just as in my scans, the smaller hole is directly under the Ti Ka peak, and the larger hole is to the right as seen here:


« Last Edit: March 23, 2019, 09:48:56 PM by Probeman »
The only stupid question is the one not asked!

Shui-Yuan Yang

  • Student
  • *
  • Posts: 2
Re: Ti in Quartz (without PFE)
« Reply #10 on: March 24, 2019, 12:02:10 AM »
Hi John,
I think it might have two holes for the large PET crystals in our wavescans. We did the wavescans on the quartz from SPI standards. The holes directly under the Ti Ka peak is not obvious possibly due to the "not pure" property of the SPI quartz.

We did the wavescans on a synthetic SiO2 glass and a purified quartz, but we observed the obvious Ti Ka peaks. Finally, we found that the Ti Ka peak of quartz from SPI standards was not obvious and then we did the wavescans on SPI quartz to observe the holes. We will try to get some Spectrosil glass material and repeat the wavescans with longer dwell times.

Probeman

  • Emeritus
  • *****
  • Posts: 2823
  • Never sleeps...
    • John Donovan
Re: Ti in Quartz (without PFE)
« Reply #11 on: March 24, 2019, 09:42:28 AM »
The Spectrosil material is apparently a good blank standard, but if you send me your shipping address to my donovan@uoregon.edu email, I will send you a piece of our synthetic  quartz material that has 1.4 PPM of Ti (from ICP-MS).
john
The only stupid question is the one not asked!

BenjaminWade

  • Professor
  • ****
  • Posts: 199
Re: Ti in Quartz (without PFE)
« Reply #12 on: March 24, 2019, 07:53:42 PM »
Hi John
My apologies I misunderstood. Here are my values:

              LPET(LP)        PET       LPET(HP)      LPET(LP)     LPET(HP)
BLNKL:    .000470     .000470    .000470       .000470      .000470
BLNKV:    .000093    .000135     -.00019       .000238       .000015

There is no obvious correlation between small vs large xtal and negative blank correction.
My spectrosil quartz isn't as pure as your synthetic quartz material (4.7 ppm). The analyses were done on another spectrosil sample (3.9ppm), so I am not sure how much of an effect using a blank standard which has more Ti in it than the sample you are analysing would have?

Cheers

Probeman

  • Emeritus
  • *****
  • Posts: 2823
  • Never sleeps...
    • John Donovan
Re: Ti in Quartz (without PFE)
« Reply #13 on: March 25, 2019, 11:13:37 AM »

              LPET(LP)        PET       LPET(HP)      LPET(LP)     LPET(HP)
BLNKL:    .000470     .000470    .000470       .000470      .000470
BLNKV:    .000093    .000135     -.00019       .000238       .000015

There is no obvious correlation between small vs large xtal and negative blank correction.

Hi Ben,
Very interesting! You just had to complicate the nice story we had there for a while!    ;)

So maybe it is just related to the mounting orientation of the PET crystals and you got very lucky. Or since you have a newer probe maybe Cameca is now mounting their PET crystals to avoid this hole in the continuum under the Ti Ka peak in one orientation versus the other?

My spectrosil quartz isn't as pure as your synthetic quartz material (4.7 ppm). The analyses were done on another spectrosil sample (3.9ppm), so I am not sure how much of an effect using a blank standard which has more Ti in it than the sample you are analysing would have?

Well, ideally ones blank standard should be below detection limit for best accuracy, but the blank correction can handle non-zero blanks just fine.
john
The only stupid question is the one not asked!

BenjaminWade

  • Professor
  • ****
  • Posts: 199
Re: Ti in Quartz (without PFE)
« Reply #14 on: March 25, 2019, 09:51:15 PM »
Hi John
I will attempt to get some long count time wavescans later this weekend on all 5 PETs and post what I find...

cheers