Author Topic: Assessing Accuracy in CalcZAF  (Read 7723 times)

Probeman

  • Emeritus
  • *****
  • Posts: 2856
  • Never sleeps...
    • John Donovan
Assessing Accuracy in CalcZAF
« on: May 24, 2015, 06:27:28 PM »
As we all know, precision is quite easy to estimate (just make some replicate measurements!), but ascertaining accuracy is more difficult and usually requires the analysis of so called "secondary" standards. These secondary standards can be any composition with a known (or zero) concentration of the element(s) of interest, but ideally they are similar in matrix (concentrations) to the unknown composition, and not assigned as a primary standard to the element(s) in question.

Evaluating accuracy for such secondary standards in Probe for EPMA is quite straight forward, since Probe for EPMA can "analyze" standards as though they were unknowns.  By this I mean PFE automatically adds in elements not analyzed for (but present in the standard composition) to all standard sample acquisitions, so that the matrix correction can be calculated properly and then compared to the "published" values for that (secondary) standard as seen here:

St  305 Set   1 Labradorite (Lake Co.), Results in Elemental Weight Percents
 
ELEM:       Na      Si       K      Al      Mg      Fe      Ca      Mn      Ti       O       H
TYPE:     ANAL    ANAL    ANAL    ANAL    ANAL    ANAL    ANAL    ANAL    ANAL    SPEC    SPEC
BGDS:      LIN     LIN     LIN     MAN     LIN     MAN     LIN     LIN     LIN
TIME:    30.00   30.00   20.00   30.00   30.00   30.00   30.00   20.00   30.00     ---     ---
BEAM:    30.17   30.17   30.17   30.17   30.17   30.17   30.17   30.17   30.17     ---     ---

ELEM:       Na      Si       K      Al      Mg      Fe      Ca      Mn      Ti       O       H   SUM 
    13   2.847  24.582    .112  16.343    .083    .347   9.520    .001    .026  46.823    .000 100.683
    14   2.833  23.624    .101  16.355    .086    .314   9.544   -.003    .037  46.823    .000  99.714
    15   2.842  23.794    .108  16.371    .078    .311   9.444    .007   -.001  46.823    .000  99.778

AVER:    2.841  24.000    .107  16.356    .082    .324   9.503    .002    .021  46.823    .000 100.058
SDEV:     .007    .511    .006    .014    .004    .020    .052    .005    .019    .000    .000    .542
SERR:     .004    .295    .003    .008    .002    .011    .030    .003    .011    .000    .000
%RSD:      .25    2.13    5.22     .09    5.15    6.08     .55  306.38   92.79     .00     .00

PUBL:    2.841  23.957    .100  16.359    .084    .319   9.577    .000    n.a.  46.823    .000 100.060
%VAR:   (-.01)     .18    6.95  (-.02)   -2.28    1.60    -.78     .00     ---     .00     .00
DIFF:    (.00)    .043    .007   (.00)   -.002    .005   -.074    .000     ---    .000    .000
STDS:      305     358     374     305      12     395     358      25      22     ---     ---


In the above example this labradorite standard (#305) is the primary (assigned) standard for Na and Al and is a secondary standard for the remaining  elements. The line labled AVER: is the acquired analysis for the standard, the line labeled PUBL: is the expected analysis from the standard composition database and the line labeled %VAR is the relative percent error from the published  concentration value.

Immediately it is evident that Si measured in labradorite (std #305), relative to diopside (std #358), is accurate to around several tenths of a percent, and Ca in labradorite relative to diopside again is accurate to better than a percent relative. The remaining minor and trace elements can also be examined to ascertain the ability to measure low (or zero) concentrations with his setup.

In CalcZAF, every sample is considered an unknown, so determining accuracy is slightly more work, but that simply means that one must import the analysis of a secondary standard and compare the results to the expected concentrations.

We might call this method of determining accuracy by using secondary standards an "external" method since we are checking ourselves using an external (secondary) standard. But there is another way to estimate accuracy, though secondary standards should always be acquired if at all possible!

I'll call this other accuracy assessment method an "internal" method, since we will be relying not on secondary standards, but on multiple matrix corrections. This is reason that John Armstrong called his off-line analysis program TRYZAF. Using it, one can "try" many different matrix corrections on the same dataset.  This also true for CalcZAF.

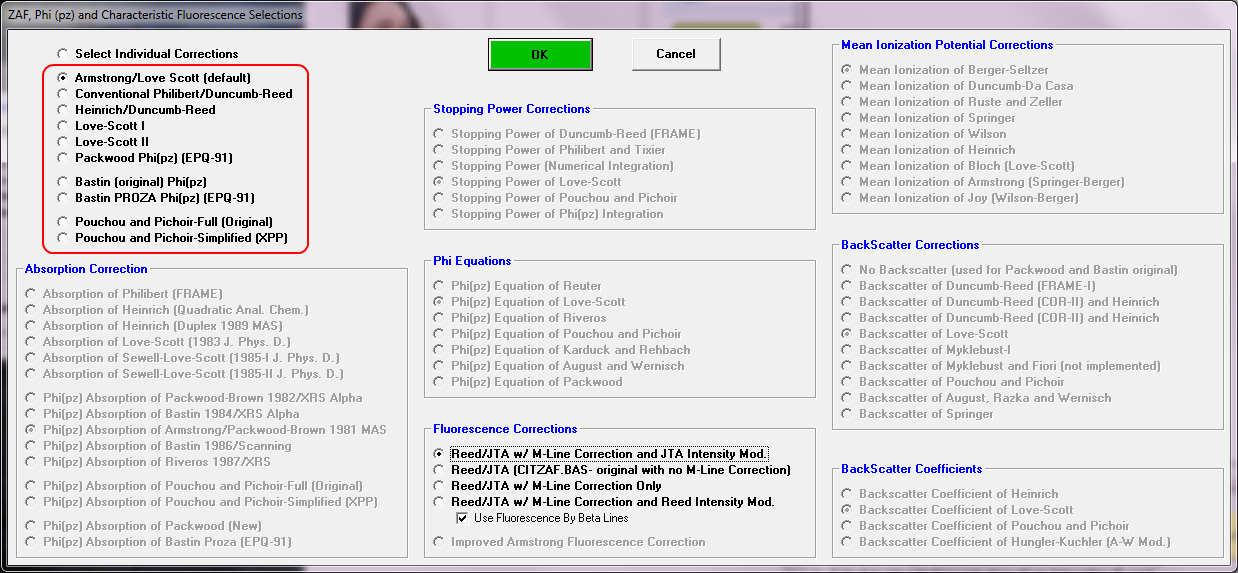
Of course we might hope that these multiple matrix correction methods will always give the same answer, but of course they don't (that's science for you!).  In any case, by "internal" I simply mean we can analyze the unknown composition using a number of matrix corrections methods that are available in TryZAF, CalcZAF (and PFE of course) as seen here:


For example here is the previous labradorite (#305) composition exported from PFE and analyzed using CalcZAF with the Use All Matrix Corrections checkbox checked:


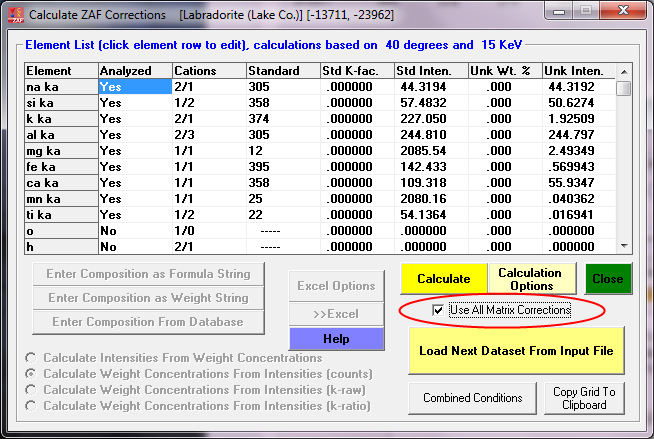
After clicking the Calculate button, we wait for the app to cycle through all 10 matrix corrections (of course all these matrix correction methods are utilizing the same mass absorption coefficient (MAC) table, so that is another parameter that can be tested. CalcZAF (and PFE) can utilize 5 different MAC tables.

Summary of All Calculated (averaged) Matrix Corrections:
Labradorite (Lake Co.)
LINEMU   Henke (LBL, 1985) < 10KeV / CITZMU > 10KeV

Elemental Weight Percents:
ELEM:       Na      Si       K      Al      Mg      Fe      Ca      Mn      Ti       O       H   TOTAL
     1   2.841  24.002    .107  16.356    .082    .324   9.502    .002    .021  46.823    .000 100.060   Armstrong/Love Scott (default)
     2   2.840  24.109    .107  16.353    .081    .331   9.519    .002    .021  46.823    .000 100.186   Conventional Philibert/Duncumb-Reed
     3   2.840  24.036    .107  16.354    .082    .319   9.498    .002    .021  46.823    .000 100.082   Heinrich/Duncumb-Reed
     4   2.840  24.057    .107  16.354    .082    .324   9.505    .002    .021  46.823    .000 100.115   Love-Scott I
     5   2.841  24.006    .107  16.356    .082    .324   9.504    .002    .021  46.823    .000 100.065   Love-Scott II
     6   2.840  24.089    .107  16.353    .080    .329   9.532    .002    .021  46.823    .000 100.176   Packwood Phi(pz) (EPQ-91)
     7   2.838  24.316    .107  16.340    .082    .322   9.620    .002    .020  46.823    .000 100.470   Bastin (original) Phi(pz)
     8   2.842  23.871    .107  16.362    .080    .329   9.510    .002    .021  46.823    .000  99.947   Bastin PROZA Phi(pz) (EPQ-91)
     9   2.839  24.147    .107  16.350    .082    .330   9.525    .002    .021  46.823    .000 100.226   Pouchou and Pichoir-Full (Original)
    10   2.840  24.116    .107  16.352    .082    .330   9.529    .002    .021  46.823    .000 100.201   Pouchou and Pichoir-Simplified (XPP)

AVER:    2.840  24.075    .107  16.353    .082    .326   9.524    .002    .021  46.823    .000 100.153
SDEV:     .001    .115    .000    .005    .001    .004    .036    .000    .000    .000    .000    .139
SERR:     .000    .036    .000    .002    .000    .001    .011    .000    .000    .000    .000

MIN:     2.838  23.871    .107  16.340    .080    .319   9.498    .002    .020  46.823    .000  99.947
MAX:     2.842  24.316    .107  16.362    .082    .331   9.620    .002    .021  46.823    .000 100.470


For this particular example, the variance of the 10 matrix correction methods is quite small, so if we are having accuracy issues it is not due to the matrix correction method selected!

However, other compositions will yield quite different results for the different matrix correction methods as seen here:

Summary of All Calculated (averaged) Matrix Corrections:
St   20 Set   1 ThSiO4 (Huttonite)
LINEMU   Henke (LBL, 1985) < 10KeV / CITZMU > 10KeV

Elemental Weight Percents:
ELEM:       Si      Zr      Th       O   TOTAL
     1   9.191   -.069  70.784  19.746  99.652   Armstrong/Love Scott (default)
     2   7.713   -.062  71.150  19.746  98.546   Conventional Philibert/Duncumb-Reed
     3   8.634   -.065  71.467  19.746  99.782   Heinrich/Duncumb-Reed
     4   8.334   -.064  71.395  19.746  99.410   Love-Scott I
     5   8.370   -.064  71.400  19.746  99.452   Love-Scott II
     6   7.253   -.059  71.034  19.746  97.973   Packwood Phi(pz) (EPQ-91)
     7   9.212   -.069  71.556  19.746 100.444   Bastin (original) Phi(pz)
     8   8.779   -.066  71.501  19.746  99.958   Bastin PROZA Phi(pz) (EPQ-91)
     9   8.365   -.065  71.396  19.746  99.442   Pouchou and Pichoir-Full (Original)
    10   8.170   -.063  71.344  19.746  99.196   Pouchou and Pichoir-Simplified (XPP)

AVER:    8.402   -.065  71.303  19.746  99.385
SDEV:     .608    .003    .241    .000    .701
SERR:     .192    .001    .076    .000

MIN:     7.253   -.069  70.784  19.746  97.973
MAX:     9.212   -.059  71.556  19.746 100.444


Now someone might ask: OK, which matrix correction method is correct? And the answer of course is "why all of them"!  At least that is what their authors will claim! 

But in fact we know (or should know!), that some matrix corrections perform better for large absorption corrections, some matrix corrections work well for large atomic number differences, etc, etc etc... but none are "universal" yet!

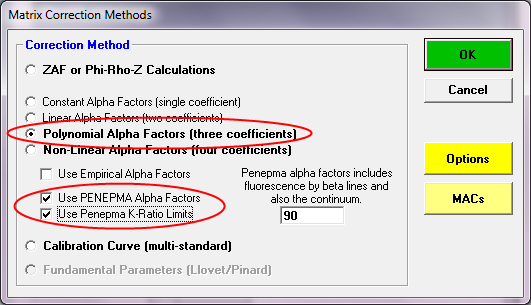
But if I wanted to hedge my bets, I would certainly utilize the Penepma alpha factor correction method.  It's as good as our our current understanding of the electron solid physics involved.  To run your analyses using Penepma, simply select the polynomial or non-linear alpha fit method and then check the Penepma boxes as seen here:


The results from the Penepma alpha factor method is seen here:

ELEMENT    si ka   zr la   th ma      O    Total
UNK KRAT   .0684  -.0005   .6500
UNK WT%    9.088   -.065  71.585  19.746 100.354
UNK AT%   17.346   -.038  16.538  66.155 100.000
UNK BETA  1.3291  1.2013  1.1014
ALPITER   5.0000


This compares well to the ideal composition for ThSiO4:

ELEM:       Si      Zr      Th   SUM 
PUBL:    8.665    n.a.  71.589 100.000
« Last Edit: May 25, 2015, 09:11:18 AM by Probeman »
The only stupid question is the one not asked!

Thomas

  • Graduate
  • **
  • Posts: 8
calculation of matrix correction ZAF factors of standards
« Reply #1 on: May 12, 2020, 11:27:09 AM »
Dear Dr. Donovan,
I have successfully used the free-ware CALZAF to model the impact of distinct matrix correction programs and MAC tables on specific EPMA results produced in my lab. Now my question:
How and on which basis are the ZAF-factors for the standards are calculated? I am particularly interested in standards that contain "volatile" elements such as N (in BN). It would be helpful for me to get some description or references dealing with this topic.
Best regards and thanks in advance,
Thomas

John Donovan

  • Administrator
  • Emeritus
  • *****
  • Posts: 3304
  • Other duties as assigned...
    • Probe Software
Re: calculation of matrix correction ZAF factors of standards
« Reply #2 on: May 12, 2020, 01:31:03 PM »
Dear Dr. Donovan,
I have successfully used the free-ware CALZAF to model the impact of distinct matrix correction programs and MAC tables on specific EPMA results produced in my lab. Now my question:
How and on which basis are the ZAF-factors for the standards are calculated? I am particularly interested in standards that contain "volatile" elements such as N (in BN). It would be helpful for me to get some description or references dealing with this topic.
Best regards and thanks in advance,
Thomas

Hi Thomas,

Please call me John.  Great questions!  I'll start from the beginning so forgive me if you know any of this already.

The 10 matrix correction methods (and 5 or 6 mass absorption coefficient (MAC) reference tables) in CalcZAF (including several historical ZAF methods, plus a number of modern pr(z) methods) are utilized differently for standards and unknowns. For calculating unknowns we provide the measured (or modeled) background corrected intensities (and takeoff and keV) and CalcZAF calculates the resulting compositions based on the matrix physics in an iterative manner, usually converging rapidly on a final composition (because we don't know the physics until we know the final composition).

But for standard ZAF factors (also known as the standard k-factors, see the PFE Reference manual and click on the Glossary for ZAF for definitions of terms), we instead provide the standard compositions, and CalcZAF calculates the matrix physics using the same equations but essentially running them backwards (non iteratively because we already know the composition and therefore the physics).

So let's take an example of boron nitride, by clicking the Enter Composition as Formula String button and type in "BN" like this:


then click the Calculate button and we get this output for the default Armstrong/Brown pr(z) method:

BN, sample 1
WARNING in ZAFSetZAF- the f(x) of B  ka is    .3887

Current Mass Absorption Coefficients From:
LINEMU   Henke (LBL, 1985) < 10KeV / CITZMU > 10KeV

  Z-LINE   X-RAY Z-ABSOR     MAC
      N       ka      N   1.8125e+03
      N       ka      B   1.5803e+04
      B       ka      N   1.1196e+04
      B       ka      B   3.3340e+03

 ELEMENT  ABSFAC  ZEDFAC  FINFAC STP-POW BKS-COR   F(x)e
   N  ka  1.6872  3.8909  6.5646   .2469   .9608   .5927
   B  ka  2.5725  4.0830 10.5032   .2357   .9625   .3887

SAMPLE: 32767, TOA: 40, ITERATIONS: 0, Z-BAR: 6.128777

 ELEMENT  ABSCOR  FLUCOR  ZEDCOR  ZAFCOR STP-POW BKS-COR   F(x)u      Ec   Eo/Ec    MACs
   N  ka  3.1206  1.0000   .9793  3.0560   .9847   .9945   .1899   .4000 37.5000 7906.92
   B  ka  2.0623   .9992  1.0297  2.1220  1.0203  1.0093   .1885   .1880 79.7872 7771.35

 ELEMENT   K-RAW K-VALUE ELEMWT% OXIDWT% ATOMIC% FORMULA KILOVOL                                       
   N  ka  .00000  .18468  56.439   -----  50.000    .500   15.00                                       
   B  ka  .00000  .20528  43.561   -----  50.000    .500   15.00                                       
   TOTAL:                100.000   ----- 100.000   1.000

The column marked "K-RAW" is of course all zeros because we provided no measured intensities, just the compositions. However, the column marked "K-VALUE" is the elemental k-ratios for those elements in that composition for those conditions, while the ZAFCOR values are the matrix corrections utilized in the standard k-factor. Again see the PFE Reference manual glossary for the equations that put these all together. Look for std-k-factor, k-ratio and ZAF definitions.

Also I don't quite see how nitrogen in BN is a "volatile" element, this material is quite refractory usually. But as for evaluating the different matrix corrections, you should definitely utilize the Use All Matrix Corrections checkbox as described in the first post in this topic.  Also note that emissions such as boron and nitrogen are *very* dependent on the MACs. You should investigate the use of empirical MACs (see the Empirical MACs in the CalcZAF Analyutical menu), and also read about the use of empirical area peak factors (APFs) which handle the effect of chemical states on these low energy emissions.  The PFE Reference manual contains this information.

A good topic on analyzing these light elements is also found here:

https://probesoftware.com/smf/index.php?topic=536.0

Please let me know if you have further questions.
« Last Edit: May 12, 2020, 01:34:00 PM by John Donovan »
John J. Donovan, Pres. 
(541) 343-3400

"Not Absolutely Certain, Yet Reliable"

Thomas

  • Graduate
  • **
  • Posts: 8
Re: Assessing Accuracy in CalcZAF
« Reply #3 on: May 13, 2020, 10:06:32 AM »
Hi John,
thanks a lot for your prompt reply and very helpful comments! I already had a look on the glossary and I will continue to perform the calculation you suggested.
Of course, I did not mean that N in BN is volatile :). I thought that the std-k factors are based on pure elements (and nitrogen is a gas). My confusion is caused by the observation that I got unrealistic high Z-factors of up to 28 for N in the BN standard in my lab while these Z factors are generally about 1 in the calculations made by using CALCZAF.
Best regards,
Thomas

John Donovan

  • Administrator
  • Emeritus
  • *****
  • Posts: 3304
  • Other duties as assigned...
    • Probe Software
Re: Assessing Accuracy in CalcZAF
« Reply #4 on: May 13, 2020, 10:30:57 AM »
Ah, OK.  But remember, in EPMA, so long as the distance is such that the electrons come to rest (e.g., an "infinitely" thick specimen), the density of the unknown (or standard) does not matter.  The physics all works out just fine (the only place where density matters in EPMA is with "thin" samples, where a geometric correction must be applied along with the matrix correction, because some electrons are transmitted through the thin sample and therefore do not contribute to the measured sample signal).

When you say "unrealistic high Z-factors of up to 28 for N in the BN standard in my lab" are you referring to the std k-factors or the ZAF matrix factors? As you see from the previous output:

ELEMENT  ABSCOR  FLUCOR  ZEDCOR  ZAFCOR STP-POW BKS-COR   F(x)u      Ec   Eo/Ec    MACs
   N  ka  3.1206  1.0000   .9793  3.0560   .9847   .9945   .1899   .4000 37.5000 7906.92
   B  ka  2.0623   .9992  1.0297  2.1220  1.0203  1.0093   .1885   .1880 79.7872 7771.35


the ZAF matrix factors for B and N Ka in BN are 2.1 and 3 respectively.  This is because in BN each contains significant concentrations of themselves and the ZAF factor for pure elements is always 1.0.

Again, although we are calling these "ZAF" factors, these factors are calculated using the Armstrong/Brown pr(z) method. Here is the same calculation using the PAP pr(z) method:

BN, sample 1
WARNING in ZAFSetZAF- the f(x) of B  ka is    .3556

Current Mass Absorption Coefficients From:
LINEMU   Henke (LBL, 1985) < 10KeV / CITZMU > 10KeV

  Z-LINE   X-RAY Z-ABSOR     MAC
      N       ka      N   1.8125e+03
      N       ka      B   1.5803e+04
      B       ka      N   1.1196e+04
      B       ka      B   3.3340e+03

 ELEMENT  ABSFAC  ZEDFAC  FINFAC STP-POW BKS-COR   F(x)e
   N  ka  1.7572   .0407   .0715 23.5957   .9599   .5691
   B  ka  2.8123   .0660   .1857 14.7226   .9724   .3556

SAMPLE: 32767, TOA: 40, ITERATIONS: 0, Z-BAR: 6.128777

 ELEMENT  ABSCOR  FLUCOR  ZEDCOR  ZAFCOR STP-POW BKS-COR   F(x)u      Ec   Eo/Ec    MACs
   N  ka  3.5450  1.0000   .9958  3.5301  1.0022   .9936   .1605   .4000 37.5000 7906.92
   B  ka  2.2589   .9992  1.0026  2.2631   .9950  1.0077   .1574   .1880 79.7872 7771.35

 ELEMENT   K-RAW K-VALUE ELEMWT% OXIDWT% ATOMIC% FORMULA KILOVOL                                       
   N  ka  .00000  .15988  56.439   -----  50.000    .500   15.00                                       
   B  ka  .00000  .19248  43.561   -----  50.000    .500   15.00                                       
   TOTAL:                100.000   ----- 100.000   1.000

So, as one can see, these factors do vary from one matrix correction method to another, especially for these low energy emissions (because the absorption correction terms are so large)!

Please feel free to share some of your CalcZAF calculations with us.
« Last Edit: May 13, 2020, 11:33:31 AM by John Donovan »
John J. Donovan, Pres. 
(541) 343-3400

"Not Absolutely Certain, Yet Reliable"

Thomas

  • Graduate
  • **
  • Posts: 8
Re: Assessing Accuracy in CalcZAF
« Reply #5 on: May 18, 2020, 11:42:55 AM »
Hi John,
sorry for the delay but I was out of office, and thanks for your explanation.
I mean the N ZAFCOR values for the BN standard which are unusually high at my microprobe, and this is also resulting in very high ZAF-values. Of course, I already used all the correction procedures available in CALCZAF but I generally got values in the same order that you mentioned. So, what may be the reason for these "anomalies"?
Best regards,
Thomas

John Donovan

  • Administrator
  • Emeritus
  • *****
  • Posts: 3304
  • Other duties as assigned...
    • Probe Software
Re: Assessing Accuracy in CalcZAF
« Reply #6 on: May 18, 2020, 12:33:30 PM »
Hi Thomas,
No worries.

When you say "are unusually high at my microprobe" I assume you mean the JEOL or Cameca software is giving you much larger matrix correction factors for N Ka in BN (than those you obtain from CalcZAF)?

What MAC value for N Ka in B is being utilized? Can you provide us with an example of these "unusually high" matrix factors?
« Last Edit: May 18, 2020, 12:48:58 PM by John Donovan »
John J. Donovan, Pres. 
(541) 343-3400

"Not Absolutely Certain, Yet Reliable"

Thomas

  • Graduate
  • **
  • Posts: 8
Re: Assessing Accuracy in CalcZAF
« Reply #7 on: May 19, 2020, 07:02:13 AM »
Hi John,
attached you will find one analysis of BN (as unknown). The MAC of N should be that of the LINEMU data base...
Best regards,
Thomas


John Donovan

  • Administrator
  • Emeritus
  • *****
  • Posts: 3304
  • Other duties as assigned...
    • Probe Software
Re: Assessing Accuracy in CalcZAF
« Reply #8 on: May 19, 2020, 08:54:16 AM »
Hi Thomas,
Someone more familiar with the JEOL quantitative output will have to comment on this example, because I have never used the JEOL software for quantification (here is what Thomas attached in the previous post, the "ZAF factors" in red I think are the "unusually high" values he is talking about):

Asynchronous Mode.


*******************************************************************************
UNK No. =    2  ./Labor/BN_test  dated Sun Apr 26 01:09:20 2020
2 Elements WDS only   X= 14.038  Y= 13.281  Z= 10.252
Acc. Voltage = 10.0 (kV) Probe Dia. =   0 Scan OFF
Probe Current = 3.010E-08 (A)
*******************************************************************************
Channel Element Acm  Peak    Peak cnt sec     BG_L cnt sec     BG_U cnt sec
1 LDEN  N  T    1  110.585    42377.1( 16.0)    1511.3(  8.0)     361.0(  8.0)
1 LDEB  B  T    1  128.873    42055.2( 16.0)     644.1(  8.0)    1889.5(  8.0)
Measurement over
Correction starts

Standard Data
Element   Standard name     Wt.(%)   ZAF Fac.   Z        A        F
 1 N      A_BN              56.4400   9.3141  28.0328   0.3323   1.0000
 2 B      A_BN              43.5600  26.3534  78.5310   0.3356   1.0000

Standard Intensity of WDS
Element  Curr.(A)    Net(cps) Bg-(cps) Bg+(cps)  S.D.(%)  Date
 1 N    3.008E-08     2528.2    189.8     50.6     0.30   Apr 26 01:02 2020
 2 B    3.008E-08     2457.8     76.0    243.9     0.31   Apr 26 01:02 2020


Unknown Specimen No. 2
 Group        : Labor           Sample  : BN_test       
 UNK No.      :    2            Comment : A_BN_2                                   
 Stage        :    X=   14.0383  Y=   13.2815  Z=   10.2525
 Acc. Voltage :    10.0 (kV)    Probe Dia. : 0    Scan : Off
 Dated on Apr 26 01:10 2020
 WDS only       No. of accumulation : 1

Curr.(A) : 3.010E-08
Element Peak(mm)    Net(cps)  Bg-(cps)  Bg+(cps)   S.D.(%)   D.L.(ppm)
 1 N    110.585      2531.5     188.9      45.1      0.52      853
 2 B    128.873      2461.5      80.5     236.2      0.54      809

ZAF Metal 
Element   Wt.(%)   Atom(%)  K(%)  K-raw(%)   ZAF     Z       A       F   
 N        56.479  49.9907  56.477 100.065  1.0000  1.0000  1.0000  1.0000 
 B        43.595  50.0093  43.596 100.082  1.0000  1.0000  1.0000  1.0000 
 -------------------------------------------------------------------------
 Total   100.074 100.0000 100.073 200.147    Iteration = 4

UNK Measurement over


I do not know what the Z, A and F factors displayed in the above JEOL output represent, but multiplying the Z and A factors together I do get the "ZAF Fac." values in red. I can understand the "F" (fluorescence?) factors both being 1.000, but why would the "A" factors both be 0.33?

It appears to me that you are simply analyzing your BN standard as an unknown using your BN standard as the standard. If I do the same in CalcZAF (I created a "fake" BN standard for this example because my BN standard is not stoichiometric and contains some carbon and oxygen), I get this output calculating concentrations from counts:

STANDARD PARAMETERS (TOA= 40):

 ELEMENT  STDNUM STDCONC STDKFAC   Z-BAR  ABSCOR  FLUCOR  ZEDCOR  ZAFCOR                 
    N Ka     603  56.439   .2704  6.1288  2.1290  1.0000   .9805  2.0875
    B Ka     603  43.561   .2560  6.1288  1.6604   .9993  1.0256  1.7018

 ELEMENT STP-POW BKS-COR   F(x)e   F(x)s      Eo      Ec   Eo/Ec
    N Ka   .9863   .9941   .7563   .3552   10.00   .4000 25.0000
    B Ka  1.0179  1.0076   .5837   .3516   10.00   .1880 53.1915


SAMPLE: 0, TOA: 40, ITERATIONS: 10, Z-BAR: 6.12849

 ELEMENT  ABSCOR  FLUCOR  ZEDCOR  ZAFCOR STP-POW BKS-COR   F(x)u      Ec   Eo/Ec    MACs uZAF/sZAF
   N  ka  2.1285  1.0000   .9805  2.0870   .9863   .9941   .3553   .4000 25.0000 7919.32  .9997528
   B  ka  1.6606   .9993  1.0257  1.7020  1.0179  1.0076   .3515   .1880 53.1915 7780.42  1.000138

 ELEMENT   K-RAW K-VALUE ELEMWT% OXIDWT% ATOMIC% FORMULA KILOVOL                                       
   N  ka 1.00131  .27071  56.499   -----  49.985    .500   10.00                                       
   B  ka 1.00151  .25636  43.633   -----  50.015    .500   10.00                                       
   TOTAL:                100.131   ----- 100.000   1.000


The JEOL output does not show the MAC values and I would not assume they are the "LINEMU" values. Can you output the JEOL MACs for B Ka in N and N Ka in B?  Does anyone know where these values are found in the JEOL software?
« Last Edit: May 19, 2020, 09:42:43 AM by John Donovan »
John J. Donovan, Pres. 
(541) 343-3400

"Not Absolutely Certain, Yet Reliable"

Thomas

  • Graduate
  • **
  • Posts: 8
Re: Assessing Accuracy in CalcZAF
« Reply #9 on: May 20, 2020, 07:49:58 AM »
Hi John,
yes, I know the MAC data bases for K alpha, L alpha and so on...in the JEOL software.
Here are the data of interest;
1) B as emitter: absorber B 3350, and N 11200, respectively;
2) N as emitter: absorber B 15800, and N 1810, respectively.
You are right, ZAFCor is calculated by multiplying Z, A and F. However, not only A values but particularly Z values seem to be very unusual to me...
Best regards,
Thomas
 

John Donovan

  • Administrator
  • Emeritus
  • *****
  • Posts: 3304
  • Other duties as assigned...
    • Probe Software
Re: Assessing Accuracy in CalcZAF
« Reply #10 on: May 20, 2020, 09:15:47 AM »
Hi John,
yes, I know the MAC data bases for K alpha, L alpha and so on...in the JEOL software.
Here are the data of interest;
1) B as emitter: absorber B 3350, and N 11200, respectively;
2) N as emitter: absorber B 15800, and N 1810, respectively.

These values are very close to the LINEMU vales as seen here:

Current Mass Absorption Coefficients From:
LINEMU   Henke (LBL, 1985) < 10KeV / CITZMU > 10KeV

  Z-LINE   X-RAY Z-ABSOR     MAC
      N       ka      N   1.8125e+03
      N       ka      B   1.5803e+04
      B       ka      N   1.1196e+04
      B       ka      B   3.3340e+03

However there is large variation in the literature as seen here in this output from CalcZAF using the Display MAC Emitter Absorber Pair menu, first B Ka in N:

MAC value for B Ka in N =   11196.24  (LINEMU   Henke (LBL, 1985) < 10KeV / CITZMU > 10KeV)
MAC value for B Ka in N =   10570.00  (CITZMU   Heinrich (1966) and Henke and Ebisu (1974))
MAC value for B Ka in N =        .00  (MCMASTER McMaster (LLL, 1969) (modified by Rivers))
MAC value for B Ka in N =   10117.85  (MAC30    Heinrich (Fit to Goldstein tables, 1987))
MAC value for B Ka in N =   12596.53  (MACJTA   Armstrong (FRAME equations, 1992))
MAC value for B Ka in N =    9566.52  (FFAST    Chantler (NIST v 2.1, 2005))
MAC value for B Ka in N =    9566.52  (USERMAC  User Defined MAC Table)

And here for N Ka in B:

MAC value for N Ka in B =   15802.96  (LINEMU   Henke (LBL, 1985) < 10KeV / CITZMU > 10KeV)
MAC value for N Ka in B =   15810.00  (CITZMU   Heinrich (1966) and Henke and Ebisu (1974))
MAC value for N Ka in B =        .00  (MCMASTER McMaster (LLL, 1969) (modified by Rivers))
MAC value for N Ka in B =   16610.23  (MAC30    Heinrich (Fit to Goldstein tables, 1987))
MAC value for N Ka in B =   14326.82  (MACJTA   Armstrong (FRAME equations, 1992))
MAC value for N Ka in B =   14705.91  (FFAST    Chantler (NIST v 2.1, 2005))
MAC value for N Ka in B =   14705.91  (USERMAC  User Defined MAC Table)

It is worth keeping in mind that when MACs are in the 10^4 range, a 1% change in the MAC corresponds roughly to a 1% change in the calculated composition.

You are right, ZAFCor is calculated by multiplying Z, A and F. However, not only A values but particularly Z values seem to be very unusual to me...

Exactly.  Does anyone else know what these JEOL output values for Z and A below represent?

Standard Data
Element   Standard name     Wt.(%)   ZAF Fac.   Z        A        F
 1 N      A_BN              56.4400   9.3141  28.0328   0.3323   1.0000
 2 B      A_BN              43.5600  26.3534  78.5310   0.3356   1.0000
« Last Edit: May 20, 2020, 09:27:39 AM by John Donovan »
John J. Donovan, Pres. 
(541) 343-3400

"Not Absolutely Certain, Yet Reliable"

Brian Joy

  • Professor
  • ****
  • Posts: 296
Re: Assessing Accuracy in CalcZAF
« Reply #11 on: May 22, 2020, 08:33:00 AM »
Exactly.  Does anyone else know what these JEOL output values for Z and A below represent?

Standard Data
Element   Standard name     Wt.(%)   ZAF Fac.   Z        A        F
 1 N      A_BN              56.4400   9.3141  28.0328   0.3323   1.0000
 2 B      A_BN              43.5600  26.3534  78.5310   0.3356   1.0000


The Z factor is equal to the area under phi(rho*z), which is equal to (R/S)*(1/Q(E0)), where R is the backscatter factor, S is the stopping power, and Q(E0) is the ionization cross section.  If you work through the calculation, you’ll see that (R/S)*(1/Q(E0)) for a given X-ray in the compound carries units of g/cm^2, so you shouldn’t expect it to look like a fraction (or at least a smaller number) until you take the ratio of it relative to the same quantity calculated for the pure element (since standard and unknown are the same in this case).  The value given for A appears to be f(chi) for each respective X-ray in the mixture; this value makes sense for B Ka but it doesn’t look right for N Ka, which is very strongly absorbed by B.  For X-rays of light elements, the value of f(chi) and the magnitude of the absorption correction are very heavily dependent on the accuracy of the model for phi(rho*z).  Note that It’s critically important to carry units through calculations!!!  But hardly anyone does, including JEOL.
« Last Edit: May 23, 2020, 09:02:31 AM by Brian Joy »
Brian Joy
Queen's University
Kingston, Ontario
JEOL JXA-8230

John Donovan

  • Administrator
  • Emeritus
  • *****
  • Posts: 3304
  • Other duties as assigned...
    • Probe Software
Re: Assessing Accuracy in CalcZAF
« Reply #12 on: May 22, 2020, 03:52:47 PM »
Hi Brian,
Thank-you for chiming in, this is helpful information.  I think it answers Thomas' questions quite nicely.

My take away would be, first the Z factor values are not in useful units, and second, the A factor appears to be in error, so we should perhaps just ignore these factors I suppose?
John J. Donovan, Pres. 
(541) 343-3400

"Not Absolutely Certain, Yet Reliable"

Brian Joy

  • Professor
  • ****
  • Posts: 296
Re: Assessing Accuracy in CalcZAF
« Reply #13 on: May 22, 2020, 11:40:18 PM »
Hi Brian,
Thank-you for chiming in, this is helpful information.  I think it answers Thomas' questions quite nicely.

My take away would be, first the Z factor values are not in useful units, and second, the A factor appears to be in error, so we should perhaps just ignore these factors I suppose?

The printed Z and A values in the JEOL output are for a given X-ray in BN, while CalcZAF and PfE print out ratios of these quantities to those for the pure elements.  The JEOL software also prints out Z, A, and F relative to the standard.  (It would be useful if CalcZAF and PfE did this, too.)

I haven't looked closely at calculations of f(chi) for B Ka and N Ka in BN, and so I'm not entirely certain that my assumption that f(chi) for N Ka in the mixture is smaller than that of B Ka is correct. 
« Last Edit: May 23, 2020, 12:18:59 AM by Brian Joy »
Brian Joy
Queen's University
Kingston, Ontario
JEOL JXA-8230

Brian Joy

  • Professor
  • ****
  • Posts: 296
Re: Assessing Accuracy in CalcZAF
« Reply #14 on: May 23, 2020, 12:46:00 AM »
Here is some output for BN using PROZA96 with MACs determined by Bastin.  So it looks like my assumption was incorrect (though, as expected, the absorption correction for N Ka in the mixture relative to the pure element is still much greater than for B Ka in the mixture relative to the pure element).

« Last Edit: May 23, 2020, 12:51:41 AM by Brian Joy »
Brian Joy
Queen's University
Kingston, Ontario
JEOL JXA-8230