Hi John,
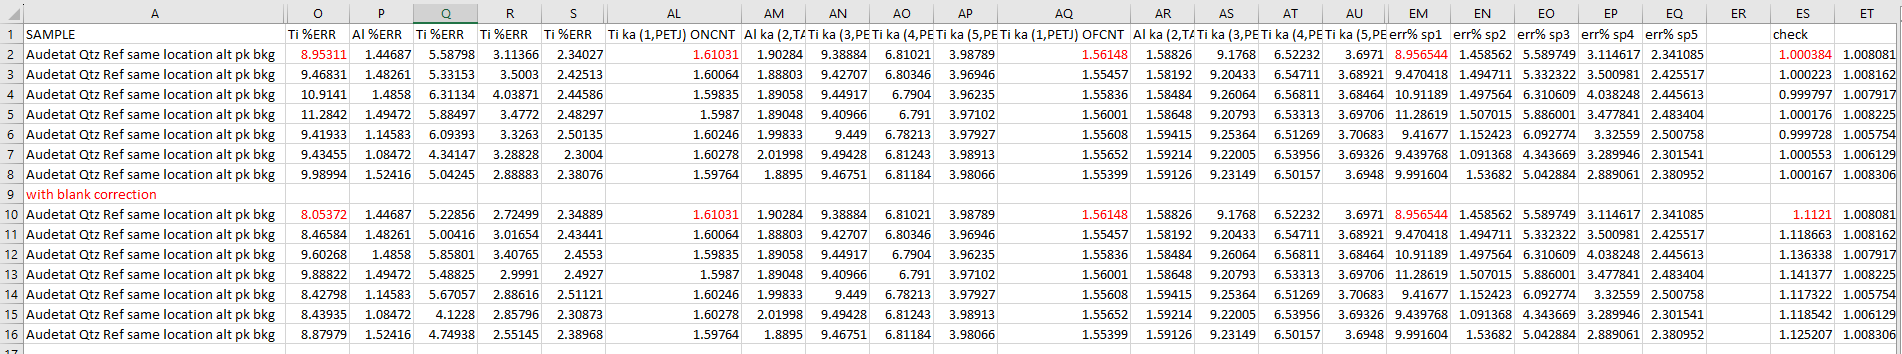
Here's an example - you'll see change in error given by PFE when blank corrected selected. Upper dataset blank turned off for Ti, turned on for Ti in lower dataset. For Al its on for both
What it is, is when you take the same absolute error and make it a relative error for a changed composition
Aurelien and I looked into this and as you report there are small differences in the reported analytical sensitivity calculations (from Scott and Love, 1983) method when the blank correction is applied due to the way we calculate it (though this behavior has now been changed as described further below). See the Probe for EPMA User Reference Manual for details on the Scott and Love 1983 calculation.
The reason for this previous behavior is that the Scott and Love (1983) calculation requires knowing the raw counts from the unknown peak and unknown background. Originally we calculated these raw counts from the peak and background counts after they had been corrected for dead time, beam drift and background (the interpolated off-peak or MPB or calculated MAN intensities). This is mostly because one cannot use the raw high and low off-peak measurements because it's the interpolated or calculated background intensities that need to be utilized in the case of the MAN (and MPB to some extent), and these background intensity values are calculated during the quantification.
The problem with using these calculated background values is that they need to be de-normalized for dead time, beam drift and counting time (to obtain raw photon counts) in order to determine the standard deviations (SQRT). But some time ago we began utilizing the original stored raw intensities for simple statistics such as the variance on the on peak and high/low off-peak intensities. Then skipping the de-normalization steps we previously utilized and re-normalizing them again for dead time, beam drift and counting time if these display normalizations were selected.
However, for statistical calculations such as the analytical sensitivities this approach will not work as we don't have the raw intensities stored for the calculated background intensities, as they are only calculated as needed and of course they are always in normalized intensity (not raw count) units. The raw on-peak photon count intensities are of course available, just not the raw calculated background intensities, and that is why we continued to utilize the de-normalization, then take the square root, then the re-normalization method.
The problem with this method as you might already have realized is that the blank correction (and interference correction, etc) is applied during the quantification process, which is great if one wants to export k-ratios that are already corrected for everything, say for off-line thin film calculations. But then there will be (very) small differences in the peak intensities from these corrections, and that is what Ben is seeing as quoted above.
So, not a big deal, but I understand why Ben was wondering what was the cause of this. Of course in my opinion, one should not even concern themselves with analytical sensitivity calculations for small values. That is because as the peak intensity approaches the background, the analytical sensitivity calculation gets very large, indicating of course that one's analytical sensitivity is worse than the background variance. In fact I believe one really should focus more on analytical sensitivity for higher concentrations, and be more concerned with the
detection limits for low concentrations...
But as Aurelien and I were thinking about this issue, we also noticed that we were missing code in the analytical sensitivity calculation to de-normalize for dead time prior to taking the square root (it's the only place it was missing as we checked the other code!). At low count rates this missing de-normalization has almost no effect but of course at high count rates it does. But at high count rates the analytical sensitivity calculation is not sensitive to the background intensity, so that's why we never noticed this!
So we added the dead time de-normalization code and then immediately found a problem when de-normalizing small intensities for dead time using the logarithmic dead time correction. It's because the maximum value that one can handle when de-normalizing using the exponential math function is 10^308 in double precision, and small background intensities can generate values larger than this!
That's when Aurelien and I came up with the idea that for obtaining the raw background (interpolated/calculate) count intensity, we could simply apply the
peak to background ratio values obtained from the quant calculation, to the raw on-peak intensity value and voila, we now have a raw background intensity and can take the square root directly without any de-normalization. Nice!
Here are the detection limits and analytical sensitivities for some Ti in synthetic SiO2 (20 keV, 200 nA, 1920 sec on and 1920 sec off-peak), first without the blank correction:
Detection limit at 99 % Confidence in Elemental Weight Percent (Single Line):
ELEM: Ti Ti Ti Ti Ti
271 .00049 .00033 .00032 .00054 .00046
272 .00048 .00033 .00032 .00054 .00046
273 .00049 .00033 .00032 .00054 .00046
274 .00049 .00033 .00032 .00054 .00046
275 .00049 .00033 .00031 .00054 .00046
AVER: .00049 .00033 .00032 .00054 .00046
SDEV: .00000 .00000 .00000 .00000 .00000
SERR: .00000 .00000 .00000 .00000 .00000
Percent Analytical Relative Error (One Sigma, Single Line):
ELEM: Ti Ti Ti Ti Ti
271 129.7 15.5 5.2 53.2 673.5
272 501.4 15.4 5.6 136.4 25.6
273 198.3 15.2 5.3 41.2 331.3
274 192.8 12.7 5.4 51.1 47.4
275 94.2 12.9 5.1 36.3 47.3
AVER: 223.3 14.3 5.3 63.6 225.0
SDEV: 161.5 1.4 .2 41.3 280.8
SERR: 72.2 .6 .1 18.5 125.6
And here with the blank correction:
Detection limit at 99 % Confidence in Elemental Weight Percent (Single Line):
ELEM: Ti Ti Ti Ti Ti
271 .00049 .00033 .00032 .00054 .00046
272 .00048 .00033 .00032 .00054 .00046
273 .00049 .00033 .00032 .00054 .00046
274 .00049 .00033 .00032 .00054 .00046
275 .00049 .00033 .00031 .00054 .00046
AVER: .00049 .00033 .00032 .00054 .00046
SDEV: .00000 .00000 .00000 .00000 .00000
SERR: .00000 .00000 .00000 .00000 .00000
Percent Analytical Relative Error (One Sigma, Single Line):
ELEM: Ti Ti Ti Ti Ti
271 655.7 40.7 592.7 395.7 42.5
272 238.3 40.6 67.1 70.8 72.3
273 875.4 42.1 181.7 346.5 45.4
274 1001.7 96.0 103.7 545.7 251.0
275 226.5 81.3 978.9 163.5 249.1
AVER: 599.5 60.1 384.8 304.5 132.1
SDEV: 357.3 26.6 392.9 188.9 108.3
SERR: 159.8 11.9 175.7 84.5 48.5
Now the sharp-eyed among you will have noticed that the analytical sensitivities are still different (generally larger) with the blank correction applied. And why is that? Well it's pretty much the same reason it was before.
With the previous de-normalize/re-normalize method, the background counts didn't change depending on the blank correction, but the peak counts did because the blank correction is applied to the (corrected) peak counts!
In the new code based on the raw peak counts and the calculated peak to background method, the raw peak counts didn't change (because they are based on the measured count rate), but the background counts did change because the blank correction affects the calculated peak to background ratio.
Specifically, the peak to background ratio went from 0.998234 (for the first line of channel 1), to 0.999650 (closer to unity) when the blank correction is applied.
So after all that we are sort of where we were but the analytical sensitivity calculation is more accurate because now we are utilizing raw intensities for the Scott and Love calculation. I still think for trace elements the detection limit is what one should be considering though...
I went ahead and posted the new analytical sensitivity code here for those interested:
https://probesoftware.com/smf/index.php?topic=1307.msg12149#msg12149Oh, and one last thing: previously we always reported negative analytical sensitivities when the concentrations were negative (it happens when one is attempting to measure zero!). But someone (?) asked a while back why we did this, and now that we've thought about it a bit more, we now take the absolute value of the analytical sensitivity for reporting purposes. This also makes the average of the analytical sensitivities more sensible. We can change this back if anyone has a reasonable objection.


 Remember, you need to be logged in to see posted attachments!