Author Topic: New Features In Probe for EPMA  (Read 95397 times)

Probeman

  • Emeritus
  • *****
  • Posts: 2858
  • Never sleeps...
    • John Donovan
Re: New Features In Probe for EPMA
« Reply #105 on: May 26, 2017, 05:42:11 PM »
I finally finished specifying the "material type" for most of the standards in my standard database as described above and here is a screen shot from the Add/Remove Standards To/From Run dialog:


This shows the standards specified as "apatites" or "phylosilicates".  My default standard.mdb files is attached below. One can copy this file to their ProgramData\Probe Software\Probe for EPMA folder if you don't mind overwriting your own standard database (this file is never overwritten by the CalcZAF or ProbeforEPMA installer).
john
« Last Edit: April 12, 2020, 07:01:43 PM by John Donovan »
The only stupid question is the one not asked!

John Donovan

  • Administrator
  • Emeritus
  • *****
  • Posts: 3304
  • Other duties as assigned...
    • Probe Software
Re: New Features In Probe for EPMA
« Reply #106 on: June 20, 2017, 10:53:22 PM »
I added a "magnification outline" feature to the PictureSnap window.  In other words, if the instrument is in scan mode, the PictureSnap window will now display the imaging area on the currently displayed image as seen in the attached images below (please login to see attachments).
john

John J. Donovan, Pres. 
(541) 343-3400

"Not Absolutely Certain, Yet Reliable"

John Donovan

  • Administrator
  • Emeritus
  • *****
  • Posts: 3304
  • Other duties as assigned...
    • Probe Software
Re: New Features In Probe for EPMA
« Reply #107 on: July 03, 2017, 10:27:31 PM »
The latest version of Probe for EPMA (and CalcImage) now load images 10-15x faster than before.

http://probesoftware.com/smf/index.php?topic=40.0

Please update to version 11.9.4 and check it out.
john
John J. Donovan, Pres. 
(541) 343-3400

"Not Absolutely Certain, Yet Reliable"

John Donovan

  • Administrator
  • Emeritus
  • *****
  • Posts: 3304
  • Other duties as assigned...
    • Probe Software
Re: New Features In Probe for EPMA
« Reply #108 on: August 02, 2017, 08:29:59 PM »
The latest version of Probe for EPMA (v. 11.9.6) has an almost complete set of pure element spectra from Penepma for 5 to 25 keV electron beams. 

This allows us to accurately simulate WDS spectra for the 5 to 25 keV range for teaching in the classroom without an electron microprobe for both JEOL and Cameca "demo" configurations.
john
John J. Donovan, Pres. 
(541) 343-3400

"Not Absolutely Certain, Yet Reliable"

John Donovan

  • Administrator
  • Emeritus
  • *****
  • Posts: 3304
  • Other duties as assigned...
    • Probe Software
Re: New Features In Probe for EPMA
« Reply #109 on: December 09, 2017, 12:37:56 PM »
Anette von der Handt and I were "brainstorming" and we came up with a cool feature I think that will help with designating mapping areas on ones sample using Probe Image.

The idea is that when you have Probe Image open and using the 2 point mapping method to define the mapping area, one simply opens up PictureSnap and then loads an image file of the sample, which of course could be from any source (optical scan, low mag beam scan, mosaic map, flat bed scanner, cell phone camera, etc.), then after calibrating the image to the instrument stage, by clicking this menu in PictureSnap...


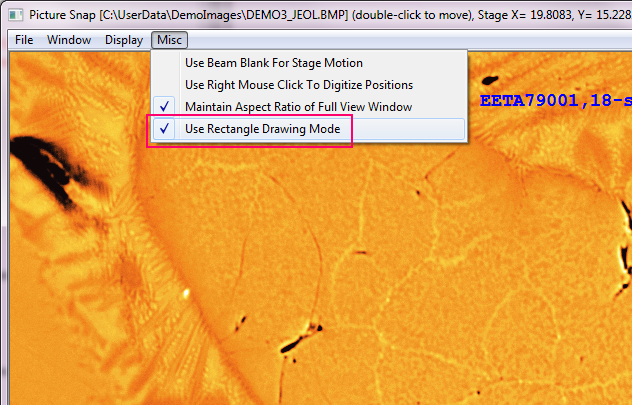
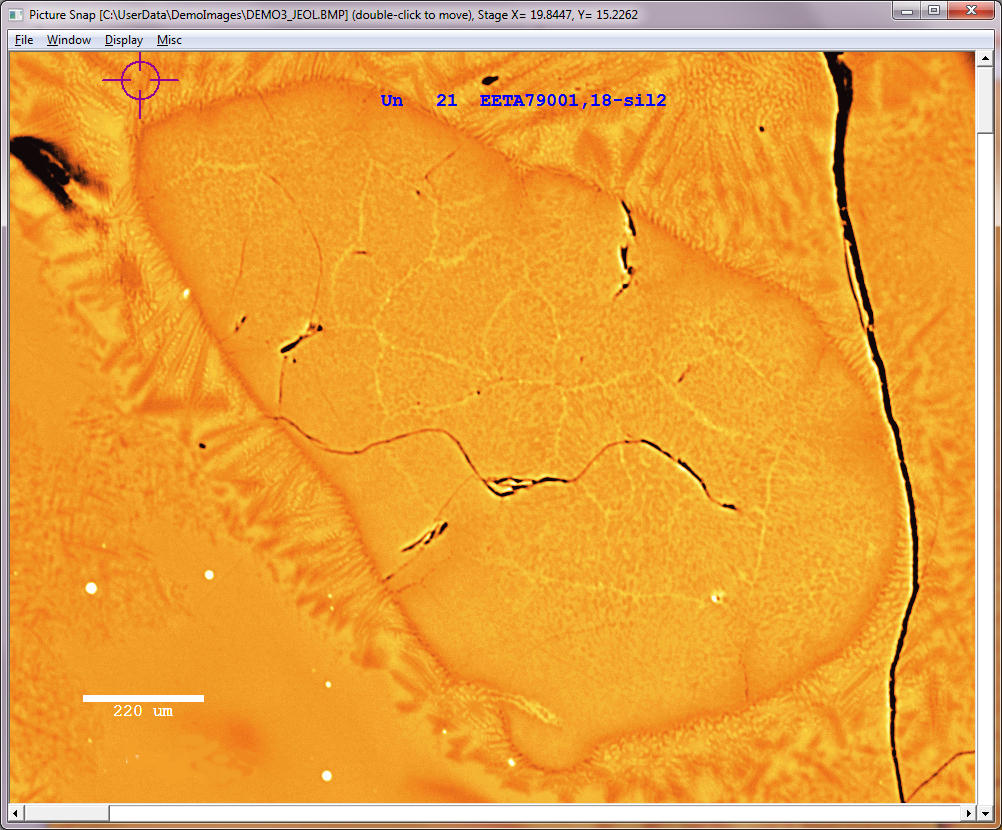
the app will automatically draw a rectangle on the image, based on the two last stage positions that you double-clicked on (and of course also driving the stage to that sample position).  The first point you go to will look something like this:


The second point you drive to (double-click) will now show the rectangle and look something like this:


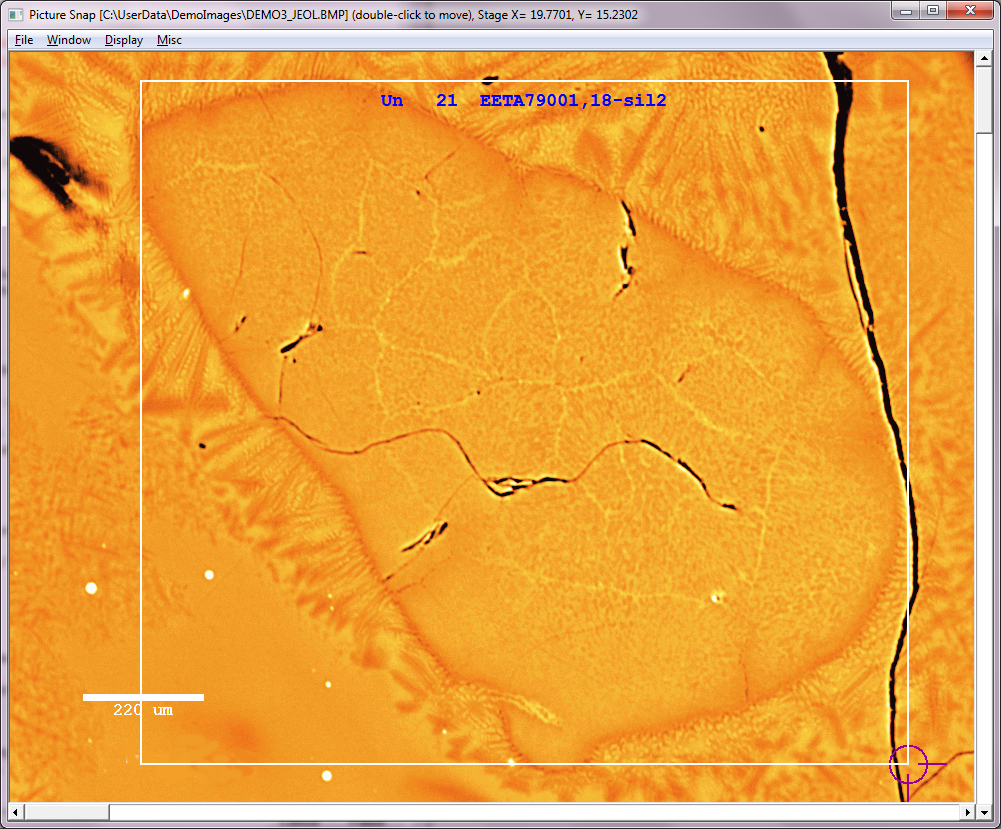
By alternately clicking the corners of the mapping area one can adjust the extents to exactly cover the phase or region desired.

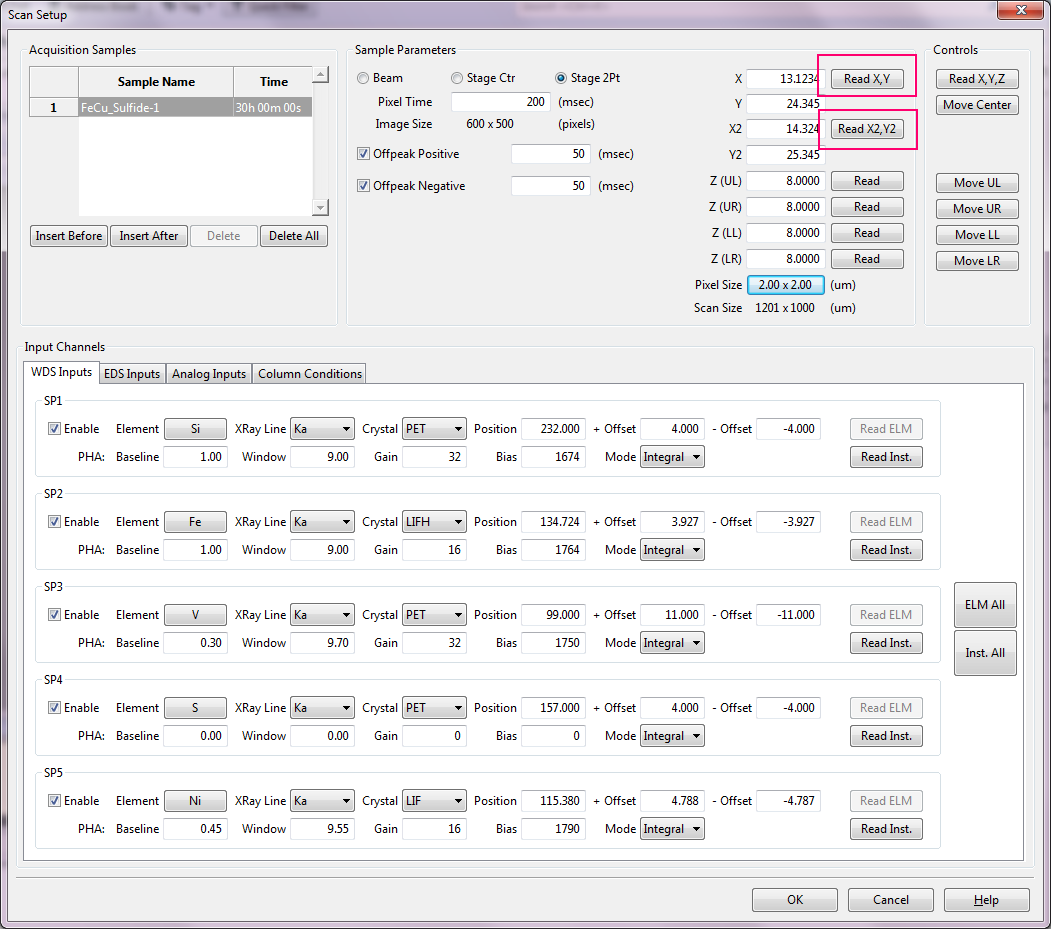
Then from Probe Image one can click the Read X/Y or Read X2/Y2 button to record the corners of the area to be mapped as seen here:


The other thing we did which is also pretty cool is that now when one double-clicks on the full size image window in PictureSnap, the stage is of course driven to that position, but now the main PictureSnap window automatically adjusts to display the region that one clicked on. 

It difficult to capture an image showing this, but this automatic adjustment also occurs when using the Move To buttons in the PictureSnap calibration window. The automatic adjustment of the displayed image is especially nice when very large images (e.g., 20K x 20K pixels) are loaded in PictureSnap.

Try v. 12.1.1 of PFE and let us know what you think.
john
« Last Edit: April 12, 2020, 07:02:11 PM by John Donovan »
John J. Donovan, Pres. 
(541) 343-3400

"Not Absolutely Certain, Yet Reliable"

John Donovan

  • Administrator
  • Emeritus
  • *****
  • Posts: 3304
  • Other duties as assigned...
    • Probe Software
Re: New Features In Probe for EPMA
« Reply #110 on: December 10, 2017, 03:16:34 PM »
In further thinking about this, Anette and I thought that adding a PictureSnap button to the traverse and grid digitize dialogs would be a good idea.

Therefore the PictureSnap window invoked from the digitize grid dialog will now automatically show a rectangle on the image (as shown in the previous post), while the traverse dialog invoked PictureSnap will show a line between the last two stage positions driven to, using a double click as seen here:


We had to disable some of the modeless window menus in PictureSnap, but still one can display previously digitized points using the Display menu, as seen here:


Try it out and see what you think!
« Last Edit: April 12, 2020, 07:02:27 PM by John Donovan »
John J. Donovan, Pres. 
(541) 343-3400

"Not Absolutely Certain, Yet Reliable"

Probeman

  • Emeritus
  • *****
  • Posts: 2858
  • Never sleeps...
    • John Donovan
Re: New Features In Probe for EPMA
« Reply #111 on: December 11, 2017, 10:58:49 AM »
The other thing we did which is also pretty cool is that now when one double-clicks on the full size image window in PictureSnap, the stage is of course driven to that position, but now the main PictureSnap window automatically adjusts to display the region that one clicked on. 

It difficult to capture an image showing this, but this automatic adjustment also occurs when using the Move To buttons in the PictureSnap calibration window. The automatic adjustment of the displayed image is especially nice when very large images (e.g., 20K x 20K pixels) are loaded in PictureSnap.

Try v. 12.1.1 of PFE and let us know what you think.

I needed to use PictureSnap this morning on the probe and I just have to say this automatic adjustment of the main PictureSnap window to where you moved the stage to using the "full view" window is pretty cool.

Would it make sense to also automatically adjust the main PictureSnap window display based on any stage move, say the user using the joystick to move the stage?
The only stupid question is the one not asked!

John Donovan

  • Administrator
  • Emeritus
  • *****
  • Posts: 3304
  • Other duties as assigned...
    • Probe Software
Re: New Features In Probe for EPMA
« Reply #112 on: December 23, 2017, 10:29:15 PM »
The latest version of Probe for EPMA (and CalcZAF), now defaults to HTTP for software updates as shown here:


This means that those without firewall exceptions for FTP will have HTTP as the default download protocol. A small change but better.
john
« Last Edit: April 13, 2020, 09:52:28 PM by John Donovan »
John J. Donovan, Pres. 
(541) 343-3400

"Not Absolutely Certain, Yet Reliable"

John Donovan

  • Administrator
  • Emeritus
  • *****
  • Posts: 3304
  • Other duties as assigned...
    • Probe Software
Re: New Features In Probe for EPMA
« Reply #113 on: January 13, 2018, 10:15:52 AM »
A very minor thing really, but we made some small improvements to the wavescan (and std/unk) plot displays, by making the line (and symbol) colors brighter and also thickened the line width slightly. The original default line/symbol colors in the Pro Essentials graphics library were quite muted and difficult to distinguish when plotting multiple wavescans.

Here is what the new colors (and line thickness) looks like:


We also changed the colors of the current and sample off-peaks to better match other plots in PFE (where bright green shows the "current" values).   We hope these changes meet with everyone's approval!   :)
« Last Edit: April 12, 2020, 07:02:42 PM by John Donovan »
John J. Donovan, Pres. 
(541) 343-3400

"Not Absolutely Certain, Yet Reliable"

John Donovan

  • Administrator
  • Emeritus
  • *****
  • Posts: 3304
  • Other duties as assigned...
    • Probe Software
Re: New Features In Probe for EPMA
« Reply #114 on: February 04, 2018, 03:45:56 PM »
We made a small tweak for the Penepma WDS simulation mode in Probe for EPMA.  As you might remember, if you acquire a standard sample in the PFE Penepma simulation mode, the program will calculate the emission intensities for the standard composition.  If you acquire an unknown or wavescan sample that has the same name (not case sensitive) as one of the standards in the run, the program will again calculate the emission intensities for that standard composition. 

If however you acquire an unknown or wavescan sample that has a name which does not match any standard names, the program will acquire a random composition based on the elements being acquired.

To see exactly what composition is being calculated for simulation, the program will now indicate in the status bar (at the bottom of the PFE log window), if it is acquiring a standard composition or a random composition as seen here:


It will subsequently display the concentrations of each element as it convolves the Penepma spectra to the resolution of the specific spectrometer/crystal/keV combination as seen here:


I find this display information helpful when running in Penepma simulation mode and maybe you all will also.   8)
« Last Edit: April 13, 2020, 07:17:55 PM by John Donovan »
John J. Donovan, Pres. 
(541) 343-3400

"Not Absolutely Certain, Yet Reliable"

John Donovan

  • Administrator
  • Emeritus
  • *****
  • Posts: 3304
  • Other duties as assigned...
    • Probe Software
Re: New Features In Probe for EPMA
« Reply #115 on: April 18, 2018, 03:23:47 PM »
As most of you know, Probe for EPMA can display images and overlay various information on them such as the data point locations, acquisition conditions, scale bar, data point labels, etc. as seen here:


A student recently asked me if she could output her images with the data point locations shown and modify the point labels to display the actual PPM of Ti for each point.  I said, not in PFE (yet!), but it's easy to export your images into Surfer and perform a "post" operation to display one's data points with any information labeled.

So what is the new feature? Well as most of you know you can set up the image overlay graphics as one prefers, from the Run | Display, Annotate and Export Analog Signal Images menu in Probe for EPMA.  And the program will then cycle through each image and output a BMP image of graphics overlay, plus a "raw" BMP image without any graphics, plus a .DAT file with the X, Y and line numbers, and a .ACQ file with the image stage calibration information, and a txt file with the analytical conditions.

So now, in addition to the above output files, Probe for EPMA will also output a .GRD file compatible with Golden Software's Surfer program as seen here:


The Surfer app is what we will then use to modify the point label graphics to display custom data values.  This process I will describe in a separate post in the Grapher/Surfer topic here:

http://probesoftware.com/smf/index.php?topic=1066.msg7058#msg7058
« Last Edit: April 12, 2020, 07:03:01 PM by John Donovan »
John J. Donovan, Pres. 
(541) 343-3400

"Not Absolutely Certain, Yet Reliable"

John Donovan

  • Administrator
  • Emeritus
  • *****
  • Posts: 3304
  • Other duties as assigned...
    • Probe Software
Re: New Features In Probe for EPMA
« Reply #116 on: January 27, 2019, 02:41:26 PM »
This is a really cool new feature for automating presentation output for large numbers of traverse samples. From the Output menu select the new Output Automatic Traverse Plots as seen here:


After the analysis data has been output, this dialog will appear:


Select the options you want and click OK. The program will ask if you want to run the output script in Grapher. An example of the presentation output is seen attached below (remember to login to see attachments!).

I should mention the selection of the "customizable" Grapher script templates isn't implemented yet. Probably tomorrow...

Also, I should mention that this Grapher script runs much too slowly right now. We'll start optimizing it soon, but I wanted to get the feature out there for feedback and heck, automated output is always useful even if it is a little slow!

We modified the default scripts for automatic plotting of traverses in Grapher as first described here:

https://probesoftware.com/smf/index.php?topic=42.msg2206#msg2206

So that the plotted lines are thicker allowing the user to more accurately see the color for each element as seen here:


If you have modified your custom Grapher scripts TravXY_Custom1.bas, TravXY_Custom2.bas, etc., you will have to add the line highlighted in red:

Quote
                     'Coloring the line
                        LinePlot.line.foreColor = RGB(RScale%(i%), GScale%(i%), BScale%(i%))
                        LinePlot.line.width = 0.02

Note however, that the Output | Automatic Traverse Plots menu has been moved up near the top of the Output menu.
« Last Edit: January 27, 2019, 03:54:58 PM by John Donovan »
John J. Donovan, Pres. 
(541) 343-3400

"Not Absolutely Certain, Yet Reliable"

John Donovan

  • Administrator
  • Emeritus
  • *****
  • Posts: 3304
  • Other duties as assigned...
    • Probe Software
Re: New Features In Probe for EPMA
« Reply #117 on: April 06, 2019, 11:24:06 AM »
I recently posted about modifying the data subsets plotted by using the Customization Dialog menu. This is done by right clicking the quantitative histogram in the Pixel Extraction window in CalcImage as seen here and selecting the elements to display from the list:

https://probesoftware.com/smf/index.php?topic=1144.msg8234#msg8234

but I'm posting another tip on modifying the displayed data sets (subsets) using the Customization Dialog dialog here in the Probe for EPMA Tips & Tricks topic, because just like the above method, this works for any plot display in CalcImage or Probe for EPMA.

Basically there is a Scrolling Subsets control in the Customization Dialog Subset tab as seen here with a single subset selected for display and the scrolling subset control clicked once so it advances to 1:


Apparently this plots the selected subset and the 1st scrolling subset. Then by clicking the scrolling subset control again, we again get the selected subset and also the 1st *and* 2nd subsets as seen here:


One can also select no subsets from the subset list and then simply click the scrolling subsets control and the Apply button, and then see each new subset appear in addition to all the preceding subsets.

I guess this could be useful for really complex plots?  Anyway, just FYI.
« Last Edit: April 08, 2019, 10:19:23 AM by John Donovan »
John J. Donovan, Pres. 
(541) 343-3400

"Not Absolutely Certain, Yet Reliable"

John Donovan

  • Administrator
  • Emeritus
  • *****
  • Posts: 3304
  • Other duties as assigned...
    • Probe Software
Re: New Features In Probe for EPMA
« Reply #118 on: June 29, 2019, 10:28:50 PM »
During the QMA 2019 conference Emma Bullock made a good point in her integrated WDS EDS presentation, that if EDS net intensities are being displayed in Probe for EPMA during the automated acquisition (the default for Probe for EPMA), it can take a bit longer to acquire the data, because extracting the EDS net intensities for hundreds of points can take a bit of time.

Because of this I added a new global flag in Probe for EPMA that asks the user if they want to see the EDS net intensities displayed during the automated acquisition. Normally one would not be sitting there watching an automated acquisition, so no, you'd probably prefer to simply skip displaying the EDS net intensities (the WDS net intensities will still be displayed). So I bumped the Probe for EPMA version and the new 12.6.4 version now asks the user whether they want to see these EDS net intensities durng the automated acquisition (or not!):


Thank-you Emma for a great idea!
John J. Donovan, Pres. 
(541) 343-3400

"Not Absolutely Certain, Yet Reliable"

John Donovan

  • Administrator
  • Emeritus
  • *****
  • Posts: 3304
  • Other duties as assigned...
    • Probe Software
Re: New Features In Probe for EPMA
« Reply #119 on: June 30, 2019, 02:29:31 PM »
Philip Weigel from Hannover asked if we could step the stage during unknown acquisitions to reduce oxidation when making "flank method" measurements.

We have a "stage increment" feature already implemented in Probe for EPMA for wavescans and peaking, so it was an easy mod to add it for unknowns as seen below.  This is now available is v. 12.6.4 of Probe for EPMA. Update from your Help menu.


John J. Donovan, Pres. 
(541) 343-3400

"Not Absolutely Certain, Yet Reliable"