Author Topic: Latest version changes for Probe for EPMA (and CalcImage) v. 13.8.3  (Read 110339 times)

Anette von der Handt

  • Global Moderator
  • Professor
  • *****
  • Posts: 351
    • UMN Probelab
Re: Latest version changes for Probe for EPMA (and CalcImage) v. 12.3.8
« Reply #120 on: June 26, 2018, 06:20:00 PM »
And it works!

« Last Edit: April 11, 2020, 10:20:10 PM by John Donovan »
Against the dark, a tall white fountain played.

John Donovan

  • Administrator
  • Emeritus
  • *****
  • Posts: 3264
  • Other duties as assigned...
    • Probe Software
Re: Latest version changes for Probe for EPMA (and CalcImage) v. 12.4.2
« Reply #121 on: July 20, 2018, 08:44:38 AM »
We've been negligent and not documented (in this topic), changes to the software for more than a month.   :o

So that is now remedied:

https://probesoftware.com/smf/index.php?topic=40.0

We've just been so much fun improving Probe for EPMA and PictureSnapApp that it slipped our minds...
« Last Edit: August 24, 2018, 10:33:22 AM by John Donovan »
John J. Donovan, Pres. 
(541) 343-3400

"Not Absolutely Certain, Yet Reliable"

John Donovan

  • Administrator
  • Emeritus
  • *****
  • Posts: 3264
  • Other duties as assigned...
    • Probe Software
Re: Latest version changes for Probe for EPMA (and CalcImage) v. 12.4.2
« Reply #122 on: July 21, 2018, 02:18:16 PM »
This is a tiny tweak, but it bothered me so we fixed it.

Basically when one plots a set of X/Y coordinates in the Digitize Grid or Digitize Polygon dialogs., the software used to just fix the min/max of the X/Y data. 

But that could distort the layout if the X/Y points were not equant in extents.  So in the previous version you'd get this plot where the shape is made to look square by utilizing the actual X/Y data ranges:


But in reality (since most X/Y stages in the world are equal units in X and Y!), it now plots like this:


Of course one can still zoom in using a click-drag on the mouse, but it least the plot starts with equal distance in X and Y so as not to distort the initial plot.
« Last Edit: April 11, 2020, 10:20:32 PM by John Donovan »
John J. Donovan, Pres. 
(541) 343-3400

"Not Absolutely Certain, Yet Reliable"

John Donovan

  • Administrator
  • Emeritus
  • *****
  • Posts: 3264
  • Other duties as assigned...
    • Probe Software
Re: Latest version changes for Probe for EPMA (and CalcImage) v. 12.5.1
« Reply #123 on: November 03, 2018, 05:52:14 PM »
Lots of changes over the last month that we wanted to test carefully before releasing a new version, but our beta testers report that all seems to be working well, so Probe for EPMA v. 12.5.1 is now available for download/updating. The easiest method is to simply use the Help | Update Probe for EPMA menu in Probe for EPMA.

If you have any trouble updating PFE it's probably because of the switch to secure downloads in August this last summer. To fix this update issue, see this post here and follow the instructions:

https://probesoftware.com/smf/index.php?topic=233.msg7513#msg7513

OK, so first of all, we found and fixed a bug in the multi-point background (MPB) when utilizing the shared background method on samples with hundreds of data points. This bug was causing the software write duplicate MPB intensity data to the database, causing the software to slow down when reading sample data. That has now been fixed.  See this post for more details:

https://probesoftware.com/smf/index.php?topic=9.msg7764#msg7764

Next we modified the way the Use EDS Element Data flag is utilized in the Analyze! | Calculation Options dialog as shown here:


Basically this flag now turns EDS elements on or off for quantification. You will also note that we replaced the two EDS option buttons with a single checkbox for a cleaner look.

In addition to skipping the loading of the EDS net intensities for quant analysis, this flag now enables or disabled any elements that are specified as EDS quant elements if the user changes the status of this flag.   So for example, here is an acquisition of WDS and EDS quant on a NIST mineral glass where some elements were acquired using WDS, and some elements using EDS with new flag checked:

ELEM:       Si      Ca      Fe      Mg      Al      Mn       O
TYPE:     ANAL    ANAL    ANAL    ANAL    ANAL    SPEC    SPEC
BGDS:      LIN     LIN     EDS     EDS     EDS
TIME:    20.00   20.00   24.00   24.00   24.00     ---     ---
BEAM:    30.02   30.02   30.02   30.02   30.02     ---     ---

ELEM:       Si      Ca      Fe      Mg      Al      Mn       O   SUM 
     5  21.419  11.064   6.588  11.569   4.874    .077  43.597  99.189

AVER:   21.419  11.064   6.588  11.569   4.874    .077  43.597  99.189
SDEV:     .000    .000    .000    .000    .000    .000    .000    .000
SERR:     .000    .000    .000    .000    .000    .000    .000
%RSD:      .00     .00     .00     .00     .00     .00     .00

PUBL:   21.199  10.899   7.742  11.657   4.906    .077  43.597 100.077
%VAR:     1.04    1.52  -14.91  (-.75)  (-.64)     .00     .00
DIFF:     .220    .165  -1.154  (-.09)  (-.03)    .000    .000
STDS:      162     162     162     160     160     ---     ---

Edit: in case anyone is wondering why the above Fe quant by EDS looks so crappy, it's because the WDS counting time was only 24 sec, so the EDS live time was half that (with a 50% deadtime in this simulation). And so running the Penepma Monte Carlo code for the simulated EDS spectrum only ran for 12 seconds! And for an element such as Fe with a relatively high energy edge, the counting statistics are really poor.  I'll post an example later today with a longer counting and more than a single "measurement" to show this better.

And here with the flag unchecked:

ELEM:       Si      Ca      Fe      Mg      Al      Mn       O
TYPE:     ANAL    ANAL    ANAL    ANAL    ANAL    SPEC    SPEC
BGDS:      LIN     LIN     EDS     EDS     EDS
TIME:    20.00   20.00     ---     ---     ---     ---     ---
BEAM:    30.02   30.02     ---     ---     ---     ---     ---

ELEM:       Si      Ca    Fe-D    Mg-D    Al-D      Mn       O   SUM 
     5  19.430  11.173     ---     ---     ---    .077  43.597  74.277

AVER:   19.430  11.173     ---     ---     ---    .077  43.597  74.277
SDEV:     .000    .000     ---     ---     ---    .000    .000    .000
SERR:     .000    .000     ---     ---     ---    .000    .000
%RSD:      .00     .00     ---     ---     ---     .00     .00

PUBL:   21.199  10.899    n.a.    n.a.    n.a.    .077  43.597 100.077
%VAR:    -8.34    2.52     ---     ---     ---     .00     .00
DIFF:   -1.769    .274     ---     ---     ---    .000    .000
STDS:      162     162     ---     ---     ---     ---     ---

Note that the elements by EDS have been "disabled".  However, even though this flag for using EDS elements for quant is unchecked, one can still obtain the EDS net intensities using the Raw Data button as seen here:

On-Peak (off-peak corrected) or EDS (bgd corrected) or MAN On-Peak X-ray Counts (cps/1nA) (and Faraday/Absorbed Currents):
ELEM:    si ka   ca ka   fe ka   mg ka   al ka   BEAM1   BEAM2
BGD:       OFF     OFF     EDS     EDS     EDS
SPEC:        1       2       0       0       0
CRYST:     PET    LPET     EDS     EDS     EDS
ORDER:       1       1       1       1       1
    5G   56.93   33.28    2.82   22.62    9.75  30.016  29.974

AVER:    56.93   33.28    2.82   22.62    9.75  30.016  29.974

In addition, the software now automatically turns on this flag when EDS elements are added to the sample. Also, it sets another flag to automatically force re-loading of the standard intensity arrays for quantitative analysis the next time a quant is performed.  These changes should not only make it much easier to perform WDS and EDS quant, but also allows the user to "turn off" any EDS elements without having to go into the Elements/Cations dialog and set the enable/disable flag for each EDS element. Of course one can still do that, but this new change makes it much easier.   And we like easy!

Oh, and I almost forgot, the software now automatically disables the TDI option for elements acquired using EDS spectra.  This was a bug where the software would turn on TDI for all elements that were acquired first on each spectrometer, which included elements by EDS, and then one had to go in and turn off the TDI correction for the EDS elements manually.  So now this is handled automatically!

Furthermore there is now a new global flag that completely turns off the EDS get net intensity interface, as seen here:


This new flag could be useful if you have some samples with some elements (minor elements?) quantified using EDS, but where you need to process the data away from the lab and don't have access to EDS software or server.  Fortunately one can install the Thermo or Bruker software for off-line processing on any computer, so this shouldn't really be a problem.

But it may be helpful for the upcoming JEOL EDS API, because the JEOL EDS API only accesses the JEOL server on the JEOL EPMA computer, where the original EDS spectrum file is stored, in order to obtain the EDS net intensities.  We are hopeful that eventually we can persuade JEOL to provide an off-line version of their peak stripping program and have it utilize the already stored EDS spectrum in our database for the reprocessing of JEOL EDS spectra on off-line computers that are not on the JEOL instrument network.

We also replaced the Acquire EDS (and CL) spectra option controls with checkbox controls , again, for a cleaner look as seen here in the Acquisition Options dialog:


I think that is all for now.  So please update Probe for EPMA to v. 12.5.1 when you are ready to, and feel free let us know how everything works.  We love hearing from our users!   :)
« Last Edit: November 04, 2018, 10:43:32 AM by John Donovan »
John J. Donovan, Pres. 
(541) 343-3400

"Not Absolutely Certain, Yet Reliable"

John Donovan

  • Administrator
  • Emeritus
  • *****
  • Posts: 3264
  • Other duties as assigned...
    • Probe Software
Re: Latest version changes for Probe for EPMA (and CalcImage) v. 12.5.6
« Reply #124 on: December 27, 2018, 09:11:24 AM »
This is a small thing, but we noticed recently that when plotting up multiple position samples from the Automate! window, the display could be better.

So the latest version of Probe for EPMA (12.5.6) now has improved code to plot multiple samples positions using the Plot button from the Automate! window as seen here:

John J. Donovan, Pres. 
(541) 343-3400

"Not Absolutely Certain, Yet Reliable"

John Donovan

  • Administrator
  • Emeritus
  • *****
  • Posts: 3264
  • Other duties as assigned...
    • Probe Software
Re: Latest version changes for Probe for EPMA (and CalcImage) v. 12.5.8
« Reply #125 on: February 20, 2019, 12:55:27 PM »
We recently improved the display of the stage limits in PictureSnapApp when the sample is rotated with respect to the image, as described here:

https://probesoftware.com/smf/index.php?topic=1177.0

And in the latest version of Probe for EPMA we also added support for display of rotated stage limits in the PictureSnap feature in Probe for EPMA:


If you look really close you can see that the stage limits (in yellow) are rotated very slightly in the image (about 0.6 degrees).

Also FYI, we fixed a minor bug in the MPB background method (in the Elements/Cations dialog), and improved a warning message for the spectral interference correction as suggested by Owen Neill and Probeman, and described in the latest of the version.txt file available in the current update and also here:

https://probesoftware.com/smf/index.php?topic=40.0
John J. Donovan, Pres. 
(541) 343-3400

"Not Absolutely Certain, Yet Reliable"

John Donovan

  • Administrator
  • Emeritus
  • *****
  • Posts: 3264
  • Other duties as assigned...
    • Probe Software
Re: Latest version changes for Probe for EPMA (and CalcImage) v. 12.5.8
« Reply #126 on: March 02, 2019, 10:27:29 AM »
Late last year we modified the TDI acquisition code to *not* automatically turn on TDI corrections for EDS elements. Eventually we may add TDI corrections for EDS elements to Probe for EPMA, but currently this capability is not available.

Recently Owen Neill reported that one of his users was getting an error message for an unknown sample that there was no TDI data for an EDS element, and that turning off the Use TDI Intensities option for the EDS element did not prevent the error message.

The problem turned out to be that one of the primary standards assigned to this unknown sample also had the Use TDI Intensities option turned on, and that was the actual culprit causing the error message. The difficulty was that the error message reported the sample row number, along with the data row and channel number, which isn't as user friendly as it could be.

To alleviate this misunderstanding for users (especially those processing old probe runs with both TDI and EDS spectrum acquisitions), we added additional information with regards to the actual sample name, etc. which is causing the error message as seen here:


This should help in the future.  Download now using the Help | Update Probe for EPMA menu for this latest version of Probe for EPMA.
« Last Edit: March 03, 2019, 12:33:04 PM by John Donovan »
John J. Donovan, Pres. 
(541) 343-3400

"Not Absolutely Certain, Yet Reliable"

John Donovan

  • Administrator
  • Emeritus
  • *****
  • Posts: 3264
  • Other duties as assigned...
    • Probe Software
Re: Latest version changes for Probe for EPMA (and CalcImage) v. 12.6.9
« Reply #127 on: July 25, 2019, 12:23:23 PM »
The latest version of Probe for EPMA (12.6.9) now requires the v. 2.46 of the Ocean Optics OMNI driver for integration of CL spectrum acquisition.

This is because previous versions of the Ocean Optics OMNI driver were not properly signed for Windows 10.  The v. 2.46 Ocean Optics OMNI driver is properly signed for Windows 10 (and Windows 8.x if anyone is still using that!).

Please contact support@probesoftware if you have any questions about our integration of EDS and/or CL spectrum acquisition.  Or post them here if you prefer.
John J. Donovan, Pres. 
(541) 343-3400

"Not Absolutely Certain, Yet Reliable"

John Donovan

  • Administrator
  • Emeritus
  • *****
  • Posts: 3264
  • Other duties as assigned...
    • Probe Software
Re: Latest version changes for Probe for EPMA (and CalcImage) v. 12.7.3
« Reply #128 on: September 05, 2019, 04:10:06 PM »
As suggested by Dave Adams at the USGS Denver, we added an option to the user specified output that converts all the column headings to be "machine readable". Apparently this means no "special" characters such as spaces, commas, colons, percent signs, etc.:

\

Download v. 12.7.3 of PFE to get this mod. Also see first post in this topic for additional changes to the program.
John J. Donovan, Pres. 
(541) 343-3400

"Not Absolutely Certain, Yet Reliable"

John Donovan

  • Administrator
  • Emeritus
  • *****
  • Posts: 3264
  • Other duties as assigned...
    • Probe Software
Re: Latest version changes for Probe for EPMA (and CalcImage) v. 12.7.5
« Reply #129 on: September 18, 2019, 05:07:24 PM »
As many of you know Probe for EPMA can acquire EDS spectra from Bruker and Thermo SDD EDS detectors and store the spectra in the user's probe data (MDB) file for subsequent quantitative processing of WDS and EDS (or EDS only) elements for unknown and standard samples. We are currently beta testing the EDS spectra interface to JEOL SDD EDS detectors and it is looking good.

Also, as you all know, Probe for EPMA can be freely installed on any computer or laptop, for performing WDS data analysis and output simply by copying your probe data file over to the off-line computer.

In addition, Probe for EPMA can also reprocess EDS spectra for quantitative analysis of elements by EDS for off-line analysis on other computers, but until now this has required that the Thermo or Bruker software also be installed (in addition to the Probe for EPMA software), on the off-line computer or laptop for obtaining the EDS net intensities for quantification of unknowns and standards.

We feel this it is good to get the net intensities from the EDS software because the peak stripping procedures are best performed by the OEM routines. And because Thermo, and more recently Bruker, now also allow their software to be installed on any computer for off-line processing, this provides fantastic portability for your EPMA WDS and EDS data.

Unfortunately reprocessing of JEOL EDS spectra requires access to the original EDS file saved on the JEOL EPMA computer connected to the instrument, which is generally not available to off-line computers in your office or home.

To avoid getting an error when performing elements quantified by EDS on an off-line computer when the Bruker, Thermo or JEOL software is unavailable, the user would have to either disable those elements for quantification in the Analyze! window from the Elements/Cations dialog, or use this checkbox in the Analytical | Analysis Options menu dialog, which then tells PFE to skip accessing the EDS interface, and then all elements by EDS would return a zero intensity/concentration:


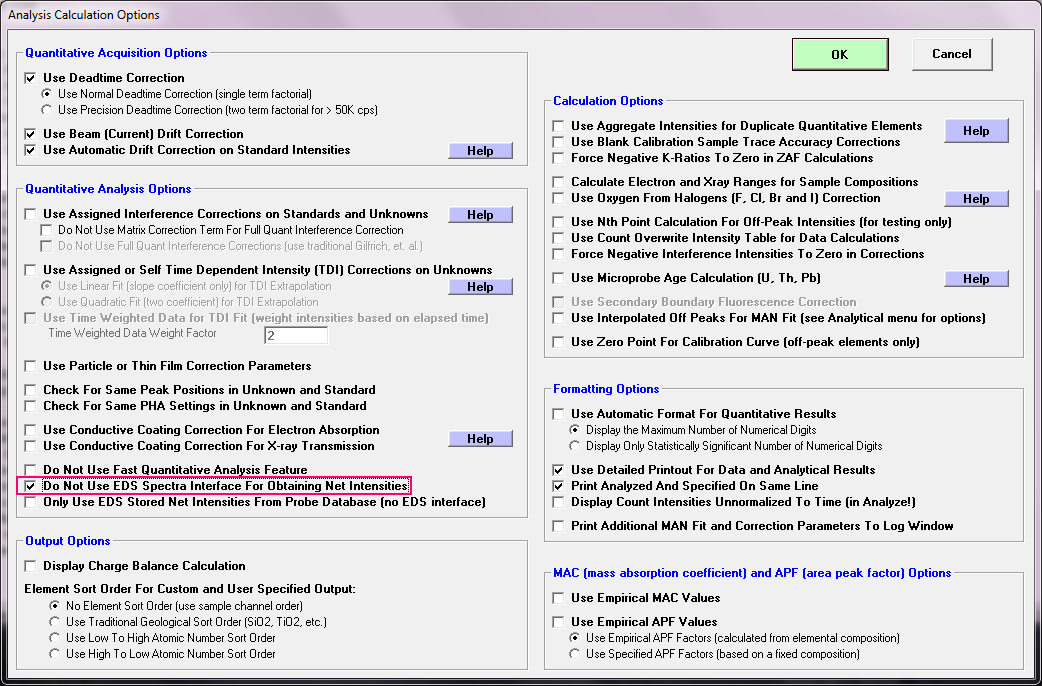
Not an altogether satisfactory solution actually.

Meanwhile, Gareth Seward and several others had a bright idea. Why not somehow store these returned EDS net intensities so that they can be accessed locally from Probe for EPMA even if the Thermo, Bruker or JEOL software is not available, and after a bit of thought, we think we have found a solution.

The trick was to utilize the same database tables already used in simulation mode for acquisition of EDS spectra from the Penepma Monte Carlo simulations. If you haven't tried the simulated EDS acquisition and quantification in Probe for EPMA, see here for more details:

https://probesoftware.com/smf/index.php?topic=837.msg7796;topicseen#msg7796

Basically when Penepma calculates a spectrum, it automatically generates a file called pe-intens-01.dat, which contains the photon intensities for any inner shell emissions that occur during the simulation. These are in fact the emission line net intensities. So there is no need to "peak strip" the Penepma spectrum, because Penepma already knows where each photon came from! We did have to deal with a calculation of the continuum intensities for each emission line to provide realistic statistics however.

Anyway, starting in PFE v. 12.7.5 whenever we obtain the net intensities for an element quantified by EDS from the Bruker, Thermo or JEOL software, we automatically store those net intensities in the same database table used by Penepma. It's so *simple*!  ;D

So as long as the elements by EDS were specified when Probe for EPMA was connected to the Bruker, Thermo or JEOL software, those EDS net intensities will be available for off-line use on any computer, even without the Bruker, Thermo or JEOL software. All one needs to do is to check this new box in the Analytical | Analysis Option menu dialog as seen here:


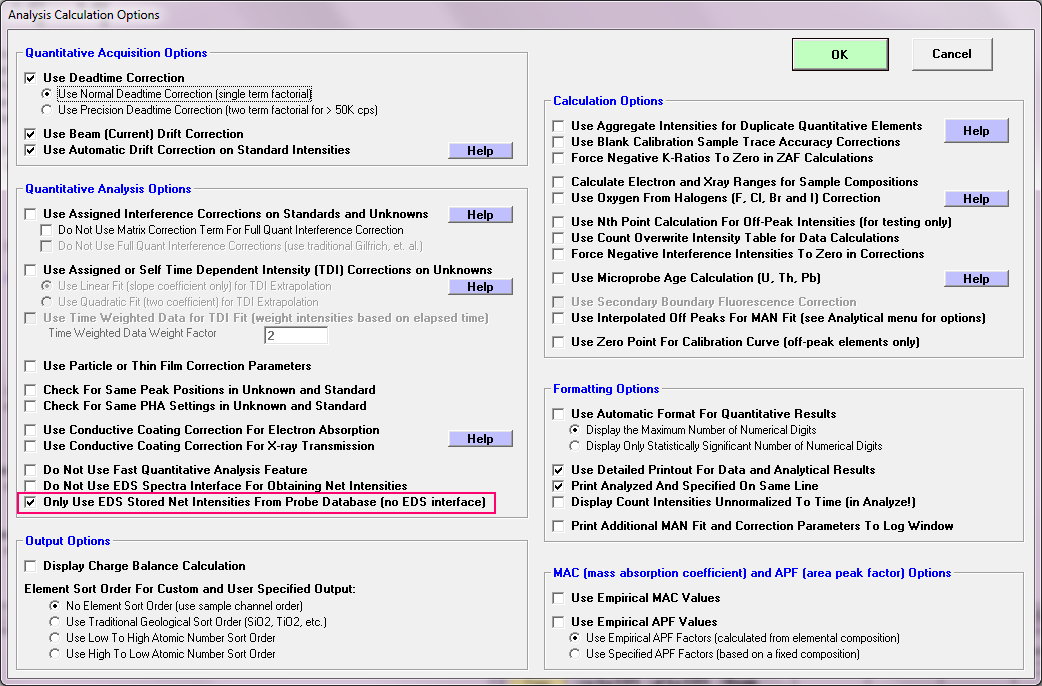
Now there is one caveat when using this feature. And that is, if one adds a *new* element to be quantified by EDS on the off-line computer, and that computer is not running the Bruker or Thermo software, or is not connected to the JEOL probe computer, those net intensities will always return zero net intensities and hence concentrations.

That is, until that probe data MDB file is re-opened on a computer running or connected to the Bruker, Thermo or JEOL computer and the Use Stored EDS Net Intensities checkbox is unchecked. Then the stored net intensity table will be updated again.

But there is one other major benefit of this checkbox. Once these net intensities are obtained and stored, one simply checks the  Use Stored EDS Net Intensities checkbox, and now the calculations will proceed lightning fast because the net intensities are already extracted and locally available.

Oh, and by the way, this table is available for *all* Probe for EPMA MDB data files since version 11.78!  It's actually backward compatible!  Who would have thunk it?

Try this new feature out on an older PFE data file (v. 11.78 or newer) containing EDS spectra and elemnts to be quantified by EDS, using the latest v. 12.75 of PFE. To update the stored net intensity tables, simply open the old MDB file on your probe computer or any computer running the Bruker, or Thermo software or connected to the JEOL probe computer, go to the Analyze! window, select all samples, and click the Raw Data button. The software will output all WDS and EDS sample data to the log window, but in the background it will be saving all net intensities automatically.

Then go to the Analytical | Analysis Options menu dialog and check the Stored EDS Net Intensities checkbox. Now analyze some samples and see how fast it performs the quant calculation.
« Last Edit: September 18, 2019, 05:10:26 PM by John Donovan »
John J. Donovan, Pres. 
(541) 343-3400

"Not Absolutely Certain, Yet Reliable"

John Donovan

  • Administrator
  • Emeritus
  • *****
  • Posts: 3264
  • Other duties as assigned...
    • Probe Software
Re: Latest version changes for Probe for EPMA (and CalcImage) v. 12.7.6
« Reply #130 on: September 25, 2019, 05:35:11 PM »
We need to apologize to everyone who has utilized any of the 10 different matrix corrections in Probe for EPMA other than the default "Phi(pz) Absorption of Armstrong/Packwood-Brown 1981 MAS" in any complex probe runs.

Philipp Poeml wrote to us recently saying that the analysis calculations were running very slowly, so we asked him to send the an example data file with the issue. When we loaded it up and clicked the Analyze button on a sample, we saw that he had around 25 elements and as many standards, so the std k-factor calculation indeed took some time (particularly because he had duplicate elements and in this situation PFE has to calculate each emission line separately for the standard k-factors to be accurate).

But then we said, well, once these std k-factors are calculated it will go much faster, so after the std k-factors were calculated we again clicked the Analyze button and to our amazement we saw the program *again* calculate all the std k-factors!

Now if you're running say 10 or 12 elements and 8 or 10 standards you're probably not even going to notice as the calculation normally goes pretty fast, but with this 25 elements and this many standards (and because there were duplicate elements), it takes a bit of time.  But why was it re-calculating the standard k-factors again?  It should only have to do re-calculate the standard k-factors if one selects a different matrix correction method!

But in looking at the code we immediately saw the problem and it has to do with the option to "Calculate All Matrix Corrections" in the Analyze! window.  Even though we weren't calculating all matrix corrections!  Basically, if the current matrix correction is the default "Phi(pz) Absorption of Armstrong/Packwood-Brown 1981 MAS", the flag works just fine, and the code skips re-calculating the matrix corrections (unless of course the analyzed elements are different for example). But if you are using another matrix correction for the default matrix correction, such as PAP or XPP, it was resetting a flag to force a re-calculation of the std k-factors!

Again, we're very sorry about this, but if you update to PFE v. 12.7.6 you should see a significant improvement in analysis speed particularly for large runs with lots of elements and standards. That is if you're not using the default Armstrong pr(z) matrix correction.
« Last Edit: September 25, 2019, 10:20:41 PM by John Donovan »
John J. Donovan, Pres. 
(541) 343-3400

"Not Absolutely Certain, Yet Reliable"

Philipp Poeml

  • Professor
  • ****
  • Posts: 219
Re: Latest version changes for Probe for EPMA (and CalcImage) v. 12.7.6
« Reply #131 on: September 26, 2019, 09:14:13 AM »
Hi John,

"we" is you and Probeman?  :P
Why would duplicate elements make the calculation especially slow? You mention that several times in your post.

Cheers
Philipp

John Donovan

  • Administrator
  • Emeritus
  • *****
  • Posts: 3264
  • Other duties as assigned...
    • Probe Software
Re: Latest version changes for Probe for EPMA (and CalcImage) v. 12.7.6
« Reply #132 on: September 26, 2019, 09:28:27 AM »
Hi John,

Why would duplicate elements make the calculation especially slow? You mention that several times in your post.

Cheers
Philipp

The calculation of standard k-factors with duplicate elements isn't "especially slow", maybe a little slower. What you and I were seeing in your run is mostly an effect from having lots of elements and lots of standards. And of course the calculate std k-factors flag getting reset each time... which is now fixed.

The reason one has to calculate the standard k-factors differently when duplicate elements are present is that if one includes concentrations from duplicate elements, the composition will be non-physical and the wrong std k-factors will get calculated.  The same thing occurs of course for the unknown sample, but it doesn't affect things much if the duplicate elements are present in trace concentrations.

In the case of (primary) standards however, our trace element is usually present in high concentrations, therefore instead of calculating the emission physics for all elements in the standard at once, the program calculates the std k-factors for each standard in an element loop where only one element at a time is specified as an emitter, and the other elements are set to "specified" concentrations.

The latest code always is on Github but I paste it here also. Here is the code when no duplicate elements are present:

Code: [Select]
Sub UpdateCalculate(row As Integer, num As Integer, analysis As TypeAnalysis, sample() As TypeSample, stdsample() As TypeSample)
' Loads a single standard stdsample array and calculates k-ratios
'   "row" is the standard position in the standard list
'   "num" is the standard number

ierror = False
On Error GoTo UpdateCalculateError

' New std k-factor calculation  code for samples with duplicate elements (with different x-ray lines or different kilovolts!)
If MiscIsElementDuplicatedAndXrayOrKilovoltsDifferent(sample()) Then
Call UpdateCalculate2(row%, num%, analysis, sample(), stdsample)
If ierror Then Exit Sub
Exit Sub
End If

' Update the standard for current sample conditions
Call UpdateCalculateUpdateStandard2(num%, sample(), stdsample())
If ierror Then Exit Sub

' Reload the element arrays for the current sample
If sample(1).LastElm% > 0 Then
Call ElementGetData(sample())
If ierror Then Exit Sub

' Calculate the standard k factors for this standard (also calculate ZAF for calibration curve for demo mode)
If CorrectionFlag% = 0 Or CorrectionFlag% = 5 Then
Call ZAFStd2(row%, analysis, sample(), stdsample())
If ierror Then Exit Sub
ElseIf CorrectionFlag% = MAXCORRECTION% Then
'Call ZAFStd3(row%, analysis, sample(), stdsample())
'If ierror Then Exit Sub
End If

' Calculate the standard beta factors for this standard (0 = phi/rho/z, 1,2,3,4 = alpha fits, 5 = calilbration curve, 6 = fundamental parameters)
If CorrectionFlag% > 0 And CorrectionFlag% < 5 Then
Call AFactorStd(row%, analysis, sample(), stdsample())
If ierror Then Exit Sub
End If
End If

Exit Sub

' Errors
UpdateCalculateError:
MsgBox Error$, vbOKOnly + vbCritical, "UpdateCalculate"
ierror = True
Exit Sub

End Sub

Here is the version for when duplicate elements are present:

Code: [Select]
Sub UpdateCalculate2(row As Integer, num As Integer, analysis As TypeAnalysis, sample() As TypeSample, stdsample() As TypeSample)
' Loads a single standard stdsample array and calculates k-ratios (version to handle duplicate elements)
'   "row" is the standard position in the standard list
'   "num" is the standard number

ierror = False
On Error GoTo UpdateCalculate2Error

Dim chan As Integer, i As Integer, j As Integer, ip As Integer

' Get standard composition and cations from the standard database and load in stdsample arrays
If num% > 0 Then
Call StandardGetMDBStandard(num%, stdsample())
If ierror Then Exit Sub

' Load standard as unknown composition if stdnum is zero (random composition)
Else
Call StandardGetMDBStandard(num%, sample())
If ierror Then Exit Sub
stdsample(1) = sample(1)
End If

' Loop on each analyzed element in original sample and load standard composition
For chan% = 1 To sample(1).LastElm%

' Skip disable quant element
If sample(1).DisableQuantFlag%(chan%) = 0 Then

' Skip duplicate element
ip% = IPOS8A(chan%, sample(1).Elsyms$(chan%), sample(1).Xrsyms$(chan%), sample(1).KilovoltsArray!(chan%), sample()) ' find if element is duplicated
If Not UseAggregateIntensitiesFlag Or (UseAggregateIntensitiesFlag And ip% = 0) Then

' Loop on each analyzed element in original sample and calculate standard k-factors *one element at a time*
If VerboseMode% Then
msg$ = vbCrLf & vbCrLf & "Calculating standard k-factors for " & Str$(chan%) & " " & sample(1).Elsyms$(chan%) & " " & sample(1).Xrsyms$(chan%) & ", " & Str$(sample(1).MotorNumbers%(chan%)) & " " & sample(1).CrystalNames$(chan%) & ", " & Format$(sample(1).TakeoffArray!(chan%)) & " " & Format$(sample(1).KilovoltsArray!(chan%))
Call IOWriteLog(msg$)
End If

' Load passed sample into temp std sample
UpdateStdSample(1) = sample(1)

' Now zero out concentrations (in case any are loaded) and specifiy as fixed concentrations
For i% = 1 To UpdateStdSample(1).LastChan%
UpdateStdSample(1).ElmPercents!(i%) = NOT_ANALYZED_VALUE_SINGLE!                                 ' use a non-zero value
Next i%

If VerboseMode% Then
msg$ = vbCrLf & "Standard " & Format$(num%) & ", (original sample):"
Call IOWriteLog(msg$)
For i% = 1 To UpdateStdSample(1).LastChan%
msg$ = Str$(i%) & " " & UpdateStdSample(1).Elsyms$(i%) & " " & UpdateStdSample(1).Xrsyms$(i%) & Str$(UpdateStdSample(1).MotorNumbers%(i%)) & " " & UpdateStdSample(1).CrystalNames$(i%) & ", " & Format$(UpdateStdSample(1).TakeoffArray!(i%)) & " " & Format$(UpdateStdSample(1).KilovoltsArray!(i%))
Call IOWriteLog(msg$)
Next i%
End If

' Now check for elements in the standard that are not in the sample, and add them if necesssary as specified elements
For j% = 1 To stdsample(1).LastChan%
'ip% = IPOS1(UpdateStdSample(1).LastChan%, stdsample(1).Elsyms$(j%), UpdateStdSample(1).Elsyms$())         ' only check element
ip% = IPOS9(stdsample(1).Elsyms$(j%), UpdateStdSample())                                         ' only check first not disabled occurance of element to load concentration
If ip% = 0 Then
If UpdateStdSample(1).LastChan% + 1 > MAXCHAN% Then GoTo UpdateCalculate2TooManyElements

' Add the standard element to the sample element arrays as a specified element
UpdateStdSample(1).LastChan% = UpdateStdSample(1).LastChan% + 1
UpdateStdSample(1).Elsyms$(UpdateStdSample(1).LastChan%) = stdsample(1).Elsyms$(j%)
UpdateStdSample(1).Xrsyms$(UpdateStdSample(1).LastChan%) = vbNullString
UpdateStdSample(1).MotorNumbers%(UpdateStdSample(1).LastChan%) = 0
UpdateStdSample(1).CrystalNames$(UpdateStdSample(1).LastChan%) = vbNullString
UpdateStdSample(1).numcat%(UpdateStdSample(1).LastChan%) = stdsample(1).numcat%(j%)
UpdateStdSample(1).numoxd%(UpdateStdSample(1).LastChan%) = stdsample(1).numoxd%(j%)
UpdateStdSample(1).AtomicCharges!(UpdateStdSample(1).LastChan%) = stdsample(1).AtomicCharges!(j%)
UpdateStdSample(1).TakeoffArray!(UpdateStdSample(1).LastChan%) = 0#
UpdateStdSample(1).KilovoltsArray!(UpdateStdSample(1).LastChan%) = 0#
End If
Next j%

' Now make all elements specified
For i% = 1 To UpdateStdSample(1).LastChan%
UpdateStdSample(1).Xrsyms$(i%) = vbNullString
UpdateStdSample(1).MotorNumbers%(i%) = 0
UpdateStdSample(1).CrystalNames$(i%) = vbNullString
UpdateStdSample(1).TakeoffArray!(i%) = 0#
UpdateStdSample(1).KilovoltsArray!(i%) = 0#
Next i%

If VerboseMode% Then
msg$ = vbCrLf & "Standard " & Format$(num%) & ", (before update for standard composition):"
Call IOWriteLog(msg$)
For i% = 1 To UpdateStdSample(1).LastChan%
msg$ = Str$(i%) & " " & UpdateStdSample(1).Elsyms$(i%) & " " & UpdateStdSample(1).Xrsyms$(i%) & Str$(UpdateStdSample(1).MotorNumbers%(i%)) & " " & UpdateStdSample(1).CrystalNames$(i%) & ", " & Format$(UpdateStdSample(1).TakeoffArray!(i%)) & " " & Format$(UpdateStdSample(1).KilovoltsArray!(i%))
Call IOWriteLog(msg$)
Next i%
End If

' Now load standard concentrations for all elements other than the current element
For j% = 1 To stdsample(1).LastChan%
If UCase$(stdsample(1).Elsyms$(j%)) <> UCase$(sample(1).Elsyms$(chan%)) Then                       ' skip loading concentration for current element (it might be duplicated)
ip% = IPOS1(UpdateStdSample(1).LastChan%, stdsample(1).Elsyms$(j%), UpdateStdSample(1).Elsyms$())  ' load first occurrance of all elements in standard
If ip% > 0 Then
UpdateStdSample(1).ElmPercents!(ip%) = stdsample(1).ElmPercents!(j%)                               ' load concentration from standard database
End If
End If
Next j%

' Now load the concentration for the current element in the current sample for ZAFStd calculations
ip% = IPOS1(stdsample(1).LastChan%, sample(1).Elsyms$(chan%), stdsample(1).Elsyms$())
If ip% > 0 Then
UpdateStdSample(1).ElmPercents!(chan%) = stdsample(1).ElmPercents!(ip%)                            ' load concentration from standard database if present in standard composition
End If
UpdateStdSample(1).Xrsyms$(chan%) = sample(1).Xrsyms$(chan%)                                       ' load original x-ray line (still in original sample order)
UpdateStdSample(1).MotorNumbers%(chan%) = sample(1).MotorNumbers%(chan%)                           ' load original sample spectrometer number (still in original sample order)
UpdateStdSample(1).CrystalNames$(chan%) = sample(1).CrystalNames$(chan%)                           ' load original sample crystal name (still in original sample order)
UpdateStdSample(1).TakeoffArray!(chan%) = sample(1).TakeoffArray!(chan%)                           ' load original sample takeoff angle (still in original sample order)
UpdateStdSample(1).KilovoltsArray!(chan%) = sample(1).KilovoltsArray!(chan%)                       ' load original sample kilovolts (still in original sample order)

If VerboseMode% Then
msg$ = vbCrLf & "Standard " & Format$(num%) & ", (after update for standard concentrations):"
Call IOWriteLog(msg$)
For i% = 1 To UpdateStdSample(1).LastChan%
msg$ = Str$(i%) & " " & UpdateStdSample(1).Elsyms$(i%) & " " & UpdateStdSample(1).Xrsyms$(i%) & Str$(UpdateStdSample(1).MotorNumbers%(i%)) & " " & UpdateStdSample(1).CrystalNames$(i%) & ", " & Format$(UpdateStdSample(1).TakeoffArray!(i%)) & " " & Format$(UpdateStdSample(1).KilovoltsArray!(i%)) & ", " & Format$(UpdateStdSample(1).ElmPercents!(i%))
Call IOWriteLog(msg$)
Next i%
End If

' Re-order standard sample because all except one x-ray line was changed to unanalyzed
Call GetElmSaveSampleOnly(Int(1), UpdateStdSample(), Int(0), Int(0))
If ierror Then Exit Sub

If VerboseMode% Then
msg$ = vbCrLf & "Standard " & Str$(num%) & ", (after sort):"
Call IOWriteLog(msg$)
For i% = 1 To UpdateStdSample(1).LastChan%
msg$ = Str$(i%) & " " & UpdateStdSample(1).Elsyms$(i%) & " " & UpdateStdSample(1).Xrsyms$(i%) & Str$(UpdateStdSample(1).MotorNumbers%(i%)) & " " & UpdateStdSample(1).CrystalNames$(i%) & ", " & Format$(UpdateStdSample(1).TakeoffArray!(i%)) & " " & Format$(UpdateStdSample(1).KilovoltsArray!(i%)) & ", " & Format$(UpdateStdSample(1).ElmPercents!(i%))
Call IOWriteLog(msg$)
Next i%
Call IOWriteLog(vbNullString)
End If

' Update some standard sample parameters for ZAFStd calculation
UpdateStdSample(1).number% = num%
UpdateStdSample(1).OxideOrElemental% = 2      ' always calculate standard k-factors as elemental

' Reload the element arrays for the current sample
If UpdateStdSample(1).LastElm% > 0 Then
Call ElementGetData(UpdateStdSample())
If ierror Then Exit Sub

' Calculate the standard k factors for this standard (also calculate ZAF for calibration curve for demo mode)
If CorrectionFlag% = 0 Or CorrectionFlag% = 5 Then
Call ZAFStd2(row%, analysis, sample(), UpdateStdSample())
If ierror Then Exit Sub
ElseIf CorrectionFlag% = MAXCORRECTION% Then
'Call ZAFStd3(row%, analysis, sample(), UpdateStdSample())
'If ierror Then Exit Sub
End If

' Calculate the standard beta factors for this standard (0 = phi/rho/z, 1,2,3,4 = alpha fits, 5 = calilbration curve, 6 = fundamental parameters)
If CorrectionFlag% > 0 And CorrectionFlag% < 5 Then
Call AFactorStd(row%, analysis, sample(), UpdateStdSample())
If ierror Then Exit Sub
End If
End If

' Print out StdZAFCors for MAN dialog (continuum absorption correction)
If DebugMode And VerboseMode Then
Call IOWriteLog("UpdateCalculate2: Standard " & Format$(num%) & " " & StandardNames$(row%) & ", " & sample(1).Elsyms$(chan%) & " " & sample(1).Xrsyms$(chan%) & ", " & Format$(sample(1).TakeoffArray!(chan%)) & " " & Format$(sample(1).KilovoltsArray!(chan%)))
For i% = 1 To sample(1).LastElm%
ip% = IPOS14(i%, sample(), UpdateStdSample())  ' check element, xray, take-off and kilovolts (only one element will qualify at a time)
If ip% > 0 Then
msg$ = UpdateStdSample(1).Elsyms$(ip%) & " " & UpdateStdSample(1).Xrsyms$(ip%) & ", " & Format$(UpdateStdSample(1).TakeoffArray!(ip%)) & " " & Format$(UpdateStdSample(1).KilovoltsArray!(ip%)) & ", " & Format$(UpdateStdSample(1).ElmPercents!(ip%)) & ", " & Format$(analysis.StdZAFCors!(1, row%, ip%)) & ", " & Format$(analysis.StdContinuumCorrections!(row%, ip%))
Call IOWriteLog(msg$)
End If
Next i%
End If

' Re-set current element to specified
UpdateStdSample(1).ElmPercents!(chan%) = NOT_ANALYZED_VALUE_SINGLE!
UpdateStdSample(1).Xrsyms$(chan%) = vbNullString
UpdateStdSample(1).TakeoffArray!(chan%) = 0#
UpdateStdSample(1).KilovoltsArray!(chan%) = 0#

' Calculate std k-factors for next original sample element
End If
End If
Next chan%

Exit Sub

' Errors
UpdateCalculate2Error:
MsgBox Error$, vbOKOnly + vbCritical, "UpdateCalculate2"
ierror = True
Exit Sub

UpdateCalculate2TooManyElements:
msg$ = "Too many elements in standard number " & Str$(stdsample(1).number%)
MsgBox msg$, vbOKOnly + vbExclamation, "UpdateCalculate2"
ierror = True
Exit Sub

End Sub
« Last Edit: September 26, 2019, 09:33:47 AM by John Donovan »
John J. Donovan, Pres. 
(541) 343-3400

"Not Absolutely Certain, Yet Reliable"

Philipp Poeml

  • Professor
  • ****
  • Posts: 219
Re: Latest version changes for Probe for EPMA (and CalcImage) v. 12.7.6
« Reply #133 on: September 26, 2019, 09:40:37 AM »
Ok, thanks, I see.
What if the second instance of the duplicate element is flagged "disable quant"?Then everything could be handled as if there was each element only once?

John Donovan

  • Administrator
  • Emeritus
  • *****
  • Posts: 3264
  • Other duties as assigned...
    • Probe Software
Re: Latest version changes for Probe for EPMA (and CalcImage) v. 12.7.6
« Reply #134 on: September 26, 2019, 09:51:43 AM »
By necessity the Disable Quant flag only applies to the calculation of elements in unknowns, not in standards.

Think of it this way: even if an element is disabled for quantification in an unknown, you'd still want that element utilized in the std k-factor calculation, if it is present in that standard composition.
John J. Donovan, Pres. 
(541) 343-3400

"Not Absolutely Certain, Yet Reliable"