I did CL spectral imaging on some zircon grains and a colleague followed up with some major and trace element analyses with PFE. He changed conditions along the way so that the second set of points (ganged-up spectrometers, long count times, additional elements and so forth) are those that I wish to correlate with the CL data.
Because the stage positions are similar between the first and second set of analyses it makes reading the analysis numbers off the locator image difficult.
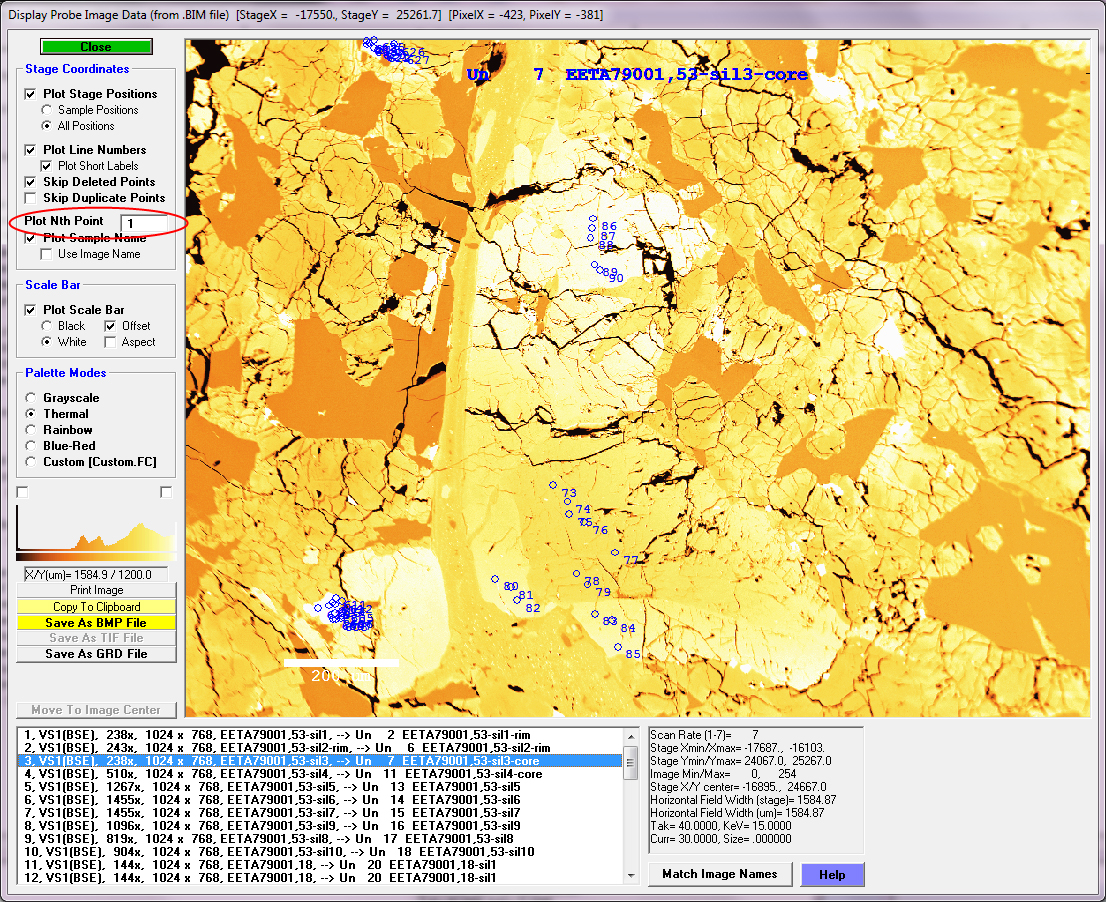
Here is an example where the analysis labels are difficult to read (lower left quadrant of image):
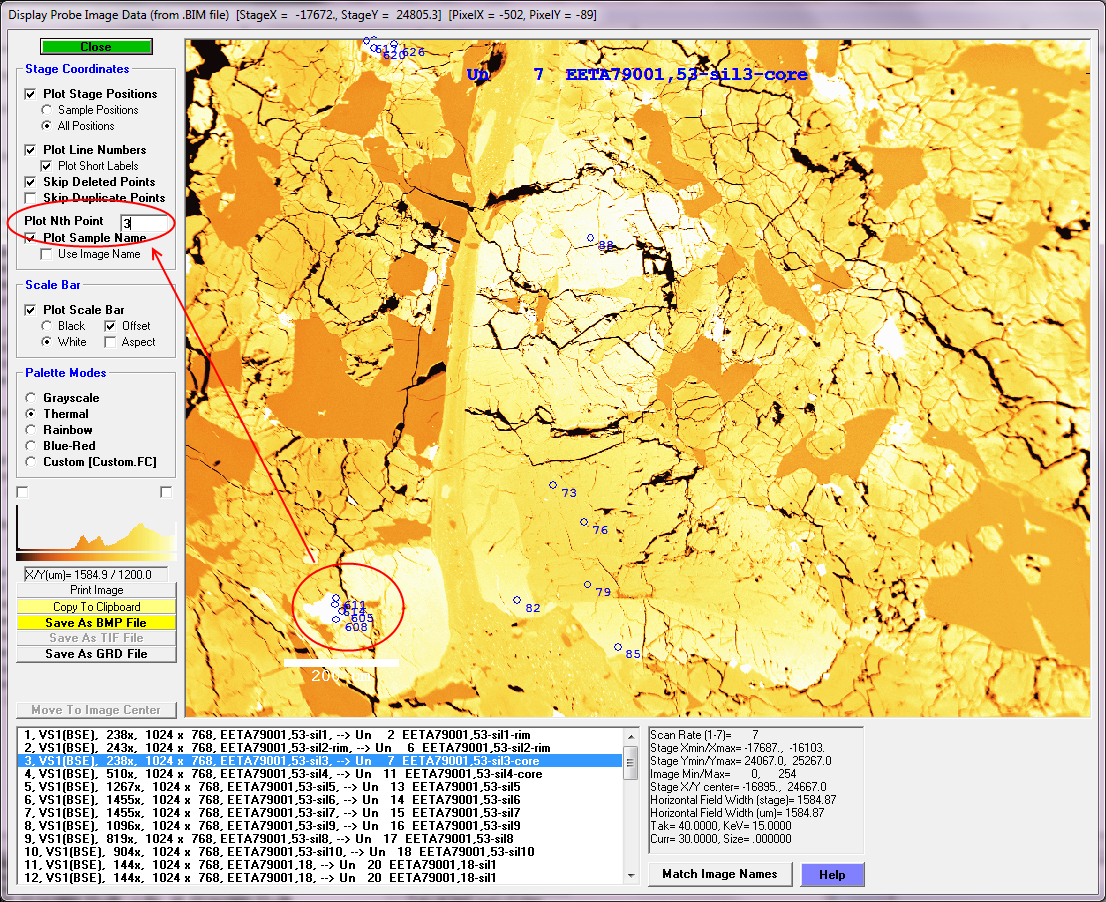
There are several aids for this situation. First, from the Run | Display, Export or Annotate Image menu, one may increase the "Nth" point option, so we get fewer points displayed, but the labels are more readable as seen here:
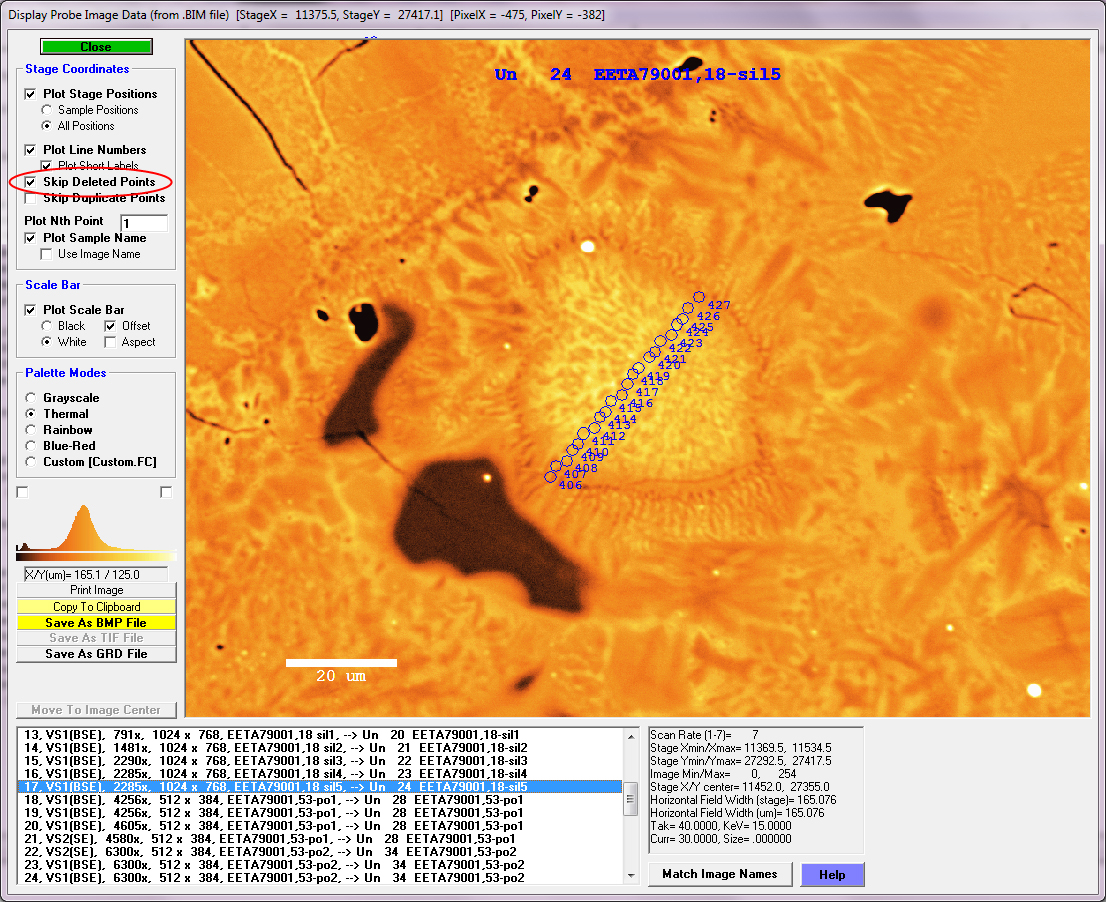
Note also that one may toggle points displayed by using the "Skip Deleted Points" option here (and alternately delete and undelete the points to be displayed from the Analyze! window):
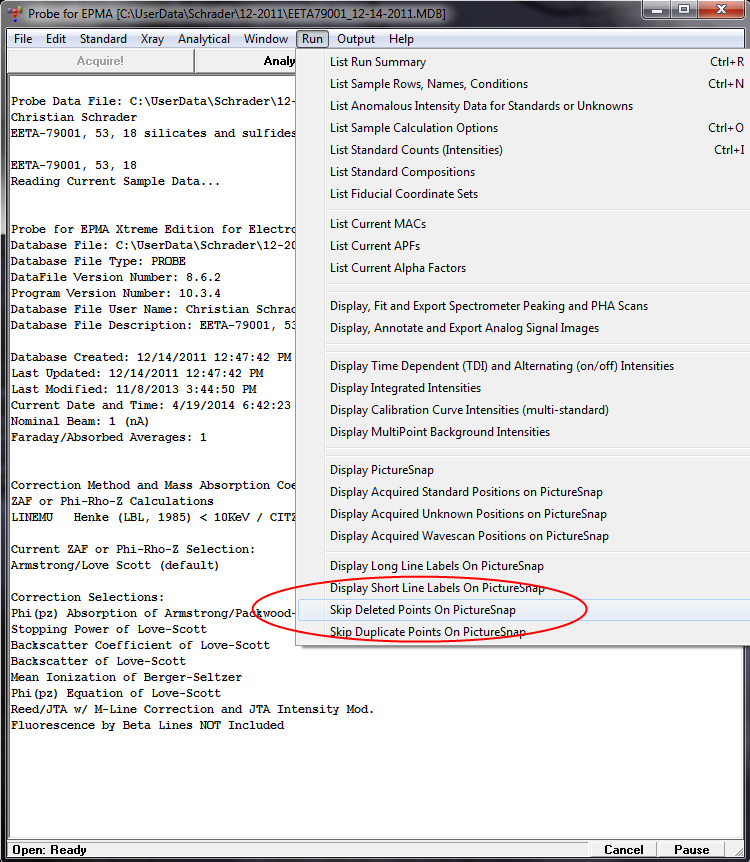
But when you say "locator image", do you mean the "PictureSnap" image? In that case you can use the same "Skip Deleted Points" feature, but this time from the Run | PictureSnap menu as seen here:


 Please keep your software updated for best results!