Let's take one of the examples above, Rb in Ni2SiO4, and examine the counting statistics for Rb with the interference correction:
St 272 Set 3 Ni2SiO4 (synthetic), Results in Elemental Weight Percents
ELEM: Rb Si Ni O
TYPE: ANAL ANAL SPEC SPEC
BGDS: LIN LIN
TIME: 20.00 20.00
BEAM: 50.24 50.24
ELEM: Rb Si Ni O SUM
422 .005 13.293 56.047 30.547 99.892
423 .006 13.254 56.047 30.547 99.854
424 .017 13.366 56.047 30.547 99.977
425 .017 13.356 56.047 30.547 99.967
426 .015 13.280 56.047 30.547 99.889
AVER: .012 13.310 56.047 30.547 99.916
SDEV: .006 .049 .000 .000 .053
SERR: .003 .022 .000 .000
Above one can see that the standard deviation for Rb is 0.006 (60 PPM) with the interference correction. How about if we turn *off* the interference correction:
St 272 Set 3 Ni2SiO4 (synthetic), Results in Elemental Weight Percents
ELEM: Rb Si Ni O
TYPE: ANAL ANAL SPEC SPEC
BGDS: LIN LIN
TIME: 20.00 20.00
BEAM: 50.24 50.24
ELEM: Rb Si Ni O SUM
422 .335 13.273 56.047 30.547 100.203
423 .336 13.234 56.047 30.547 100.164
424 .349 13.346 56.047 30.547 100.289
425 .349 13.336 56.047 30.547 100.280
426 .345 13.261 56.047 30.547 100.200
AVER: .343 13.290 56.047 30.547 100.227
SDEV: .007 .049 .000 .000
Now, without the interference correction, the variance is now 0.007 or (70 PPM), slightly higher than with the interference correction!

I cannot explain this result, but let's try another example, Rb in Fe2SiO4:
St 263 Set 3 Fe2SiO4 (synthetic fayalite), Results in Elemental Weight Percents
ELEM: Rb Si Fe O
TYPE: ANAL ANAL SPEC SPEC
BGDS: LIN LIN
TIME: 20.00 20.00
BEAM: 50.24 50.24
ELEM: Rb Si Fe O SUM
417 .002 13.787 54.809 31.407 100.005
418 .019 13.622 54.809 31.407 99.857
419 .011 13.736 54.809 31.407 99.963
420 .013 13.750 54.809 31.407 99.979
421 .023 13.648 54.809 31.407 99.886
AVER: .014 13.709 54.809 31.407 99.938
SDEV: .008 .070 .000 .000 .063
OK, 0.008 variance or 80 PPM on the Rb *with* the interference correction and now, without the interference correction:
St 263 Set 3 Fe2SiO4 (synthetic fayalite), Results in Elemental Weight Percents
ELEM: Rb Si Fe O
TYPE: ANAL ANAL SPEC SPEC
BGDS: LIN LIN
TIME: 20.00 20.00
BEAM: 50.24 50.24
ELEM: Rb Si Fe O SUM
417 .345 13.770 54.809 31.407 100.330
418 .357 13.605 54.809 31.407 100.178
419 .352 13.719 54.809 31.407 100.287
420 .355 13.732 54.809 31.407 100.303
421 .362 13.631 54.809 31.407 100.208
AVER: .354 13.691 54.809 31.407 100.261
SDEV: .006 .070 .000 .000 .065
the variance is only 0.006 or 60 PPM without the interference correction, so I think that at least in these two cases we can see that the contribution of statistics from the interference correction is roughly similar to the statistics without the interference correction.
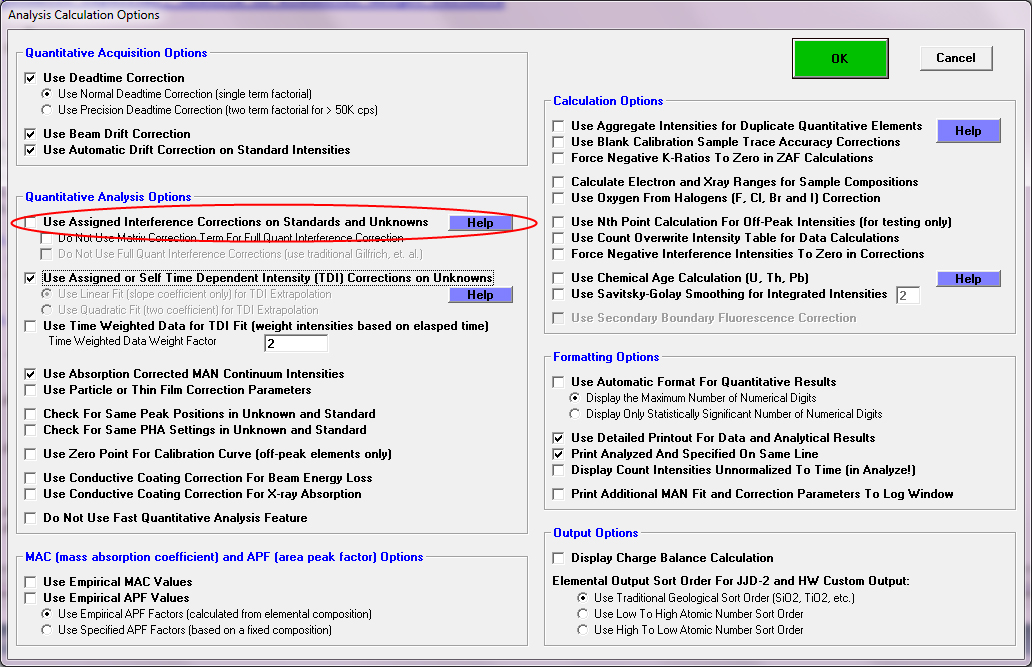
More importantly, as demonstrated above, Probe for EPMA gives the operator an easy way to test the effect of the interference correction on the counting statistics by simply toggling the interference correction on and off. Just to demonstrate, this toggling of the interference correction can be performed with a single mouse click as seen here:


 If you can't see some "in-line" images in a post, try "refreshing" your browser!