Hi John
Ha right OK thanks I will continue to acquire my PHA as the creator intended....but now that we are opening pandora's box this takes me to my next problem and why I wanted to start using MCA for PHA in PfE. I just cannot get good traditional PHA scans in PfE no matter what beam current, x-ray line, window, software/ini settings I use, they always come out extremely "jagged" and useless. This has always been the case for me so I have just been using Peaksite for PHA scans, and PfE for Gain and Bias scans.
Below are some examples of "traditional" PHA scans I get in PfE (Count Time of 1/256 intervals).
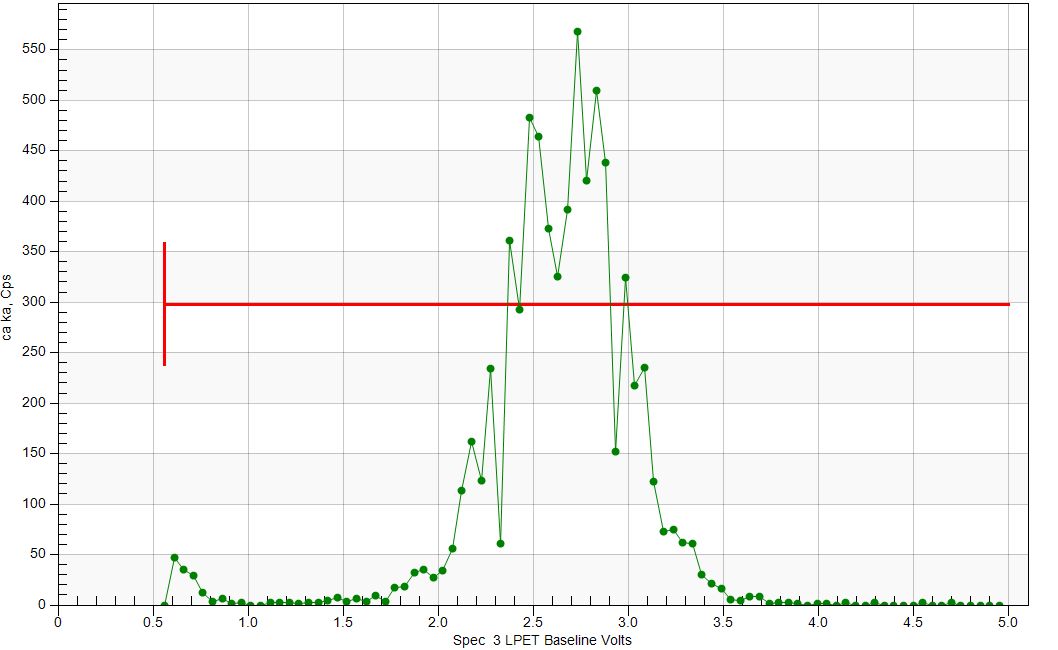
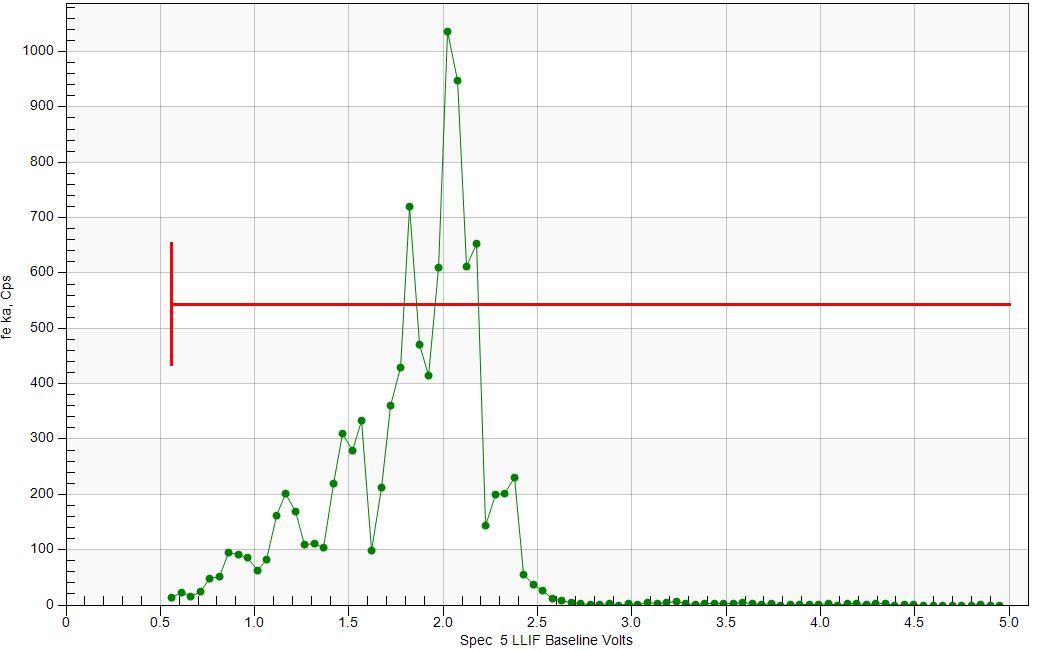
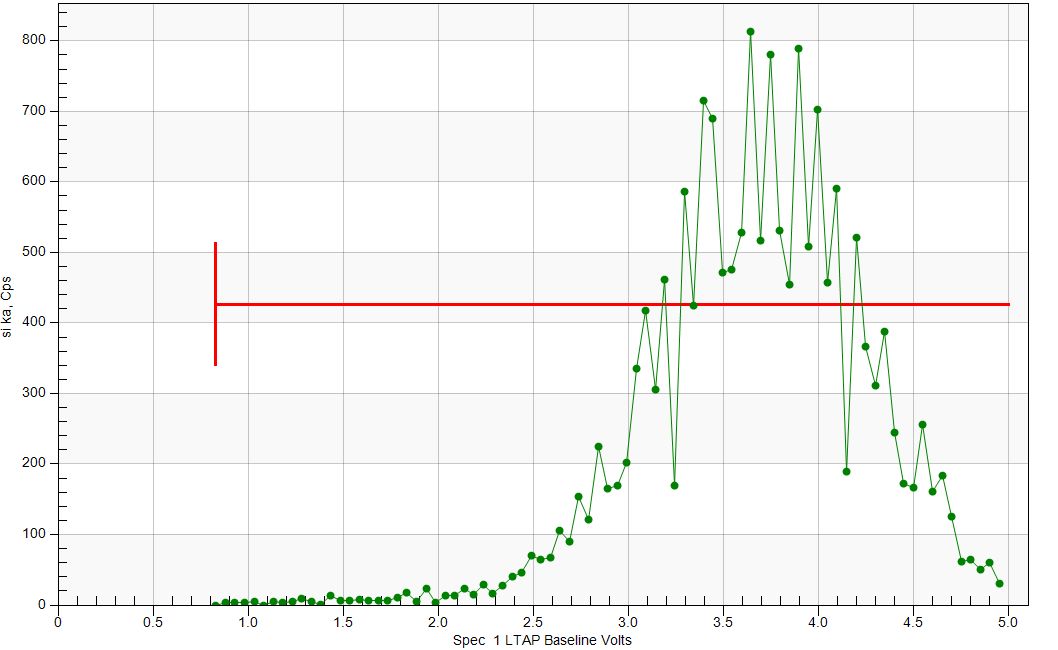
You can see they are pretty horrible. I don't know if its any way related, but I also get really strange artifacts in my Gain scans in PfE. See some Gain scans below of different elements on different spectrometers (all at same beam current, counttime/interval of 1/256). Although not entirely obvious on SP5/LIF I think there is still weirdness at those points. If I use PET on SP5 I still see the bumps as well.
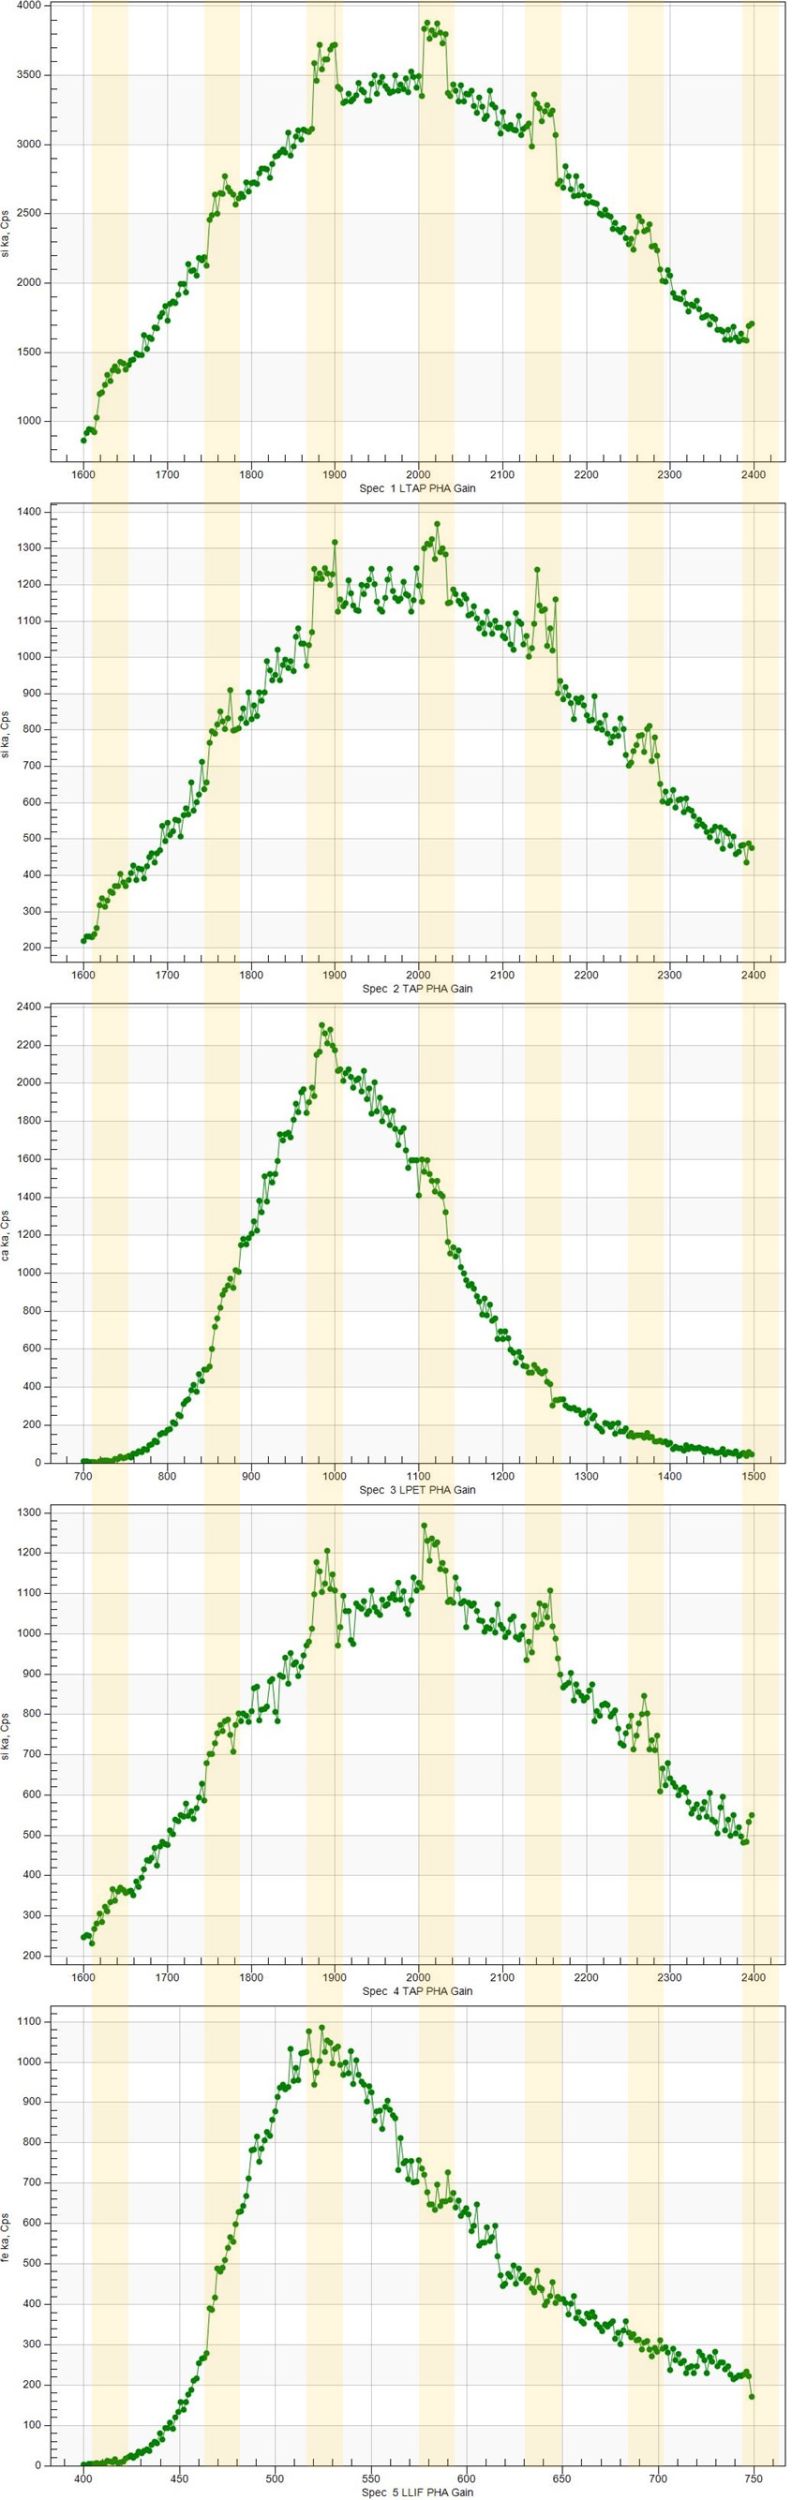
What is really weird is that those strange "bumps" in CPS all somehow coincide with each other on the X-axis even on scans done on totally different days at totally different Gain voltage ranges on totally different crystals?? How is that even possible? These "bumps" do not occur in any Bias scans, only in Gain scans. I have tried changing point time settings and interval and it makes no difference, they all still occur at exactly the same places...
Here are gain scans on Si Ka at different count times and interval settings:
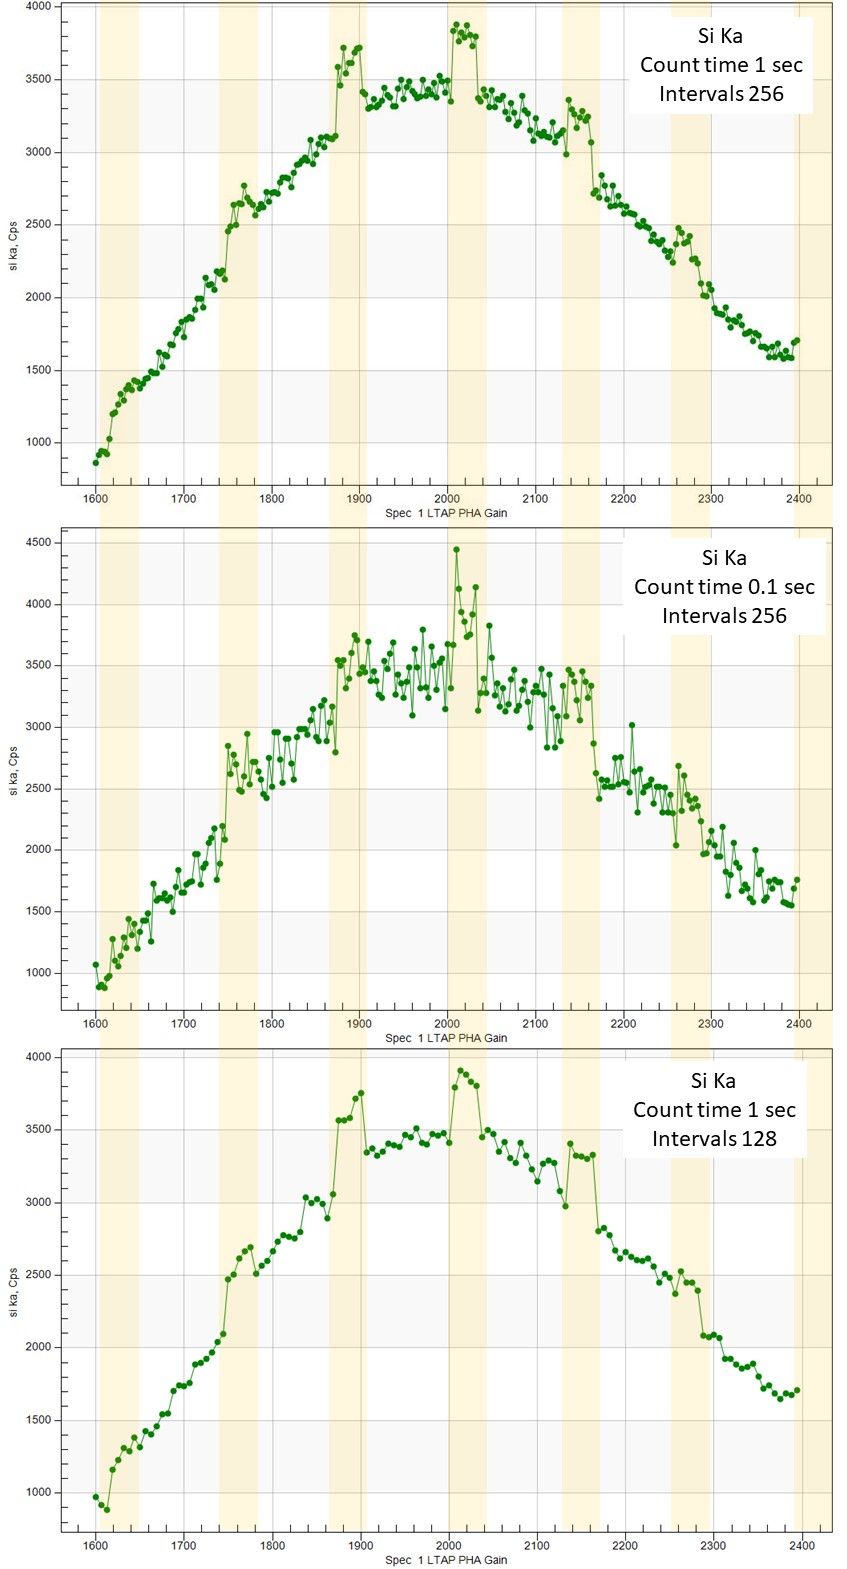
The only thing I can think of is that its some strange time dependant thing going on from when you initiate a scan, and at these very specific regular time intervals it somehow changes the acquisition time per spot to change the resultant calculated CPS number?? But I dont really see how that would work as it should change the periodicity when I change the count time?
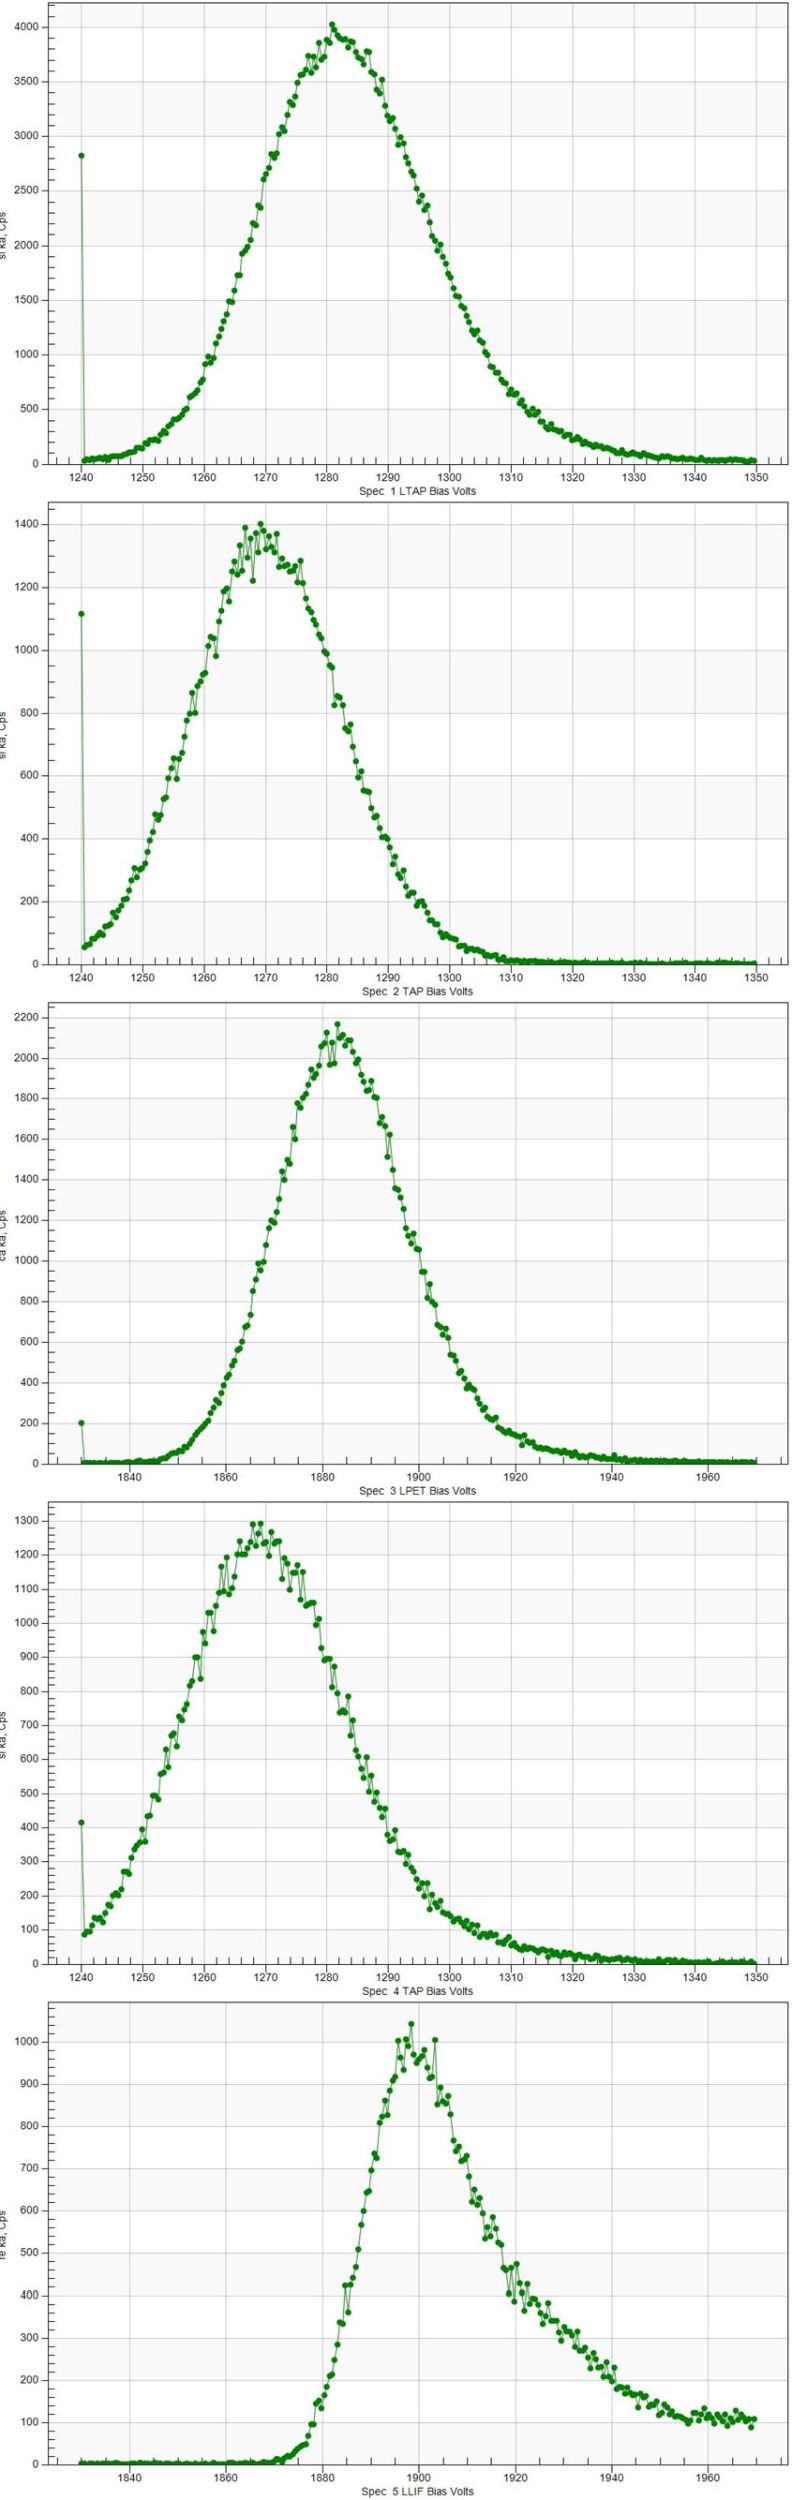
For reference here are the Bias scans:
Also while we are on the topic and looking in pandora's box , I have a few other problems....
1) There is a tiny bug in exporting Gain/Bias scans from the from the display fitting window, in that when you click on the "Export Data" button and you get the window to save the DAT file, the automated file name it pops up with labels it as the opposite of what it is (in that if you are trying to export a Bias scan it labels it as a Gain scan and vice versa);
2) Mostly a comment, but in Bias scans the first data point is almost always some randomly high CPS value which I just ignore. I was wondering if it was a voltage settling thing after changing the Bias a large amount, as I saw the PHAFirstTimeDelay setting in the ini. I increased this from 5 to 10 seconds which didnt make a difference, so I guess that setting is just for PHA scans not Bias scans?
3) I cannot run PHA scans automated, only manually one at a time through the PHA properties window. If I attempt to run PHA scans through automated actions I get the error message below
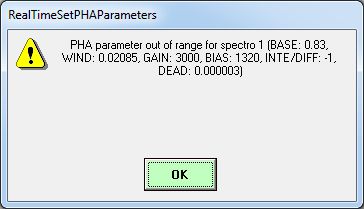
These settings are corresponding to the first element its trying to do a scan for, but they all seem fine to me I cannot see anything wrong? I have checked my scalers file to make sure nothing is whack in there but it all seems fine.
Cheers


 We depend on your feedback and ideas!