When I activated the blank correction, it warned me that maybe I should remove the peak interference correction to avoid an over correction. I can understand this is correct (that it will overcorrect) IF the blank standard AND the unknown have exactly the same Ti content, but… The blank correction reference material and the unknown samples have different Ti-content (up to 0.5-1.0 wt% difference)! Can the blank correction handle this? Would you say this is not possible at all to correct for this?
Hi Julien,
You always have such great questions!

I have to admit that this is a topic that I haven't thought about as much as it probably should be. It's complicated, at least to me. But in fact in thinking about this a bit more today, I've decided that maybe the warning you are getting about applying both an interference correction and a blank correction may not even be necessary! I'm not exactly sure, but keep reading. In any case it's always best to check using actual data to check one's assumptions!
So I recently was testing some integrated EDS and WDS analyses where I used WDS for the trace elements and EDS for the major elements, the idea being to reduce the number of elements by WDS, thus speeding up the analysis and damaging the sample less, as described here a few months ago for those that are interested:
https://probesoftware.com/smf/index.php?topic=79.msg7818#msg7818As you know for some situations, e.g., Rb or Sr La are interfered by Si, so it's important that we can correct for spectral interferences between WDS *and* EDS elements, particularly if one is doing traces by WDS and major elements by EDS! Anyway, the point being that we can do a quick test using this data set for the interference correction and the blank correction separately, and also together, to try and answer your questions. It's not a perfect test because there were a limited number of samples, but let's see what we find anyway... please note I'm going to pitch this post to a general audience so I'm going to go over some issues that I know you are very much aware of, probably much more than myself!
So (starting at the beginning) if we do not apply the interference correction for Si interfering with Sr La, nor apply a blank correction, we get the following results on a SiO2 standard (which has zero Sr from ICP-MS by Alan Koenig):
ELEM: Na Ba Rb Sr Fe Si Al K O SUM
60 .001 .002 -.054 .063 .014 46.717 .048 .000 53.282 100.074
61 .002 .000 -.036 .076 .011 46.971 .045 .000 53.571 100.640
62 .000 -.008 -.053 .068 -.009 46.890 .042 .000 53.466 100.396
63 .002 .006 -.057 .064 .000 46.767 .035 .000 53.323 100.139
AVER: .001 .000 -.050 .067 .004 46.836 .043 .000 53.410 100.313
SDEV: .001 .006 .010 .006 .010 .115 .006 .000 .133 .259
and here for an orthoclase standard (which has 12 PPM (0.0012 wt.%) Sr from isotope dilution by John Christensen):
ELEM: Na Ba Rb Sr Fe Si Al K O SUM
56 .718 .049 .039 .052 1.350 30.095 8.552 12.896 45.190 98.942
57 .747 .071 .027 .043 1.320 30.075 8.544 12.888 45.160 98.875
58 .753 .060 .015 .056 1.344 30.123 8.575 12.930 45.259 99.115
59 .731 .064 .017 .039 1.331 29.870 8.467 12.808 44.837 98.165
AVER: .737 .061 .025 .048 1.336 30.041 8.535 12.881 45.111 98.774
SDEV: .016 .009 .011 .008 .013 .115 .047 .052 .188 .419
Please ignore the Rb results. It would be nice to also check the Rb values but there clearly is a problem with the background measurement, so at least for now, let's just focus on these two Sr measurements.
So it would appear that there is an interference from Si on the Sr La emission line. First because the SiO2 shows a greater amount of Sr than the orthoclase, but also because our nominal overlap calculation model from the Elements/Cations dialog in Probe for EPMA shows this:
For Sr la LPET at 6.86280 angstroms, at an assumed concentration of 1 wt.%
Interference by Si SKB` at 6.81610 ( 77894.2) ( -533.78) = 2.0%
Interference by Rb LB4 at 6.82360 ( 77979.9) ( -448.06) = 16.5%
On Peak Position ------------- at 6.86280 ( 78428.0)
Interference by K SKB`` II at 6.88250 ( 78653.2) ( 225.180) = 10.0%
Interference by K SKB^5 II at 6.89860 ( 78837.2) ( 409.211) = 2.0%
Interference by K KB1 II at 6.90910 ( 78957.2) ( 529.227) = 4.5%
Interference by K KB3 II at 6.90910 ( 78957.2) ( 529.227) = 2.5%
When one has an interfering emission line from a major element, those tails can extend a long way...
Now, if we apply the interference correction in Probe for EPMA for Sr interfered by Si using the SiO2 standard as the standard for the interference correction, we get the following results for SiO2 measured as an unknown:
ELEM: Na Ba Rb Sr Fe Si Al K O SUM
60 .001 .002 -.054 -.004 .014 46.721 .048 .000 53.274 100.003
61 .002 .000 -.036 .008 .011 46.975 .045 .000 53.563 100.569
62 .000 -.008 -.053 .000 -.009 46.894 .042 .000 53.458 100.325
63 .002 .006 -.057 -.004 .000 46.771 .035 .000 53.316 100.069
AVER: .001 .000 -.050 .000 .004 46.840 .043 .000 53.403 100.242
SDEV: .001 .006 .010 .006 .010 .115 .006 .000 .133 .259
Which is pretty darn good, though expected since the SiO2 standard and the SiO2 unknown were the same material, though measured in different spots on the standard. And here is the orthoclase standard measured as an unknown:
ELEM: Na Ba Rb Sr Fe Si Al K O SUM
56 .718 .049 .039 .009 1.350 30.098 8.553 12.896 45.186 98.898
57 .747 .071 .027 .000 1.320 30.077 8.545 12.888 45.155 98.830
58 .753 .060 .015 .013 1.344 30.126 8.575 12.930 45.255 99.071
59 .731 .064 .017 -.004 1.331 29.873 8.467 12.808 44.832 98.121
AVER: .737 .061 .025 .004 1.336 30.043 8.535 12.881 45.107 98.730
SDEV: .016 .009 .011 .008 .013 .115 .047 .052 .188 .418
The isotope dilution gave us 12 PPM Sr, but our variance is 80 PPM, so statistically a zero concentration.
Now lets turn off the interference corrections and turn on the blank correction instead. Again, here is SiO2 as an unknown using itself for the blank correction:
ELEM: Na Ba Rb Sr Fe Si Al K O SUM
60 .001 .002 -.054 -.004 .014 46.721 .048 .000 53.274 100.003
61 .002 .000 -.036 .008 .011 46.975 .045 .000 53.563 100.569
62 .000 -.008 -.053 .000 -.009 46.894 .042 .000 53.458 100.325
63 .002 .006 -.057 -.004 .000 46.771 .035 .000 53.316 100.068
AVER: .001 .000 -.050 .000 .004 46.840 .043 .000 53.403 100.242
SDEV: .001 .006 .010 .006 .010 .115 .006 .000 .133 .259
As expected, and as near as we can tell we get zero. Which is also the same result we got for the interference correction. But that is merely because we assigned the SiO2 unknown as the blank correction to itself. Now let's look at the orthoclase standard using the same SiO2 unknown for the blank correction:
ELEM: Na Ba Rb Sr Fe Si Al K O SUM
56 .718 .049 .039 -.015 1.350 30.099 8.553 12.896 45.183 98.873
57 .747 .071 .027 -.024 1.320 30.079 8.545 12.888 45.153 98.806
58 .753 .060 .015 -.011 1.344 30.127 8.575 12.930 45.252 99.046
59 .731 .064 .017 -.029 1.332 29.875 8.468 12.808 44.830 98.096
AVER: .737 .061 .025 -.020 1.336 30.045 8.535 12.881 45.105 98.705
SDEV: .016 .009 .011 .008 .013 .115 .047 .052 .188 .419
Whoa! Now we are getting a *negative* 200 PPM for Sr. It's a significant *over correction* clearly. Why would that be?
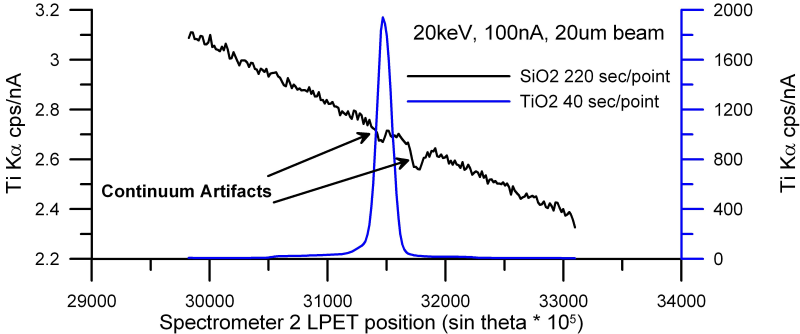
Well, the interference correction is based on the actual concentration of the interfering element, in this case Si. And since there is an actual interference here, the interference correction handles the situation very well. But the blank correction is *not* based on the concentration of any particular element. It merely assumes that there is some sort of measurement artifact, what exactly we may not know, but it assumes that the measurement artifact is constant regardless of composition. Perhaps something like a detector absorption edge or a secondary Bragg reflection artifact like this:
So we would expect that since the concentration of Si, which is causing the interference, is different for SiO2 and orthoclase, that the blank correction would be unsuitable for this situation and indeed that appears to be the case.
OK, but what happens if we apply *both* the interference correction and the blank correction to these samples? Here is the SiO2 standard with the interference correction for Si on Sr La using SiO2 as our interference standard and also the blank correction using the SiO2 unknown as the blank correction sample:
ELEM: Na Ba Rb Sr Fe Si Al K O SUM
60 .001 .002 -.054 -.004 .014 46.721 .048 .000 53.274 100.003
61 .002 .000 -.036 .008 .011 46.975 .045 .000 53.563 100.569
62 .000 -.008 -.053 .000 -.009 46.894 .042 .000 53.458 100.325
63 .002 .006 -.057 -.004 .000 46.771 .035 .000 53.316 100.069
AVER: .001 .000 -.050 .000 .004 46.840 .043 .000 53.403 100.242
SDEV: .001 .006 .010 .006 .010 .115 .006 .000 .133 .259
And since we're using the SiO2 standard as the standard for the interference correction and we're using the SiO2 unknown as the blank correction sample, we get zero as expected. But now let's try the orthoclase standard with both corrections turned on:
ELEM: Na Ba Rb Sr Fe Si Al K O SUM
56 .718 .049 .039 .009 1.350 30.098 8.553 12.896 45.186 98.898
57 .747 .071 .027 .000 1.320 30.077 8.545 12.888 45.155 98.830
58 .753 .060 .015 .013 1.344 30.126 8.575 12.930 45.255 99.071
59 .731 .064 .017 -.004 1.331 29.873 8.467 12.808 44.832 98.121
AVER: .737 .061 .025 .004 1.336 30.043 8.535 12.881 45.107 98.730
SDEV: .016 .009 .011 .008 .013 .115 .047 .052 .188 .418
Weird! We're getting the same result we got for the interference correction only! How is that possible? Well a closer look at the blank correction "value" on this orthoclase analysis shows us why:
ZCOR: 1.8699 1.3745 1.2860 1.2359 1.1909 1.2191 1.2592 1.1361 ---
KRAW: .0536 .0006 .0006 .0001 .0166 .6009 .5086 1.0017 ---
PKBG: 12.74 1.19 1.07 1.06 11.90 .00 .00 .00 ---
INT%: ---- ---- ---- -92.75 ---- ---- ---- ---- ---
BLNK#: ---- ---- ---- 9 ---- ---- ---- ---- ---
BLNKL: ---- ---- ---- .000000 ---- ---- ---- ---- ---
BLNKV: ---- ---- ---- .000070 ---- ---- ---- ---- ---
Two things to look at here. First the interference correction shows a -92% correction leaving us with 40 PPM of Sr. Now our variance is 80 PPM so the 40 PPM result is statistically a zero, but it is a tiny bit suggestive, because according to isotope dilution do we have 12 PPM of Sr in this orthoclase standard. So a higher precision measurement is necessary before we proceed with any further speculation, and I would probably use the MAN method for best trace element precision combined with a blank correction for an accuracy correction, so next time I get a chance I'll try that measurement.
Second, look at the blank correction value (BLNKV). It's 0.00007 wt% or 0.7 PPM! What does this mean? It means that after the interference correction is applied to the sample, the blank correction calculates the difference between what we measured and what we should have obtained (that's the BLNKL or blank correction level), and that was only 0.7 PPM or essentially zero. So when we apply that blank correction of 0.7 PPM to either the SiO2 as an unknown or the orthoclase as an unknown, there is essentially no effect on the data.
I know, it hurts my brain too but it actually makes sense. I would be very interested in hearing from you (Julien), and/or any one else on what you find on your samples. Please try some tests on some well characterized standards that have trace elements measured and let's see what we find.


 Please keep your software updated for best results!