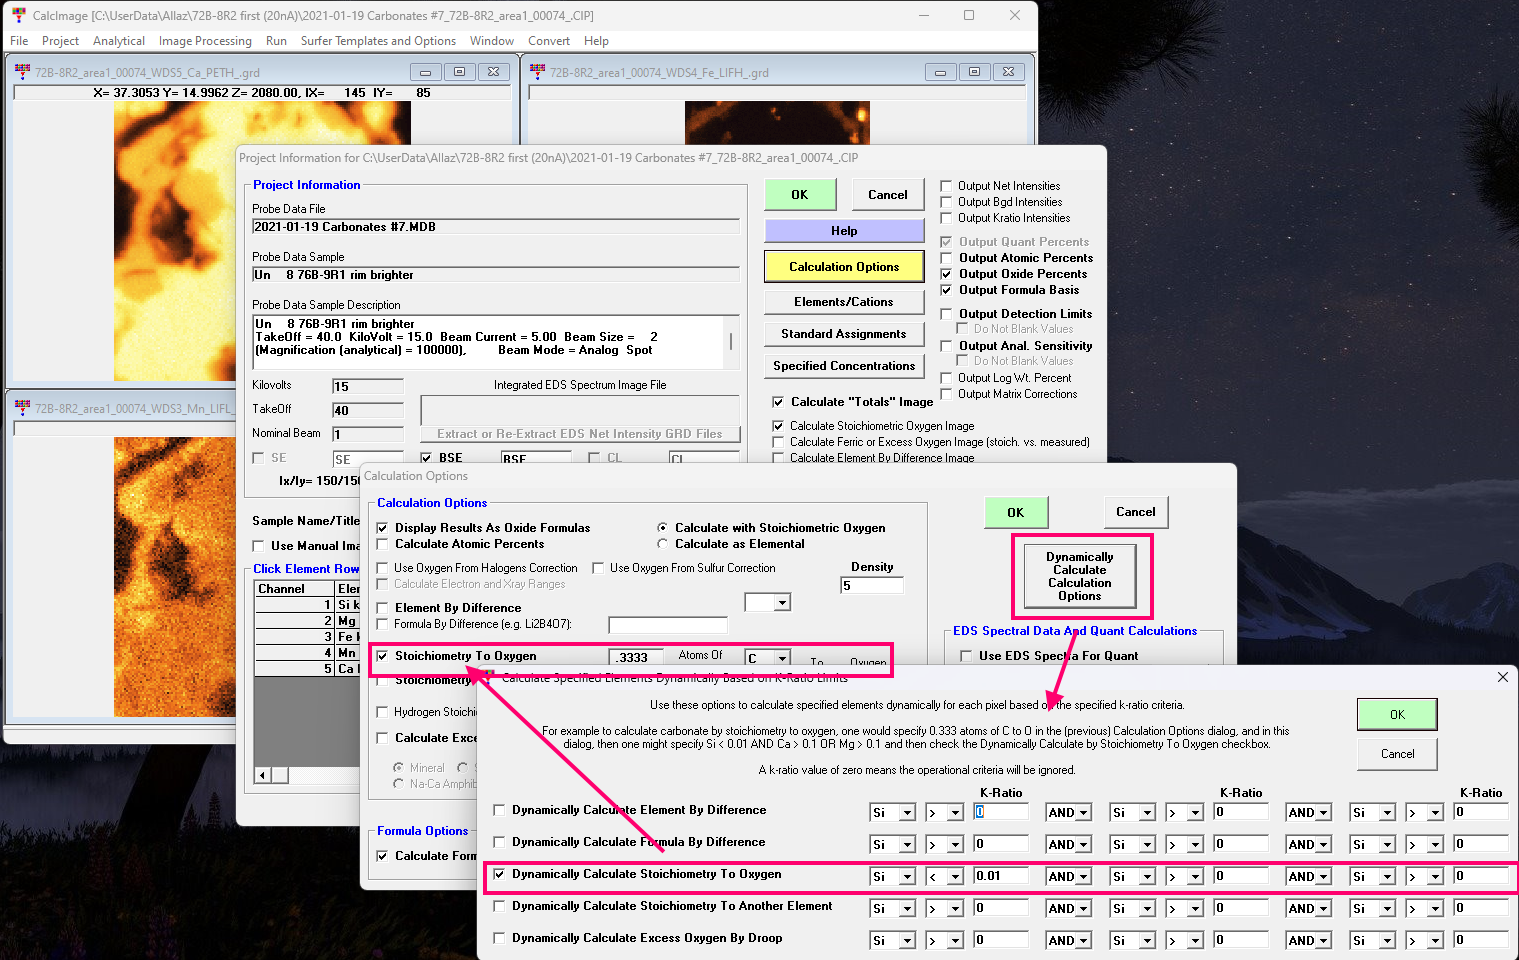
Based on suggestions from Julien Allaz we have implemented a new method for calculating some elements (by difference, formula difference, stoichiometry to stoichiometric oxygen, stoichiometry to another element and excess oxygen from ferric iron by charge balance), based on a k-ratio criteria specified by the user:

Based on these user specified (first approximation) k-ratio criteria for each individual pixel, the CalcImage software will implement these various UNanalyzed elements and add them during the matrix correction just as one would do in Probe for EPMA for point analyses.
However, because a map can contain multiple phases, for example a silicate and a carbonate, one would want to add, for example, carbon by stoichiometry to the carbonate phase but not the silicate phase. Julien explained it like this to us:
In some materials we are analysing, we have a bunch that have a mixture of carbonate (calcite, dolomite) and hydrated phases, along with anhydrous silicates. It is of great interest to us to be able to quantify these maps  You and me and many others know that all elements must be analysed or specified for accurate results... Ideally, this element should be determined by stoichiometry for the best “guestimate” rather than by difference. The problem right now is when you indeed have a mixture of phases that are missing one element (C or H - or sometime both).
I am trying to think about a way to code this into CalcImage… When I’m thinking of my specific sample (mixture of carbonate + silicate), we could “set a condition” in CalcImage so that for instance any pixel that yield a high Ca or Mg wt-% from Castaing’s first approximation on the quantification, with no or little Si wt%, then and only then, we should calculate the “missing CO2” from this carbonate. If the next pixel to treat has a high Si content, it should then NOT calculate the CO2 as it is most likely a silicate.
On the coding-side, I would foreseen a “pre-filter” similar to what you have in the “Extract shape, polygon….. and filter data”, but this filter should be applied within the matrix correction (so yet another loop in the loop in the loop), where IF the pixel has less than (for instance) < 0.5 wt.% Si, and > 10% Ca OR > 10% Mg, then do calculate the missing CO2 by stoichiometry (i.e., calculate 1 C atom for every 0.33333 atom of O). If not, continue the matrix correction as usual.
So we had to think about this for a few weeks, but we finally came up with something that we think should prove very useful.
Now some of you might say, well why couldn't we just add in these concentrations afterwards to those pixels, and besides it doesn't really matter that we don't have a 100% total for these pixel analyses, does it? And the answer to the first question is: you can, but then these additional element concentrations are not being included in the matrix correction which introduces a significant analytical error. The answer to the second question is: if your total (points or pixels) does not approach 100%, then your matrix correction is wrong and can introduce significant analytical errors.
See this abstract for more details (full paper by Aurelien Moy is in preparation):
https://academic.oup.com/mam/article/29/Supplement_1/855/7228940Here is another example of a silicate and oxide phases where the totals for the oxide pixels are ~93 to 95% because iron was calculated assuming FeO (oxygen by stoichiometry) and some (though not all!) of the iron is actually Fe2O3. This "missing oxygen" affects the concentrations of all the analyzed elements, but especially Fe because it is a major element. Remember, the standard choice and matrix correction are the largest corrections we make for major elements:
https://probesoftware.com/smf/index.php?topic=610.msg11752#msg11752In this silicate and oxide map we specified the following k-ratio criteria:

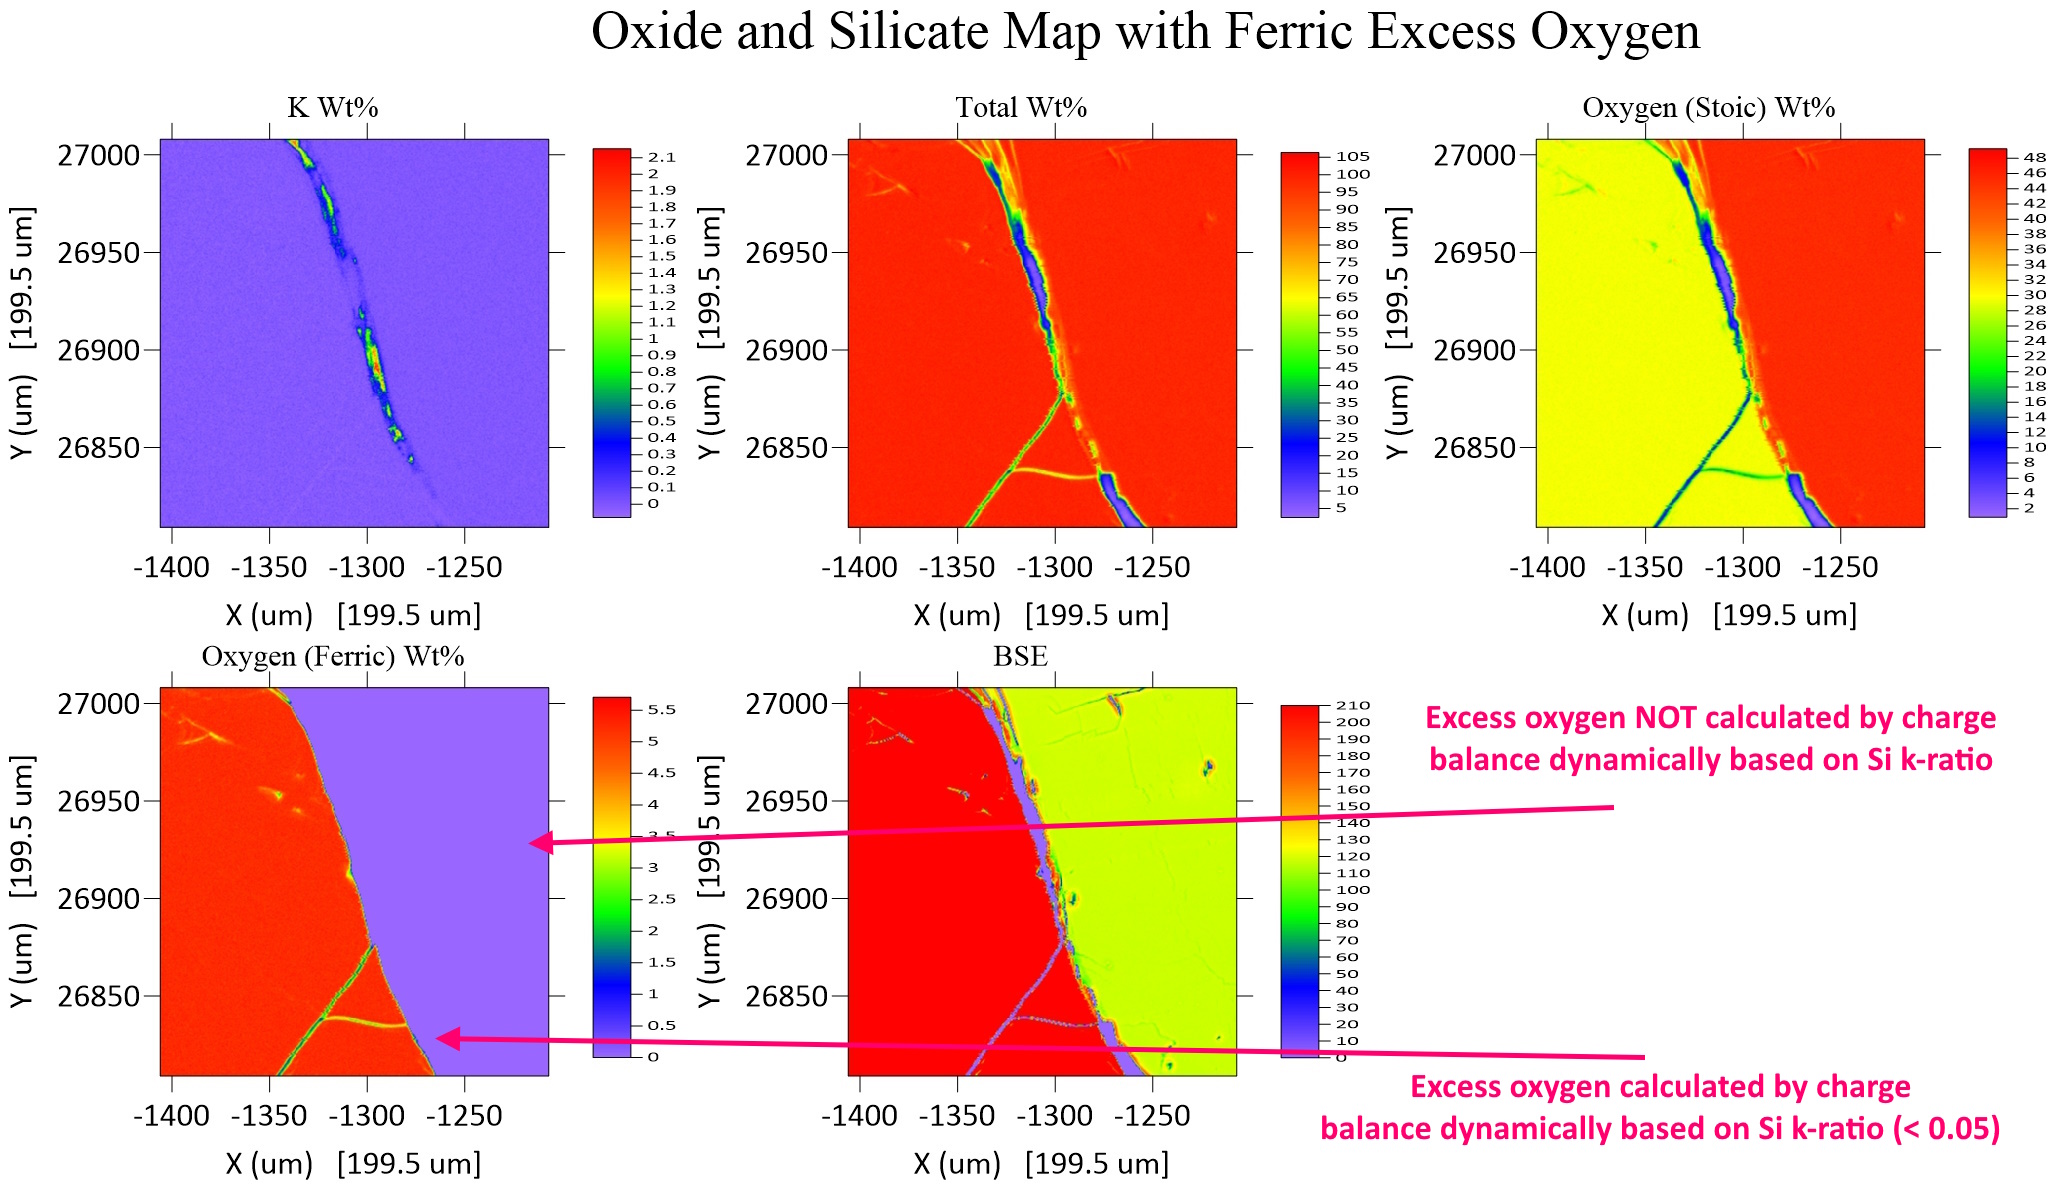
By doing so we obtain the following quantitative maps (some maps not shown):

Note that the totals map is close to 100% for both the silicate and oxide phases thus ensuring analytical accuracy!
Thank-you to Julien for this idea.