1. Could you suggest how I can download raw intensities of unknowns which include background (BG intensity haven’t been subtracted). If I try to do it through Output/User Specified Format..., the system ask me about standards which I haven't acquired. Of course I can upload fake standards but maybe you can suggest to me a simpler way.
Yes, the User Specified Format output depends on having a complete analysis as that format supports many different kinds of data output, many of which require k-ratio calculations. For those interested in this output format which is available by right clicking the selected samples in the Analyze! window or from the Output menu for all standard or all unknowns, see here:
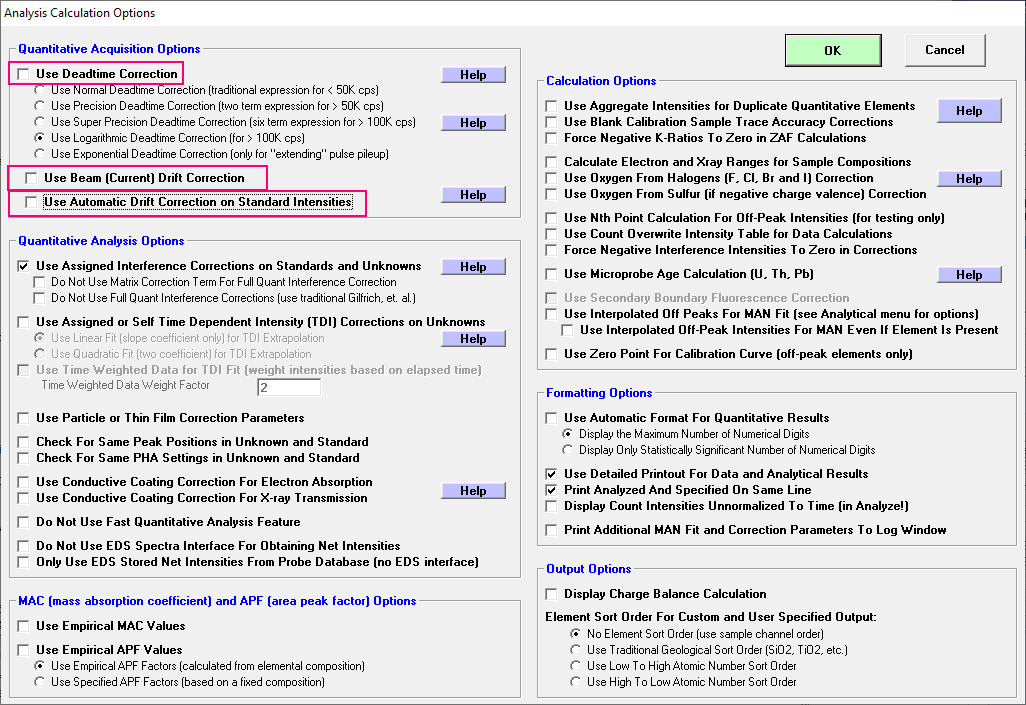
https://probesoftware.com/smf/index.php?topic=1317.msg9471#msg9471But if you have no standard intensities in your probe database and you want raw data output without any corrections for dead time, beam current, or standard intensity drift you can simply uncheck these correction options in the Analytical | Analysis Options dialog as seen here:
The intensities will still be displayed in cps as that is how the intensities are stored in the probe database files. But of course you can get raw photons by multiplying by the counting time.
Once you have the intensities displayed in the log window, you can copy and paste from the log window or use the Copy buttons from the Analyze! window to copy to the system clipboard as seen here:
https://probesoftware.com/smf/index.php?topic=227.msg1065#msg1065Note also that the Output | Output Standard and Unknown XY Plots menu also has output for raw on count (cps) intensities. Of course, now that I finished typing all this I also note that this is all explained in this post from 2014!
https://probesoftware.com/smf/index.php?topic=33.msg2155#msg21552. Is this (see the picture) the raw data of intensities which include background or data excluding background?
Well, it's exactly as stated in your screenshot. Note that you don't need to post an image to display text output. One can simply use the "Tt" button on the "Post reply" dialog and then paste your text from the clipboard between the delimiters. This button is referred to as the "teletype" (look it up) delimiter, so the text is displayed without proportional spacing as seen here:
On-Peak (off-peak corrected) or EDS (bgd corrected) or MAN On-Peak X-ray Counts (cps):
ELEM: fe ka mn ka BEAM1 BEAM2
BGD: OFF OFF
SPEC: 3 5
CRYST: LLIF LIF
ORDER: 1 1
1826G 4018.84 9.87 29.850 29.847
1827G 4001.57 9.97 29.843 29.838
1828G 4016.05 9.19 29.829 29.835
1829G 4004.69 9.40 29.839 29.862
1830G 4037.67 9.72 29.872 29.870
AVER: 4015.76 9.63
SDEV: 14.26 .33
1SIG: 10.07 .67
SIGR: 1.42 .49
SERR: 6.38 .15
%RSD: .36 3.40
As the title (On-Peak (off-peak corrected) or EDS (bgd corrected) or MAN On-Peak X-ray Counts (cps)) indicates, the intensities displayed here are either corrected for off-peak intensities (if the were acquired as off-peak elements) or background corrected net intensities (if they were acquired as EDS elements) or as on-peak intensities if they were acquired as MAN elements.
Scrolling further down we have the interpolated off-peak intensities followed by the high and low off-peak intensities displayed as seen here:
Off-Peak (calculated) or EDS (bgd) X-ray Counts (cps):
ELEM: fe ka mn ka
TYPE: LINEAR LINEAR
1826G 39.37 7.90
1827G 38.41 7.90
1828G 38.33 8.06
1829G 38.46 8.65
1830G 38.21 8.75
Raw Hi-Peak X-ray Counts (cps):
ELEM: fe ka mn ka
1826G 40.30 7.40
1827G 36.40 7.50
1828G 36.60 6.90
1829G 37.20 8.60
1830G 36.90 8.50
Raw Hi-Peak X-ray Counts (cps):
ELEM: fe ka mn ka
1826G 38.30 8.40
1827G 40.70 8.30
1828G 40.30 9.20
1829G 39.90 8.70
1830G 39.70 9.00

 To post in-line images, login and click on the Gallery link at the top
