Author Topic: New method for calibration of dead times (and picoammeter)  (Read 23032 times)

Probeman

  • Emeritus
  • *****
  • Posts: 2822
  • Never sleeps...
    • John Donovan
John Fournelle and I were chatting a little while back discussing dead time and how to calibrate our detectors and electronics and we realized that this also depends on the linearity of our picoammeter.
 
Normally when performing a dead time calibration we use a single material such as Ti metal (for LiF and PET) or Si metal (for PET and TAP), because these materials will yield a high count rate and also are conductive, so hopefully less chance of sample damage and/or charging.

We then repeatedly increment the beam current and measure the count rate as a function of beam current. The idea being that without dead time effects our count rate vs. beam current should be exactly proportional, that is a doubling of beam current should produce a doubling of count rate.

But because of the dead time characteristics of all detection systems (the interval during which the detector is busy processing a photon pulse), the system will be unavailable for photon detection sometimes, and that unavailability is simply a probability based on the length of the system (pulse processing) dead time and the count rate. 

Note that EDS systems, automatically "extend" the live time while processing photons so the dead time correction is part of the EDS hardware, while WDS systems must have the dead time correction applied in software after the measurements have been completed.

So this simple trend of count rate vs. beam current is utilized to calibrate our WDS spectrometers. However John Fournelle and I realized that if the picoammeter response is not accurate, the resulting dead time calibration will also not be accurate.

Even more to the point, what exactly is it we are doing with our microprobe instruments? We are simply measuring k-ratios. That is all we do. Everything else we do after that is physics modeling.  The electron microprobe is a k-ratio machine, so perhaps that should be our focus. And that is exactly the point of the "consensus k-ratio" project as originally suggested by Nicholas Ritchie:

https://probesoftware.com/smf/index.php?topic=1239.0

If we cannot accurately compare our k-ratio measurements to the k-ratio measurements from another lab, we do not have a science.  See the consensus k-ratio project topic:

https://probesoftware.com/smf/index.php?topic=1442.0

That is to say, using the same *two* materials (in order to obtain a k-ratio), and at a given detector takeoff angle and electron beam energy, we should obtain the same k-ratio, not only on all of our spectrometers, but also on all instruments. See topic on simultaneous k-ratios:
 
https://probesoftware.com/smf/index.php?topic=369.msg1948#msg1948

Now, if are in agreement so far, let's ask another question: at a given takeoff angle and electron beam energy, and two materials containing the same element (and no beam damage/sample charging!), should the instrument (ideally) produce the same k-ratio at all beam currents?

John Fournelle and I believe the answer to this question is "yes".  Now if the two materials have significantly different concentrations of an element, the count rates on these two materials will be significantly different, and therefore the dead time calibration (and picoammeter!) accuracy are critical in order to obtain accurate (the same) k-ratios at different beam currents.

So first we looked at the k-ratio measurements from the MgO, Al2O3, MgAl2O4 round robin organized by Will Nachlas, where I measured only a few different beam currents starting at 30 nA but and then at lower beam current to reduce the effects of any mis-calibration of the dead time constants.  Note: these are just the first thing we looked at, as these measurements are by no means enough data, we need many more measurements and at higher beam currents!

Here are two results, the first using the original dead time calibration from 2015:


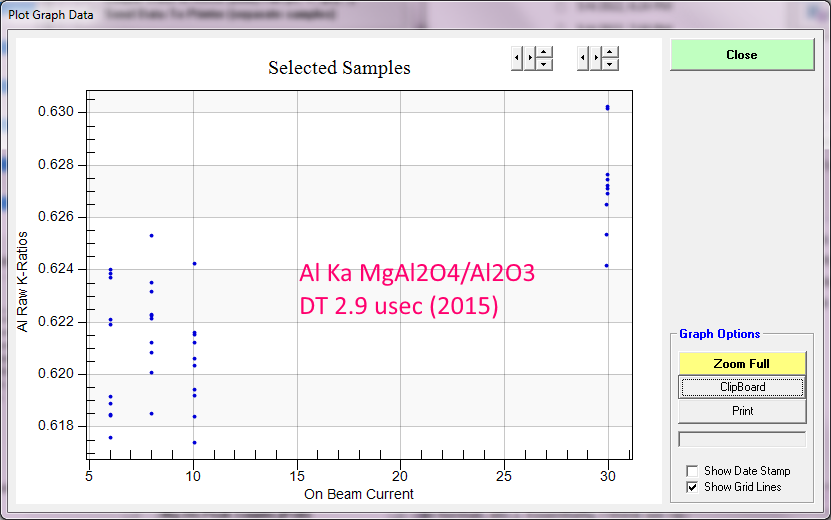
where one can see that the higher beam current measurement yield a larger k-ratio. This (positive slope) "trend" should mean that the dead time constant is too small. And now using the new dead time calibration from this year on the same data again:


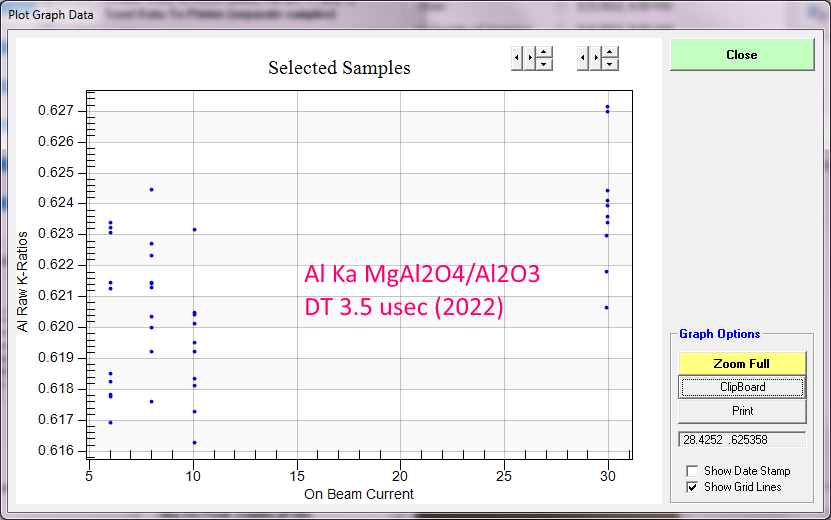
So the slope has decreased as expected, but the dead time constant may still need to be increased. How can this be? Well maybe the picoammeter is not accurate...  we need better (and more) measurements!
« Last Edit: May 26, 2022, 08:34:48 PM by Probeman »
The only stupid question is the one not asked!

Probeman

  • Emeritus
  • *****
  • Posts: 2822
  • Never sleeps...
    • John Donovan
Re: New method for calibration of dead times (and picoammeter)
« Reply #1 on: May 26, 2022, 10:06:54 AM »
Next weekend I went into the lab and ran some different materials that should be more suitable (more electrically and thermally conductive). I choose Zn, Te, Se, ZnTe and ZnSe in order to measure k-ratios for Zn Ka, Se la and Te La on LiF, TAP and PET with emission energies of 8.63, 1.38 and 3.77 keV.

These are still not enough measurements because these were run manually (more on that later), but here are some Zn Ka measurements using our latest (traditional) current dead time calibration method:


By the way, the above plot is from using the Output | Output Standard and Unknown XY Plots menu in probe for EPMA, and selecting "On Beam Current" for the X axis and one of the element "Raw K-ratios" for the Y axis. 

Then we *manually* adjusted the dead time using the Update Dead Time Constants dialog in Probe for EPMA (from the Analytical menu):

https://probesoftware.com/smf/index.php?topic=1442.0

in order to obtain a more constant k-ratio as a function of beam current as seen here:


Now that seems to be an improvement but still not perfect. But we need many more measurements and I hope to get to that this weekend.  But please make your own measurements and post what you find from your instruments.
« Last Edit: May 26, 2022, 01:56:42 PM by Probeman »
The only stupid question is the one not asked!

John Donovan

  • Administrator
  • Emeritus
  • *****
  • Posts: 3263
  • Other duties as assigned...
    • Probe Software
Re: New method for calibration of dead times (and picoammeter)
« Reply #2 on: May 27, 2022, 10:12:55 AM »
In order to acquire these "constant k-ratio" datasets at different beam currents, and to ensure that the (primary) standard utilized for each beam current acquisition is at the same beam current as the secondary standard, one must acquire the datasets one beam current at a time. That is, all primary and secondary standards (or unknowns) must be acquired together at each beam current.

Until just now this had to done semi-manually in Probe for EPMA. It might seem reasonable that one could utilize the "multiple setups" feature in the Automate! window, but unfortunately this feature was originally designed for the acquisition thin film calibrations where each standard and unknown are acquired at multiple beam voltages, e.g., 10 keV, 15 keV, 20 keV.

Therefore the program would acquire each sample for *all* the (multiple) sample setups assigned to it. In other words the acquired samples might look like this acquisition, from a thin film run:


But for the constant k-ratio method we need the samples acquired one (beam current) condition at a time, for *all* samples, as shown here from the Zn, Te, Se semi-manually acquired data shown in the previous posts:


The reason of course is because samples with different accelerating voltages do not get utilized for quantification, because the k-ratios will be different. But that is not true for samples acquired with different beam currents!  These k-ratios should be the same.  But since that is exactly what we are trying to measure, it is best to have each set of beam current measurements grouped together in time.

However, we recently thought of a way to modify the automatically code to handle this constant k-ratio vs beam current acquisition so that it can be fully automated. We added a new checkbox to the multiple sample setups dialog as shown here (accessed as usual from the Automate! window):


 8)

The only caveat is that all the samples selected should have the same number of (multiple) sample setups assigned to all samples, which is of course exactly what we want.
« Last Edit: May 27, 2022, 10:58:24 AM by John Donovan »
John J. Donovan, Pres. 
(541) 343-3400

"Not Absolutely Certain, Yet Reliable"

Probeman

  • Emeritus
  • *****
  • Posts: 2822
  • Never sleeps...
    • John Donovan
Re: New method for calibration of dead times (and picoammeter)
« Reply #3 on: May 31, 2022, 09:44:19 AM »
OK, so because Probe Software was able to implement a method to automate the acquisition of the "constant k-ratio" test, that is acquire k-ratios at multiple beam currents as seen here:

https://probesoftware.com/smf/index.php?topic=40.msg10899#msg10899

To remind everyone, the traditional dead time calibration method relies on comparing count rates on a pure material (usually a pure metal such as Ti for LiF and PET or Si metal on PET or TAP), as a function of beam current.  While this new "constant k-ratio" method, attempts to calibrate both the dead time *and* any picoammeter non-linearity, by measuring k-ratios of a primary standard and a secondary standard, as a function of beam current.

The idea being that the k-ratio should remain constant as a function of beam current (at a given beam energy and takeoff angle). And while recognizing that this method is not a replacement for having a well calibrated picoammeter, it can reveal problems in one's picoammeter calibration.

I was able to acquire a pretty dense set of k-ratios for Zn Ka, Te La and Se la using pure metal primary standards and ZnTe and ZnSe using the following beam currents:  6, 8, 10, 15, 20, 40, 60, 80, 100, 120, 140, 160, 180 and 200 nA. This was 60 sec on-peak, 10 sec of-peak and 6 points per standard. So it took about 13 hours.

So let's start with an example of Zn Ka of LLIF, which had last been dead time calibrated (using the traditional dead time calibration method on Ti metal) at 3.5 usec.  Here is what we see using Zn as the primary standard and ZnTe as the secondary standard:


So we see two things: first that is a very large variance in the k-ratio! Second, there is an odd anomaly at 40 nA and third, that the dead time constant is too small, as the slope of the k-ratios is generally positive. 

Note the new "string selection" control in the Output | Output Standard Unknown XY Plots menu window in Probe for EPMA. Now let's use the Update Dead Time Constants dialog in Probe for EPMA as described here:

https://probesoftware.com/smf/index.php?topic=1442.msg10641#msg10641

and change the dead time constant in an attempt to obtain a more constant k-ratio trying 3.8 usec first:


So that is a bit improved as one can see from the y axis k-ratio range. But there is still a large range of k-ratio as a function of beam current, and I suspect it is related to the picoammeter (mis-calibration). Remember, on a Cameca instrument, the beam current ranges are 0 to 5 nA, 5 to 50 nA and 50 nA to 500 nA (I think, but please correct me if that is wrong!).

I will provide another example soon, but please let me know what you think and/or if you have any "constant k-ratio" data to share on your JEOL or Cameca instrument.

By the way, what are the beam current ranges for the JEOL picoammeters?
« Last Edit: May 31, 2022, 09:46:50 AM by Probeman »
The only stupid question is the one not asked!

Probeman

  • Emeritus
  • *****
  • Posts: 2822
  • Never sleeps...
    • John Donovan
Re: New method for calibration of dead times (and picoammeter)
« Reply #4 on: May 31, 2022, 11:40:15 AM »
Then again, maybe not!

So considering this is a large area crystal we might expect that such high count rates might require the use of the high precision dead time correction as seen here:


and documented here:


So using this high precision dead time expression with the original dead time constant of 3.5 usec we get a much different plot:


So now we have a too large dead time constant!  What would it take to get a more constant k-ratio as a function of beam current? How about 2.9 usec?


OK, so that is better, though there is still an anomaly at 40 nA and the high precision equation starts to break down at beam current over 100 nA, but it's pretty constant (expect for 40 nA) up to around 100 nA. 

So several conclusions.

1. I still think my picoammeter needs adjustment with the high precision current source (we're working on that), particularly given the the issue at 40 nA.

2. I think we might try a "super" high precision dead time correction with a 3rd factorial term.   :o

Finally, given these results I agree with Owen Neill who said recently that we all should be using the high precision dead time equation option in Probe for EPMA for best accuracy.

More to come, but in the meantime here's Te La on a PET crystal (about half the x-ray count rate as Zn ka on LLiF), which is actually quite good except for the "glitch" at 40 nA:


Because the count rate was lower than the LLiF, we don't see the need for a "super" high precision dead time correction but I think we will see if Donovan will implement that for us...
The only stupid question is the one not asked!

sem-geologist

  • Professor
  • ****
  • Posts: 300
Re: New method for calibration of dead times (and picoammeter)
« Reply #5 on: May 31, 2022, 02:11:46 PM »
So that is a bit improved as one can see from the y axis k-ratio range. But there is still a large range of k-ratio as a function of beam current, and I suspect it is related to the picoammeter (mis-calibration). Remember, on a Cameca instrument, the beam current ranges are 0 to 5 nA, 5 to 50 nA and 50 nA to 500 nA (I think, but please correct me if that is wrong!).

Yes.
Cameca has 5 ranges:
up to 0.5nA, 0.5-5nA, 5-50nA, 50-500nA, 500nA-10µA (yes you read it right, last bin is up to 10 micro Amperes, and it is possible to get beam currents of few µA on SX100 and SXFiveFE).
Now I see Your range 5 to 50 is probably misaligned. Probably, as the data covers only 1 and a half from 5 picoamperometer ranges.
This whole en-devour in my humble opinion is wrong way from finding, identifying and fixing problems where it originates, and it completely mingles two completely not related issues or shuffles the weight of one onto other and reverse. Which of your current measurement ranges are correct? 5-50, or 50-500nA? because I see in the end You had settled on 2.9µs which somehow "flattens" the k-ratios at 50-500, but I see clearly that 2.9µs at range at 5-50nA is clearly wrong. The measurement at 40nA probably are not anomaly at all, and rather 50-500 range is wrong. it would be interesting to see intensity changes at points 480nA, 498nA, 502nA, 520nA, if there would be step between 498 and 502 it would tell that 50-500 range is wrong (of course only if 500nA-10µA range is closer to correct measurement). Also 5-50 range is a bit tricky as at that range some beam-crossover funkiness happens. Are Your beam well aligned? Try using different I-emission - that moves that crossover point to different C1 and C2 position (and also different nA value) and could move the possible point of current anomaly to different spot - and that could identify problem of/or if "part of the beam-missing the faraday cup".

As all ranges are available on SXFiveFE effortlessly I had done such tests to make sure that the beam current measurement is continues with crossing the ranges, ant it was perfect curved line in beam current vs count rate with no discontinuities or visible steps at 500, 50, 5, 0.5nA. (the critical part is to include measurements from both sides close to it , i.e. 505 and 495nA, or 0.55nA and 0.45nA and so on). Had not seen such discontinuities on SXFiveFE (the column is different from tungsten/LaB6 one), I am going to check SX100 as soon as possible.
And that is correct procedure to check the picoamperometer continuity without going into dead time, which are counter issues. and k-ratios just sums all issues into single lump hiding the precise origin of it.
For checking picoamperometer linearity I would skip the WDS and its gas counting electronics at all. Or at least I would choose very weak lines and moderate concentrations ) i.e. 2nd order lines. So that dead-time non linearity would not bother the measurement up to those 200nA. As for measurement, fixed 60s for 200nA and same for 5nA beam is unfair. It would be better to count up to some fixed count number thus 5nA would be counted much longer, and 200nA much shorter (or normally as for 2nd order weak lines).
But even better, if Your probe is equipped with SDD EDS detector why not use total counts from that for current vs x-rays, as EDS has very sophisticated electronic hardware for dealing with pulse pile-ups (none on WDS), and with selected high throughput (or shortest shaping time) and (if equipped) medium or small aperture that should give really much better insight to picoamperometer and its linearity with no problem up to 200nA.

Only after identifying the picoamperometer (beam-faraday-cup) issues, artefacts and workarounds or fixes, it is sensible to move with dead time estimation and calibration.

BTW. You came to value of 2.9µs. What dead time is set in your Peaksight? 3µs?
« Last Edit: May 31, 2022, 02:23:52 PM by sem-geologist »

Probeman

  • Emeritus
  • *****
  • Posts: 2822
  • Never sleeps...
    • John Donovan
Re: New method for calibration of dead times (and picoammeter)
« Reply #6 on: May 31, 2022, 03:51:36 PM »
I agree that this measurement mingles both the dead time calibration and the picoammeter calibrations. This point was clearly stated in the opening post.

However, to my mind the value of this method is, that it gives one a quantitative understanding of the total mis-calibration of the instrument.  These are instruments that merely generate k-ratios after all!

If all is good, then one is good. If not good, then how good or how bad?  This can be ascertained by looking at the Y axis in k-ratio units which for major elements is close to the concentrations (assuming the primary standard is a pure element, and if not, it is a simple calculation).

For me at least I find this helpful.  However, this method does re-iterate the need for a better dead time correction in software *and* an honest to god picoammeter calibration, which we are working on.

That said, it was pleasing to see the accuracy of the Te La line up to even 200 nA.  And as promised here is a closer look at the picoammeter (mis)calibration on Te La up to 100 nA (run last night).


Not terrible at least, actually a sub percent level of variance.  But we are proceeding with obtaining a high accuracy current source nonetheless...
« Last Edit: May 31, 2022, 05:26:33 PM by Probeman »
The only stupid question is the one not asked!

John Donovan

  • Administrator
  • Emeritus
  • *****
  • Posts: 3263
  • Other duties as assigned...
    • Probe Software
Re: New method for calibration of dead times (and picoammeter)
« Reply #7 on: June 01, 2022, 01:26:58 PM »
So you all will remember Probeman showed this plot above using the high precision dead time equation for the Zn Ka line of LLiF with a dead time of 2.9 usec:


Well, just for fun we've implemented a three term factorial dead time expression which we call the "super high precision" deadtime expression.  It only really affects count rates above 100K cps.  But in the above Zn Ka plot the Zinc standard is producing 140K cps at 200 nA on a LLIF crystal!

Even setting the 40 nA k-ratios issue aside, we still have some picoammeter calibration issues, but the high current k-ratio values are a bit more consistent:


What's amazing is how sensitive the dead time constant is when one is at such high count rates!  Just a difference of 0.01 usec makes a visible difference.
John J. Donovan, Pres. 
(541) 343-3400

"Not Absolutely Certain, Yet Reliable"

Probeman

  • Emeritus
  • *****
  • Posts: 2822
  • Never sleeps...
    • John Donovan
Re: New method for calibration of dead times (and picoammeter)
« Reply #8 on: June 01, 2022, 05:49:42 PM »
Once ones dead time constants are properly adjusted, it's a bit amazing how accurate things can get.

Here is an analysis of ZnTe using Zn, Se and Te pure metal standards at 6 nA:

St  658 Set   1 ZnTe (synthetic), Results in Elemental Weight Percents
 
ELEM:       Zn      Se      Te      Te      Zn
TYPE:     ANAL    ANAL    ANAL    ANAL    ANAL
BGDS:      EXP     EXP     LIN     LIN     LIN
TIME:    60.00   60.00   60.00     .00     .00
BEAM:     6.81    6.81    6.81     .00     .00
AGGR:        2               2               

ELEM:       Zn      Se      Te      Te      Zn   SUM 
XRAY:     (ka)    (la)    (la)    (la)    (ka)
    19  33.714   -.047  66.562    .000    .000 100.229
    20  33.838   -.110  66.537    .000    .000 100.265
    21  33.835   -.084  66.782    .000    .000 100.533
    22  33.781   -.050  66.650    .000    .000 100.381
    23  33.821   -.063  66.776    .000    .000 100.533
    24  33.860   -.030  67.059    .000    .000 100.890

AVER:   33.808   -.064  66.728    .000    .000 100.472
SDEV:     .053    .029    .192    .000    .000    .242
SERR:     .022    .012    .078    .000    .000
%RSD:      .16  -45.42     .29   .0000   .0000

PUBL:   33.880    n.a.  66.120    n.a.    n.a. 100.000
%VAR:     -.21     ---     .92     .00     .00
DIFF:    -.072     ---    .608     ---     ---
STDS:      530     534     552       0       0

STKF:   1.0000  1.0000  1.0000   .0000   .0000
STCT:  1841.76 2019.25  749.16     .00     .00

UNKF:    .3628  -.0002   .6340   .0000   .0000
UNCT:   668.12    -.44  474.98     .00     .00
UNBG:    13.08    3.90    4.89     .00     .00

ZCOR:    .9320  2.9673  1.0524   .0000   .0000
KRAW:    .3628  -.0002   .6340   .0000   .0000
PKBG:    52.09     .89   98.07     .00     .00
INT%:     ---- -117.13    ----    ----    ----

And here at 200 nA:

St  658 Set  14 ZnTe (synthetic), Results in Elemental Weight Percents
 
ELEM:       Zn      Se      Te      Te      Zn
TYPE:     ANAL    ANAL    ANAL    ANAL    ANAL
BGDS:      EXP     EXP     LIN     LIN     LIN
TIME:    60.00   60.00   60.00     .00     .00
BEAM:   200.61  200.61  200.61     .00     .00
AGGR:        2               2               

ELEM:       Zn      Se      Te      Te      Zn   SUM 
XRAY:     (ka)    (la)    (la)    (la)    (ka)
   409  33.831   -.075  66.756    .000    .000 100.513
   410  33.847   -.065  66.751    .000    .000 100.533
   411  33.858   -.073  66.759    .000    .000 100.544
   412  33.861   -.063  66.778    .000    .000 100.575
   413  33.877   -.060  66.864    .000    .000 100.681
   414  33.890   -.066  66.870    .000    .000 100.694

AVER:   33.861   -.067  66.796    .000    .000 100.590
SDEV:     .021    .006    .055    .000    .000    .078
SERR:     .009    .002    .023    .000    .000
%RSD:      .06   -8.47     .08   .0000   .0000

PUBL:   33.880    n.a.  66.120    n.a.    n.a. 100.000
%VAR:     -.06     ---    1.02     .00     .00
DIFF:    -.019     ---    .676     ---     ---
STDS:      530     534     552       0       0

STKF:   1.0000  1.0000  1.0000   .0000   .0000
STCT:  1809.87 1841.21  749.56     .00     .00

UNKF:    .3633  -.0002   .6347   .0000   .0000
UNCT:   657.56    -.42  475.71     .00     .00
UNBG:    13.24    3.94    4.84     .00     .00

ZCOR:    .9320  2.9675  1.0524   .0000   .0000
KRAW:    .3633  -.0002   .6347   .0000   .0000
PKBG:    50.68     .89   99.20     .00     .00
INT%:     ---- -115.83    ----    ----    ----
« Last Edit: June 01, 2022, 07:47:03 PM by Probeman »
The only stupid question is the one not asked!

sem-geologist

  • Professor
  • ****
  • Posts: 300
Re: New method for calibration of dead times (and picoammeter)
« Reply #9 on: June 02, 2022, 07:17:39 AM »
probeman,
I want to ask again, what is the pulse blanking (the integer) value on the spectrometer of SX100 (the integer dtime, which is sent to cameca hardware when spectrometer is setup prior starting counting) for which You had found out the dead time to be 2.9µs?

Probeman

  • Emeritus
  • *****
  • Posts: 2822
  • Never sleeps...
    • John Donovan
Re: New method for calibration of dead times (and picoammeter)
« Reply #10 on: June 02, 2022, 08:37:29 AM »
probeman,
I want to ask again, what is the pulse blanking (the integer) value on the spectrometer of SX100 (the integer dtime, which is sent to cameca hardware when spectrometer is setup prior starting counting) for which You had found out the dead time to be 2.9µs?

Sorry, I saw your question and meant to reply, but wanted to get all 5 spectrometers calibrated. These are using the following emission lines:

      1      2       3         4       5
    PET    LTAP    LLIF      PET     LiF
   Te La   Se La   Zn Ka    Te La   Zn Ka

The "enforced" (integer) dead time for all the spectrometers is 3 usec. For my spectrometers I'm getting calibrated dead times of 2.85, 2.80, 2.80, 3.00 and 3.00 usec, respectively. The 3rd digit actually matters at high beam currents!   :o

But (to everyone), what I'm finding really interesting in all this is that based on these k-ratio versus beam current plots, the software dead time correction needs to be expanded to include more factorial terms for accuracy at high beam currents.

So, the "normal" dead time expression is:

Code: [Select]
' Normal deadtime correction
If DeadTimeCorrectionType% = 1 Then
temp# = 1# - cps! * dtime!
If temp# <> 0# Then cps! = cps! / temp#
End If

Which I've had as the default since forever.  In fact as seen below, this expression starts failing even at 20 to 30 nA on large area Bragg crystals!  So seeing as we are routinely getting close to 50K cps for many modern spectrometers, we really should, as Owen Neill has mentioned, be using (at least) the high precision form of the equation which is here:

Code: [Select]
' Precision deadtime correction
If DeadTimeCorrectionType% = 2 Then
temp# = 1# - (cps! * dtime! + cps! ^ 2 * (dtime! ^ 2) / 2#)
If temp# <> 0# Then cps! = cps! / temp#
End If

This "high precision" expression doesn't start failing until around 100 nA on large area Bragg crystals. So, what is clear to me now is, if we want to have excellent accuracy at even higher beam currents, we really need to utilize a more extended version of the dead time equation, which I have attempted to implement here:

Code: [Select]
' Super precision deadtime correction
If DeadTimeCorrectionType% = 3 Then
temp2# = 0#
For n& = 2 To 6
temp2# = temp2# + cps! ^ n& * (dtime! ^ n&) / n&
Next n&
temp# = 1# - (cps! * dtime! + temp2#)
If temp# <> 0# Then cps! = cps! / temp#
End If

So this uses exponents up to ^6!

Honestly I had never previously appreciated the importance of the dead time expression having enough factorial terms, until I started plotting up these k-ratio versus beam current plots. What a revelation I have to say.  ;D

Here is what I mean. Using the normal dead time expression we obtain this on ZnTe/Zn on my LLiF spectrometer:


As one can see it begins to fail at around 20 to 30 nA (ignoring the "glitch" at 40 nA). Now let's try the "high precision" version of the dead time expression with the extra factorial term:


And here is the Zn Ka data using the dead time expression with 6(!) factorial terms:


So there's still something not quite right with my picoammeter (which I will discuss in my next post), but I have to say this has been a real learning experience for me.
« Last Edit: June 02, 2022, 09:08:34 AM by Probeman »
The only stupid question is the one not asked!

John Donovan

  • Administrator
  • Emeritus
  • *****
  • Posts: 3263
  • Other duties as assigned...
    • Probe Software
Re: New method for calibration of dead times (and picoammeter)
« Reply #11 on: June 02, 2022, 08:42:36 AM »
This "super high precision" dead time correction is now available in the latest version 13.1.5 Probe for EPMA.


We're calling it the "three factorial expression", but as Probeman mentioned above it's actually 6 factorials!
John J. Donovan, Pres. 
(541) 343-3400

"Not Absolutely Certain, Yet Reliable"

Probeman

  • Emeritus
  • *****
  • Posts: 2822
  • Never sleeps...
    • John Donovan
Re: New method for calibration of dead times (and picoammeter)
« Reply #12 on: June 02, 2022, 12:35:51 PM »
And here is the Zn Ka data using the dead time expression with 6(!) factorial terms:


So there's still something not quite right with my picoammeter (which I will discuss in my next post), but I have to say this has been a real learning experience for me.

So here is why I think the k-ratios take a small dip in the quoted plot above:


Note that this is a plot of the Zn on-peak counts (not k-ratio) and notice also that the dip in the k-ratio plot seems to correspond with the bump in the on-peak counts.

I suspect that this is why my picoammeter needs adjustment. Finally, as Mike Jercinovic has pointed out, if the problem is in the picoammeter, the mis-calibration should show in all spectrometers and these plots would seem to confirm that:


I suspect the "break" in the 40 nA beam current setting in the k-ratio plots (as seen in previous posts) may only be a beam current regulation issue for Cameca instruments at that "crossover").
« Last Edit: June 02, 2022, 12:39:12 PM by Probeman »
The only stupid question is the one not asked!

Probeman

  • Emeritus
  • *****
  • Posts: 2822
  • Never sleeps...
    • John Donovan
Re: New method for calibration of dead times (and picoammeter)
« Reply #13 on: June 03, 2022, 09:38:16 AM »
To summarize:

1. We should all be using the "high precision" dead time expression (or even better the "super high precision" dead time expression!) for correction of measured intensities in software.

2. One can test the overall accuracy of the dead time calibration and the picoammeter calibration using the "constant k-ratio" test, where one measures k-ratios over a range of beam currents.  These measured k-ratios should (ideally) be constant (within counting precision) as a function of beam current (for a given beam energy and takeoff angle).

The constant k-ratio test is useful because it yields a plot that is easily interpreted in order to evaluate the overall accuracy of the k-ratios produced by the instrument.

3. Once the dead time constants in software are adjusted until the resulting k-ratios are as constant as possible, then any remaining inaccuracy is due to the picoammeter (mis)calibration.

4. The picoammeter calibration accuracy can be seen by a simple plot of cps/nA (dead time corrected) as a function of beam current. The on-peak intensities should ideally be constant as a function of beam current.

5. The dead time calibration of each spectrometer is easily performed using the constant k-ratio test, but you may need to consult with your instrument engineer to perform a calibration of your picoammeter.
« Last Edit: June 03, 2022, 09:40:03 AM by Probeman »
The only stupid question is the one not asked!

John Donovan

  • Administrator
  • Emeritus
  • *****
  • Posts: 3263
  • Other duties as assigned...
    • Probe Software
Re: New method for calibration of dead times (and picoammeter)
« Reply #14 on: June 03, 2022, 12:35:25 PM »
OK, so this may help.

Here are some analyses using pure metal standards acquired at 10 nA, and the secondary standards acquired at 200 nA!   First ZnTe at 200 nA:

St  658 Set  14 ZnTe (synthetic), Results in Elemental Weight Percents
 
ELEM:       Zn      Se      Te      Te      Zn
TYPE:     ANAL    ANAL    ANAL    ANAL    ANAL
BGDS:      EXP     EXP     LIN     LIN     LIN
TIME:    60.00   60.00   60.00     .00     .00
BEAM:   200.61  200.61  200.61     .00     .00
AGGR:        2               2               

ELEM:       Zn      Se      Te      Te      Zn   SUM 
XRAY:     (ka)    (la)    (la)    (la)    (ka)
   409  33.512   -.063  66.857    .000    .000 100.306
   410  33.528   -.054  66.851    .000    .000 100.325
   411  33.539   -.061  66.860    .000    .000 100.337
   412  33.542   -.053  66.878    .000    .000 100.367
   413  33.558   -.050  66.964    .000    .000 100.473
   414  33.571   -.056  66.971    .000    .000 100.486

AVER:   33.542   -.056  66.897    .000    .000 100.382
SDEV:     .021    .005    .055    .000    .000    .078
SERR:     .009    .002    .023    .000    .000
%RSD:      .06   -9.22     .08   .0000   .0000

PUBL:   33.880    n.a.  66.120    n.a.    n.a. 100.000
%VAR:    -1.00     ---    1.17     .00     .00
DIFF:    -.338     ---    .777     ---     ---
STDS:      530     534     552       0       0

STKF:   1.0000  1.0000  1.0000   .0000   .0000
STCT:  1837.10 2016.76  748.16     .00     .00

UNKF:    .3600  -.0002   .6359   .0000   .0000
UNCT:   661.35    -.38  475.71     .00     .00
UNBG:    13.24    3.94    4.84     .00     .00

ZCOR:    .9317  2.9644  1.0521   .0000   .0000
KRAW:    .3600  -.0002   .6358   .0000   .0000
PKBG:    50.97     .90   99.20     .00     .00
INT%:     ---- -114.56    ----    ----    ----

And now ZeSe at 200 nA:

St  660 Set  14 ZnSe (synthetic), Results in Elemental Weight Percents
 
ELEM:       Zn      Se      Te      Te      Zn
TYPE:     ANAL    ANAL    ANAL    ANAL    ANAL
BGDS:      EXP     EXP     LIN     LIN     LIN
TIME:    60.00   60.00   60.00     .00     .00
BEAM:   200.65  200.65  200.65     .00     .00
AGGR:        2               2               

ELEM:       Zn      Se      Te      Te      Zn   SUM 
XRAY:     (ka)    (la)    (la)    (la)    (ka)
   415  45.476  53.333   -.002    .000    .000  98.807
   416  45.427  53.872    .005    .000    .000  99.304
   417  45.356  54.034    .005    .000    .000  99.395
   418  45.457  53.843   -.001    .000    .000  99.299
   419  45.383  53.666   -.002    .000    .000  99.046
   420  45.181  53.264    .000    .000    .000  98.444

AVER:   45.380  53.669    .001    .000    .000  99.049
SDEV:     .107    .310    .003    .000    .000    .366
SERR:     .044    .127    .001    .000    .000
%RSD:      .24     .58  475.68   .0000   .0000

PUBL:   45.290  54.710    .000    n.a.    n.a. 100.000
%VAR:      .20   -1.90     .00     .00     .00
DIFF:     .090  -1.041    .000     ---     ---
STDS:      530     534     552       0       0

STKF:   1.0000  1.0000  1.0000   .0000   .0000
STCT:  1837.10 2016.76  748.16     .00     .00

UNKF:    .5029   .2512   .0000   .0000   .0000
UNCT:   923.85  506.53     .00     .00     .00
UNBG:    10.69    4.80    3.25     .00     .00

ZCOR:    .9024  2.1369  1.1714   .0000   .0000
KRAW:    .5029   .2512   .0000   .0000   .0000
PKBG:    87.42  106.59    1.00     .00     .00
INT%:     ----     .00    ----    ----    ----


And remember, this is with the picoammeter still not calibrated properly!    :o

I would very much welcome seeing constant k-ratio data from other instruments... if you want feel free to call me and I can talk you through the procedure in Probe for EPMA. It's completely automated now!   ;D
« Last Edit: June 04, 2022, 08:22:35 AM by John Donovan »
John J. Donovan, Pres. 
(541) 343-3400

"Not Absolutely Certain, Yet Reliable"