Author Topic: Blank correction for analysis of vanadium in rutile  (Read 3355 times)

JonF

  • Professor
  • ****
  • Posts: 155
Re: Blank correction for analysis of vanadium in rutile
« Reply #15 on: September 19, 2021, 12:55:12 PM »
Looking at the spectra from the first post of this thread, aren't the interfering Ti Kb'' and Ti Kb5 emission lines coming from bonding shells?
I'd guess that would raise the question of suitability of e.g. TiC as an interference correction for TiO2 etc, as well as any issues from the proximity to the absorption edge.

Probeman

  • Emeritus
  • *****
  • Posts: 2856
  • Never sleeps...
    • John Donovan
Re: Blank correction for analysis of vanadium in rutile
« Reply #16 on: September 19, 2021, 01:21:04 PM »
Further, the Ti K absorption edge will be more difficult to see using PET due to its poorer resolution than LiF.  I never, ever use PET to analyze for vanadium in the presence of easily measurable titanium.

Of course I realize everything you are saying.  I'm *not* saying one should use a PET crystal for this interference. I'm simply performing a "failure mode" analysis using the PET.  As they (don't) say: "Failure is an (analysis) option"!   ;D

It's a worst case scenario for the interference and blank corrections. I'm just trying to understand why we're still off by 160 PPM (+/- 60 PPM) even with both corrections turned on...
The only stupid question is the one not asked!

Probeman

  • Emeritus
  • *****
  • Posts: 2856
  • Never sleeps...
    • John Donovan
Re: Blank correction for analysis of vanadium in rutile
« Reply #17 on: September 19, 2021, 01:30:06 PM »
Looking at the spectra from the first post of this thread, aren't the interfering Ti Kb'' and Ti Kb5 emission lines coming from bonding shells?
I'd guess that would raise the question of suitability of e.g. TiC as an interference correction for TiO2 etc, as well as any issues from the proximity to the absorption edge.

Oh, good point!

OK, changing the interference standard to TiC, we now get this (without the blank correction) for the unknown blank TiC (because otherwise we'd be analyzing the interference standard assigned to itself):

ELEM:       Ti      Ti       V       V      Sr      Fe      Cr      Mn       C   SUM 
XRAY:     (ka)    (ka)    (ka)    (ka)      ()      ()      ()      ()      ()
   162  80.067    .000   -.018    .000    .000    .000    .000    .000  20.000 100.050
   163  80.025    .000   -.005    .000    .000    .000    .000    .000  20.000 100.019
   164  79.850    .000   -.002    .000    .000    .000    .000    .000  20.000  99.849
   165  79.906    .000   -.001    .000    .000    .000    .000    .000  20.000  99.905
   166  79.749    .000   -.016    .000    .000    .000    .000    .000  20.000  99.734
   167  80.031    .000    .012    .000    .000    .000    .000    .000  20.000 100.043

AVER:   79.938    .000   -.005    .000    .000    .000    .000    .000  20.000  99.933
SDEV:     .124    .000    .011    .000    .000    .000    .000    .000    .000    .127
SERR:     .051    .000    .004    .000    .000    .000    .000    .000    .000
%RSD:      .16   .0000 -220.33   .0000     .00     .00     .00     .00     .00
STDS:      922       0     923       0     ---     ---     ---     ---     ---

And with both the interference and blank corrections turned on we now get this for the standard TiC (again similarly so we're not analyzing the blank unknown assigned to itself):

ELEM:       Ti      Ti       V       V      Sr      Fe      Cr      Mn       C   SUM 
XRAY:     (ka)    (ka)    (ka)    (ka)      ()      ()      ()      ()      ()
   162  80.067    .000   -.013    .000    .000    .000    .000    .000  20.000 100.054
   163  80.024    .000    .000    .000    .000    .000    .000    .000  20.000 100.024
   164  79.850    .000    .003    .000    .000    .000    .000    .000  20.000  99.853
   165  79.906    .000    .004    .000    .000    .000    .000    .000  20.000  99.909
   166  79.749    .000   -.011    .000    .000    .000    .000    .000  20.000  99.738
   167  80.031    .000    .017    .000    .000    .000    .000    .000  20.000 100.048

AVER:   79.938    .000    .000    .000    .000    .000    .000    .000  20.000  99.938
SDEV:     .124    .000    .011    .000    .000    .000    .000    .000    .000    .127
SERR:     .051    .000    .004    .000    .000    .000    .000    .000    .000
%RSD:      .16   .0000    ----   .0000     .00     .00     .00     .00     .00
STDS:      922       0     923       0     ---     ---     ---     ---     ---

Both still using the TiO2 as the primary standard for Ti and V2O3 as the primary standard for V, because you know, standards don't really have much of an effect for trace elements!  It's all in the background measurement and corrections...

Thanks, Jon!
« Last Edit: September 19, 2021, 01:32:32 PM by Probeman »
The only stupid question is the one not asked!

Probeman

  • Emeritus
  • *****
  • Posts: 2856
  • Never sleeps...
    • John Donovan
Re: Blank correction for analysis of vanadium in rutile
« Reply #18 on: September 19, 2021, 03:21:25 PM »
So it would appear that the differences in intensities due to the bonding between these Ti satellite lines in TiO2 and TiC are on the order of 160 PPM or so. I can buy that.

Here are the V Ka scans on SrTiO3 for LiF and next PET:


Does it make any sense to say that the interference correction deals with the Ti Kb overlaps and the blank correction deals with the interpolation across the Ti K absorption edge?
The only stupid question is the one not asked!

Brian Joy

  • Professor
  • ****
  • Posts: 296
Re: Blank correction for analysis of vanadium in rutile
« Reply #19 on: September 19, 2021, 03:59:15 PM »
Does it make any sense to say that the interference correction deals with the Ti Kb overlaps and the blank correction deals with the interpolation across the Ti K absorption edge?

But an absorption edge is always present on the low-Bragg-angle side of any Kβ peak.

Also, how likely is the bonding environment to affect positions of TiKβ1,3 (IUPAC: K-M3,2), TiKβ5, or any satellites?  Positions/shapes of K peaks and satellites certainly vary with bonding environment for elements of lower atomic number (at least up through sulfur), but transitions involving the Ti K shell are relatively isolated from those effects.  Can you show that the Ti Kβ satellites are in noticeably different positions for TiC than for TiO2?  I haven't checked this (but I don't have TiC on hand).

« Last Edit: September 19, 2021, 07:28:00 PM by Brian Joy »
Brian Joy
Queen's University
Kingston, Ontario
JEOL JXA-8230

Probeman

  • Emeritus
  • *****
  • Posts: 2856
  • Never sleeps...
    • John Donovan
Re: Blank correction for analysis of vanadium in rutile
« Reply #20 on: September 19, 2021, 04:45:19 PM »
Does it make any sense to say that the interference correction deals with the Ti Kb overlaps and the blank correction deals with the interpolation across the Ti K absorption edge?

But an absorption edge is always present on the low-Bragg-angle side of any Kβ peak.

Of course, but the example we're using in this case is V Ka across the Ti K edge.

Also, how likely is the bonding environment to affect positions of TiKβ1,3 (IUPAC: K-M3,2), TiKβ5, or any satellites?  Positions/shapes of K peaks and satellites certainly vary with bonding environment for elements of lower atomic number (at least up through sulfur), but the Ti K shell is relatively isolated from those effects.  Can you show that the Ti Kβ satellites are in noticeably different positions for TiC than for TiO2?  I haven't checked this (but I don't have TiC on hand).

It's a good question and I don't know the answer. 

But that fact that between using TiO2 and TiC as the interference standard, the intensity difference was only 160 PPM seems "relatively isolated" to me.
The only stupid question is the one not asked!

Brian Joy

  • Professor
  • ****
  • Posts: 296
Re: Blank correction for analysis of vanadium in rutile
« Reply #21 on: September 19, 2021, 08:38:28 PM »
It's a good question and I don't know the answer. 

But that fact that between using TiO2 and TiC as the interference standard, the intensity difference was only 160 PPM seems "relatively isolated" to me.

Now I’m really curious about this.  I might have time tomorrow to do detailed wavelength scans around Ti Kβ for both Ti metal and synthetic TiO2 and then overlay the plots after normalizing to the height of Ti Kβ1,3.

I’ve done this sort of test before with elemental Si versus SiO2 (and silicates in general) using PET.  The positions and intensities of the Si Kβ satellites are affected strongly by the electronic environment.  Unfortunately, one of those satellites causes problems in locating a suitable low-angle background offset position for Sr Lα (on PET).  The database positions for the satellites are certainly those for elemental Si.
Brian Joy
Queen's University
Kingston, Ontario
JEOL JXA-8230

JonF

  • Professor
  • ****
  • Posts: 155
Re: Blank correction for analysis of vanadium in rutile
« Reply #22 on: September 20, 2021, 03:26:16 AM »
It's a good question and I don't know the answer. 

But that fact that between using TiO2 and TiC as the interference standard, the intensity difference was only 160 PPM seems "relatively isolated" to me.

Now I’m really curious about this.  I might have time tomorrow to do detailed wavelength scans around Ti Kβ for both Ti metal and synthetic TiO2 and then overlay the plots after normalizing to the height of Ti Kβ1,3.


I think those detailed wavelength scans around the Ti Kb satellites in the V Ka position should be quite revealing, one way or another!

Doing some quick googling around, I've overlaid some (open access) Ti K XANES spectra over the Ti Kb emission scan from the first post:


The main thing that occurs to me is that although there are a lot of post/pre edge structures (including a dip in the TiC XANES profile at ~ John's low background position at ~61320/171.7 mm/5.02 keV, TiC spectra not shown), there doesn't appear to be anything significant over the V Ka peak position (although that is extrapolating to the low energy side of the XANES profiles).

Also, how likely is the bonding environment to affect positions of TiKβ1,3 (IUPAC: K-M3,2), TiKβ5, or any satellites?  Positions/shapes of K peaks and satellites certainly vary with bonding environment for elements of lower atomic number (at least up through sulfur), but transitions involving the Ti K shell are relatively isolated from those effects.  Can you show that the Ti Kβ satellites are in noticeably different positions for TiC than for TiO2?  I haven't checked this (but I don't have TiC on hand).

The K shell of the 3d TMs is certainly isolated, but the Ti Kb'' and Ti Kb2,5 are valence to core transitions coming in from the 3d (M) shell as described by Castillo et al (2020) (https://doi.org/10.1002/anie.202003621, also open access). These are likely to wander all over the show, both in terms of position (e.g. quantized energy difference) and intensity (e.g. emission probability). How much of all this we can see using our probes is anyone's guess, but it is otherwise a bit coincidental that the Ti interference on V Ka is seemingly on top of these valence-to-core emissions. 


JonF

  • Professor
  • ****
  • Posts: 155
Re: Blank correction for analysis of vanadium in rutile
« Reply #23 on: September 20, 2021, 03:58:54 AM »
To try and explain more what I'm thinking, I think that the background (whether off peak or MAN) and blank corrections are essentially giving us the green line from the second plot:


Then from that V Ka1 we're subtracting the Ti Kb2,5 and Ti Kb'' contributions plus the Ti Kb1,3 shoulder.
My concern is that the Kb2,5 and Kb'' intensities that are being subtracted are only applicable to similar (same?) chemical species due to them originating from bonding shell environments, resulting in either an under- or over-correction (depending on what we're measuring e.g. TiO2 and what we're using as an interference standard e.g. TiC, and therefore contribution of the Ti to the V Ka emission).
Moving then on to other Ti species, is the TiO2- or TiC-determined TiKb2,5 and Ti Kb'' interference measurement going to correct by the right amount? 


Brian Joy

  • Professor
  • ****
  • Posts: 296
Re: Blank correction for analysis of vanadium in rutile
« Reply #24 on: September 20, 2021, 01:19:09 PM »
I think those detailed wavelength scans around the Ti Kb satellites in the V Ka position should be quite revealing, one way or another!

Hi Jon,

Don’t forget that it’s federal election day in Canada!  See how your favourite candidate has done:  https://www.cbc.ca/news

Below are some near-edge scans of Ti metal and synthetic TiO2.  In each case, I’ve normalized the scan to the respective height of Ti Kβ1,3.  The relative intensities of Ti Kβ5 and those of the satellites appear to be variable depending on the electronic environment.  In particular, Ti SKβ’’ is obvious in the TiO2 scan, but not in the Ti metal scan.  Note that the Ti Kβ5 peak appears in essentially the same position in both materials (or at least the difference is undetectable).


Also, here is an old set of scans of elemental Si and SiO2 (not normalized).  Note the prominence of a satellite -- Si SKβ’? -- in SiO2 at ~218.3 mm, only about 1.5 mm below the position of Sr Lα1,2.


« Last Edit: September 20, 2021, 01:25:03 PM by Brian Joy »
Brian Joy
Queen's University
Kingston, Ontario
JEOL JXA-8230

Probeman

  • Emeritus
  • *****
  • Posts: 2856
  • Never sleeps...
    • John Donovan
Re: Blank correction for analysis of vanadium in rutile
« Reply #25 on: September 24, 2021, 10:47:25 AM »
I ran some additional high precision (15 keV, 50 nA, 10 um, 100 seconds per point, 400 points) scans on both LLIF and LPET crystals. Here are the LLIF scans for Va Ka on both TiO2 and TiC normalized to the Ti Kb:
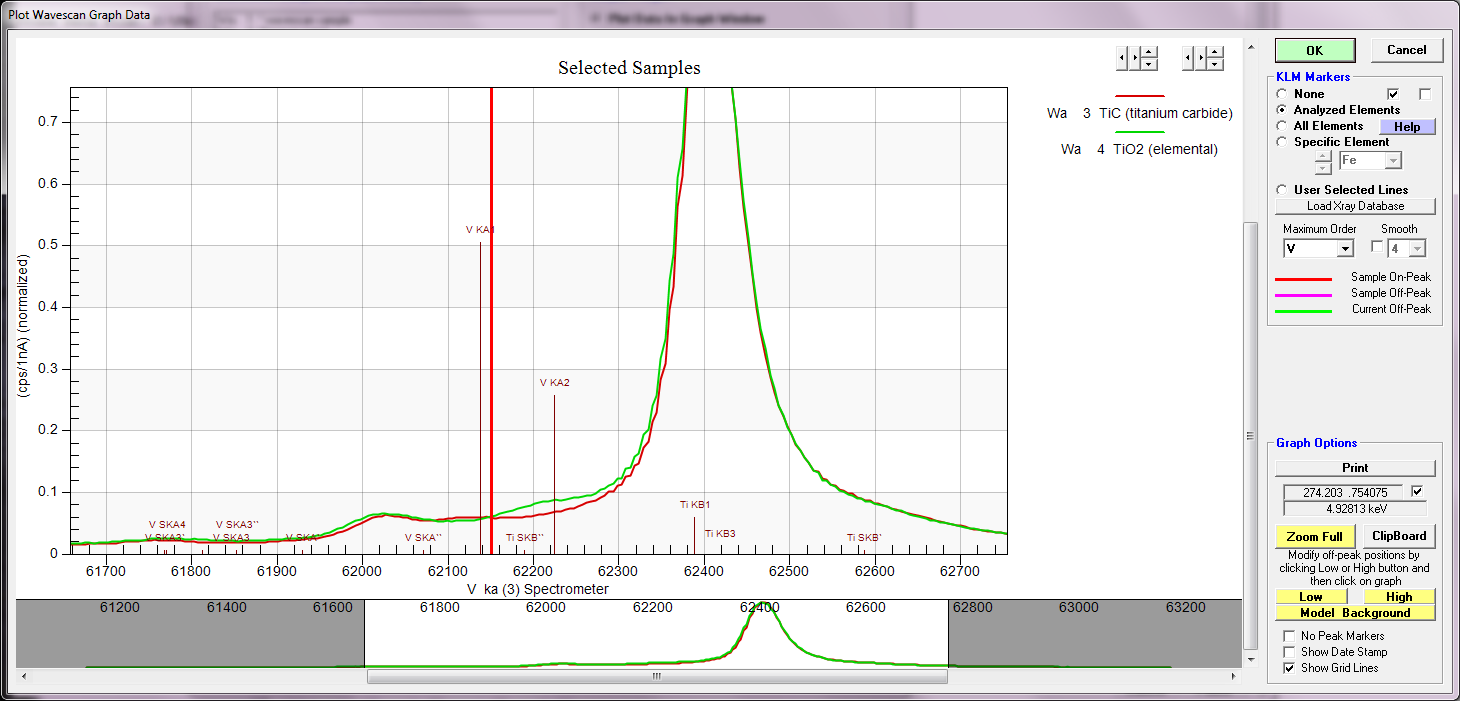


and here for LPET:


So I don't understand completely what is going on but here's a few observations regrading these interferences/blank corrections when analyzing TiC using TiO2 for both the primary standard and for the interference standard for the quantitative interference correction...  it's amazing it works as well as it does!   ;D

First here we have no interference or blank corrections using only LIF crystals on TiC:

ELEM:       Ti    Ti-D       V     V-D      Sr      Fe      Cr      Mn       C   SUM 
XRAY:     (ka)    (ka)    (ka)    (ka)      ()      ()      ()      ()      ()
   162  78.759     ---    .725     ---    .000    .000    .000    .000  20.000  99.484
   163  78.540     ---    .720     ---    .000    .000    .000    .000  20.000  99.260
   164  78.196     ---    .723     ---    .000    .000    .000    .000  20.000  98.919
   165  78.437     ---    .737     ---    .000    .000    .000    .000  20.000  99.174
   166  78.628     ---    .720     ---    .000    .000    .000    .000  20.000  99.348
   167  78.765     ---    .701     ---    .000    .000    .000    .000  20.000  99.466

AVER:   78.554     ---    .721     ---    .000    .000    .000    .000  20.000  99.275
SDEV:     .216     ---    .012     ---    .000    .000    .000    .000    .000    .211
SERR:     .088     ---    .005     ---    .000    .000    .000    .000    .000
%RSD:      .28     ---    1.63     ---     .00     .00     .00     .00     .00
STDS:      922     ---     923     ---     ---     ---     ---     ---     ---

If we turn on the interference correction using TiO2 as our interference standard only we get this:

ELEM:       Ti      Ti       V       V      Sr      Fe      Cr      Mn       C
TYPE:     ANAL    ANAL    ANAL    ANAL    SPEC    SPEC    SPEC    SPEC    SPEC
BGDS:      LIN     EXP     LIN     EXP
TIME:    60.00     ---   60.00     ---     ---     ---     ---     ---     ---
BEAM:    30.03     ---   30.03     ---     ---     ---     ---     ---     ---

ELEM:       Ti    Ti-D       V     V-D      Sr      Fe      Cr      Mn       C   SUM 
XRAY:     (ka)    (ka)    (ka)    (ka)      ()      ()      ()      ()      ()
   162  78.797     ---    .008     ---    .000    .000    .000    .000  20.000  98.805
   163  78.577     ---    .005     ---    .000    .000    .000    .000  20.000  98.583
   164  78.233     ---    .011     ---    .000    .000    .000    .000  20.000  98.245
   165  78.474     ---    .024     ---    .000    .000    .000    .000  20.000  98.498
   166  78.665     ---    .004     ---    .000    .000    .000    .000  20.000  98.670
   167  78.803     ---   -.016     ---    .000    .000    .000    .000  20.000  98.787

AVER:   78.592     ---    .006     ---    .000    .000    .000    .000  20.000  98.598
SDEV:     .216     ---    .013     ---    .000    .000    .000    .000    .000    .209
SERR:     .088     ---    .005     ---    .000    .000    .000    .000    .000
%RSD:      .28     ---  211.68     ---     .00     .00     .00     .00     .00
STDS:      922     ---     923     ---     ---     ---     ---     ---     ---

The vanadium is within a standard deviation.  One could also simply apply the TiC standard (acquired as an unknown) as a blank without an interference correction as seen here:

ELEM:       Ti    Ti-D       V     V-D      Sr      Fe      Cr      Mn       C   SUM 
XRAY:     (ka)    (ka)    (ka)    (ka)      ()      ()      ()      ()      ()
   174  78.239     ---    .012     ---    .000    .000    .000    .000  20.000  98.252
   175  78.794     ---    .003     ---    .000    .000    .000    .000  20.000  98.796
   176  78.508     ---    .017     ---    .000    .000    .000    .000  20.000  98.525
   177  78.669     ---    .013     ---    .000    .000    .000    .000  20.000  98.682
   178  78.899     ---   -.005     ---    .000    .000    .000    .000  20.000  98.895

AVER:   78.622     ---    .008     ---    .000    .000    .000    .000  20.000  98.630
SDEV:     .259     ---    .009     ---    .000    .000    .000    .000    .000    .252
SERR:     .116     ---    .004     ---    .000    .000    .000    .000    .000
%RSD:      .33     ---  109.73     ---     .00     .00     .00     .00     .00

PUBL:   80.000    n.a.    n.a.    n.a.    n.a.    n.a.    n.a.    n.a.  20.000 100.000
%VAR:    -1.72     ---     ---     ---     ---     ---     ---     ---     .00
DIFF:   -1.378     ---     ---     ---     ---     ---     ---     ---    .000
STDS:      922     ---     923     ---     ---     ---     ---     ---     ---

Also within a standard deviation. In this case either the interference correction or the blank correction appear to work equally well.

Now let's do a "failure mode" analysis on PET crystals! Again, not recommended, but an interesting failure mode test. Here is the TiC without an interference correction or a blank correction:

ELEM:     Ti-D      Ti     V-D       V      Sr      Fe      Cr      Mn       C   SUM 
XRAY:     (ka)    (ka)    (ka)    (ka)      ()      ()      ()      ()      ()
   162     ---  80.029     ---   3.952    .000    .000    .000    .000  20.000 103.980
   163     ---  80.008     ---   3.968    .000    .000    .000    .000  20.000 103.977
   164     ---  79.856     ---   3.965    .000    .000    .000    .000  20.000 103.821
   165     ---  79.888     ---   3.966    .000    .000    .000    .000  20.000 103.854
   166     ---  79.687     ---   3.947    .000    .000    .000    .000  20.000 103.634
   167     ---  79.986     ---   4.003    .000    .000    .000    .000  20.000 103.989

AVER:      ---  79.909     ---   3.967    .000    .000    .000    .000  20.000 103.876
SDEV:      ---    .129     ---    .020    .000    .000    .000    .000    .000    .139
SERR:      ---    .053     ---    .008    .000    .000    .000    .000    .000
%RSD:      ---     .16     ---     .50     .00     .00     .00     .00     .00
STDS:      ---     922     ---     923     ---     ---     ---     ---     ---

That's a big interference! Now let's turn on the interference correction using TiO2 as the interference standard:

ELEM:     Ti-D      Ti     V-D       V      Sr      Fe      Cr      Mn       C   SUM 
XRAY:     (ka)    (ka)    (ka)    (ka)      ()      ()      ()      ()      ()
   162     ---  80.229     ---   -.030    .000    .000    .000    .000  20.000 100.199
   163     ---  80.209     ---   -.014    .000    .000    .000    .000  20.000 100.195
   164     ---  80.056     ---   -.012    .000    .000    .000    .000  20.000 100.044
   165     ---  80.088     ---   -.014    .000    .000    .000    .000  20.000 100.075
   166     ---  79.887     ---   -.025    .000    .000    .000    .000  20.000  99.862
   167     ---  80.187     ---    .014    .000    .000    .000    .000  20.000 100.202

AVER:      ---  80.110     ---   -.014    .000    .000    .000    .000  20.000 100.096
SDEV:      ---    .129     ---    .015    .000    .000    .000    .000    .000    .134
SERR:      ---    .053     ---    .006    .000    .000    .000    .000    .000
%RSD:      ---     .16     --- -114.32     .00     .00     .00     .00     .00
STDS:      ---     922     ---     923     ---     ---     ---     ---     ---


A bit of an over correction, but still within a standard deviation!  Now just the blank correction using TiC as the blank:

ELEM:     Ti-D      Ti     V-D       V      Sr      Fe      Cr      Mn       C   SUM 
XRAY:     (ka)    (ka)    (ka)    (ka)      ()      ()      ()      ()      ()
   174     ---  80.149     ---    .041    .000    .000    .000    .000  20.000 100.191
   175     ---  79.987     ---    .036    .000    .000    .000    .000  20.000 100.023
   176     ---  80.062     ---    .026    .000    .000    .000    .000  20.000 100.088
   177     ---  80.420     ---    .040    .000    .000    .000    .000  20.000 100.461
   178     ---  80.240     ---    .047    .000    .000    .000    .000  20.000 100.287

AVER:      ---  80.172     ---    .038    .000    .000    .000    .000  20.000 100.210
SDEV:      ---    .168     ---    .008    .000    .000    .000    .000    .000    .172
SERR:      ---    .075     ---    .003    .000    .000    .000    .000    .000
%RSD:      ---     .21     ---   20.47     .00     .00     .00     .00     .00

PUBL:     n.a.  80.000    n.a.    n.a.    n.a.    n.a.    n.a.    n.a.  20.000 100.000
%VAR:      ---     .21     ---     ---     ---     ---     ---     ---     .00
DIFF:      ---    .172     ---     ---     ---     ---     ---     ---    .000
STDS:      ---     922     ---     923     ---     ---     ---     ---     ---

Not as good as the interference correction. Let's try turning both on!  First the software warns us with this message:


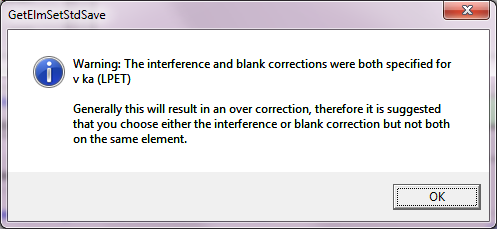
and here are the results with both corrections turned on:

ELEM:     Ti-D      Ti     V-D       V      Sr      Fe      Cr      Mn       C   SUM 
XRAY:     (ka)    (ka)    (ka)    (ka)      ()      ()      ()      ()      ()
   174     ---  80.169     ---   -.341    .000    .000    .000    .000  20.000  99.829
   175     ---  80.007     ---   -.338    .000    .000    .000    .000  20.000  99.669
   176     ---  80.082     ---   -.353    .000    .000    .000    .000  20.000  99.729
   177     ---  80.441     ---   -.358    .000    .000    .000    .000  20.000 100.083
   178     ---  80.261     ---   -.343    .000    .000    .000    .000  20.000  99.918

AVER:      ---  80.192     ---   -.346    .000    .000    .000    .000  20.000  99.846
SDEV:      ---    .169     ---    .009    .000    .000    .000    .000    .000    .163
SERR:      ---    .075     ---    .004    .000    .000    .000    .000    .000
%RSD:      ---     .21     ---   -2.51     .00     .00     .00     .00     .00

PUBL:     n.a.  80.000    n.a.    n.a.    n.a.    n.a.    n.a.    n.a.  20.000 100.000
%VAR:      ---     .24     ---     ---     ---     ---     ---     ---     .00
DIFF:      ---    .192     ---     ---     ---     ---     ---     ---    .000
STDS:      ---     922     ---     923     ---     ---     ---     ---     ---

Indeed an over correction!

I'm still trying to understand all of these implications, but it seems to me that the interference correction, because it is multiplicative, is best applied to artifacts that scale with concentration, while the blank correction, because it is subtractive, is best applied to artifacts that are more constant, for example continuum artifacts.

Just to finish up here is the LiF analysis with both the interference and blank corrections turned on:

ELEM:       Ti      Ti       V       V      Sr      Fe      Cr      Mn       C
TYPE:     ANAL    ANAL    ANAL    ANAL    SPEC    SPEC    SPEC    SPEC    SPEC
BGDS:      LIN     EXP     LIN     EXP
TIME:    60.00     ---   60.00     ---     ---     ---     ---     ---     ---
BEAM:    30.03     ---   30.03     ---     ---     ---     ---     ---     ---

ELEM:       Ti    Ti-D       V     V-D      Sr      Fe      Cr      Mn       C   SUM 
XRAY:     (ka)    (ka)    (ka)    (ka)      ()      ()      ()      ()      ()
   174  78.239     ---    .014     ---    .000    .000    .000    .000  20.000  98.253
   175  78.794     ---   -.001     ---    .000    .000    .000    .000  20.000  98.793
   176  78.508     ---    .016     ---    .000    .000    .000    .000  20.000  98.524
   177  78.669     ---    .010     ---    .000    .000    .000    .000  20.000  98.679
   178  78.900     ---   -.010     ---    .000    .000    .000    .000  20.000  98.890

AVER:   78.622     ---    .006     ---    .000    .000    .000    .000  20.000  98.628
SDEV:     .259     ---    .011     ---    .000    .000    .000    .000    .000    .250
SERR:     .116     ---    .005     ---    .000    .000    .000    .000    .000
%RSD:      .33     ---  190.48     ---     .00     .00     .00     .00     .00

PUBL:   80.000    n.a.    n.a.    n.a.    n.a.    n.a.    n.a.    n.a.  20.000 100.000
%VAR:    -1.72     ---     ---     ---     ---     ---     ---     ---     .00
DIFF:   -1.378     ---     ---     ---     ---     ---     ---     ---    .000
STDS:      922     ---     923     ---     ---     ---     ---     ---     ---

STKF:    .5552     ---   .6328     ---     ---     ---     ---     ---     ---
STCT:    45.56     ---  262.26     ---     ---     ---     ---     ---     ---

UNKF:    .7527     ---   .0001     ---     ---     ---     ---     ---     ---
UNCT:    61.78     ---     .02     ---     ---     ---     ---     ---     ---
UNBG:      .20     ---     .63     ---     ---     ---     ---     ---     ---

ZCOR:   1.0445     ---  1.0666     ---     ---     ---     ---     ---     ---
KRAW:   1.3558     ---   .0001     ---     ---     ---     ---     ---     ---
PKBG:   309.56     ---    1.04     ---     ---     ---     ---     ---     ---
INT%:     ----     ---  -98.39     ---     ---     ---     ---     ---     ---
BLNK#:    ----     ---       3     ---     ---     ---     ---     ---     ---
BLNKL:    ----     --- .000000     ---     ---     ---     ---     ---     ---
BLNKV:    ----     --- .006107     ---     ---     ---     ---     ---     ---

This does not appear to result in an over correction,  I suspect because the blank correction level is only 60 PPM.
« Last Edit: September 24, 2021, 12:57:44 PM by Probeman »
The only stupid question is the one not asked!

Probeman

  • Emeritus
  • *****
  • Posts: 2856
  • Never sleeps...
    • John Donovan
Re: Blank correction for analysis of vanadium in rutile
« Reply #26 on: September 25, 2021, 08:56:45 AM »
Just to follow up, here's high precision scans for Ti metal, TiO2, TiC and SrTiO3:


all normalized to the Ti Kb peak. And here a bit more zoomed in:

The only stupid question is the one not asked!

JonF

  • Professor
  • ****
  • Posts: 155
Re: Blank correction for analysis of vanadium in rutile
« Reply #27 on: September 30, 2021, 03:57:18 AM »
Before I ramble on, I'll add the caveat that this is probably only applicable in extreme circumstances of measuring trace V in Ti-rich or Cr-rich samples (otherwise, just measure the V Kb er... the Kb1,3!), and is mostly playing around in the noise, but I reckon its interesting theoretically at least.

I think the problem is with this bit:

analyzing TiC [for V Ka] using TiO2 for both the primary standard and for the interference standard

The Ti Ka in TiC should be fine to use TiO2 (other than matrix mismatch), because the Ka results from a core to core transition (2p to 1s), but the Ti interference on the V Ka position is from the Ti Kb2,5 and Ti Kb'' (with a little bit of Ti Kb1,3 tail), both of which arise from relaxation to a fixed (ish) core level from the molecular (note: not atomic) orbitals, the exact energy of which (and therefore the subsequent emission energy) is dependent on the counterion (e.g. C, O in this case) as well as the probability that the electron is even there at any given moment (e.g. the intensity). The Ti Kb'' results from relaxation from the O (or C) 2s and the Ti Kb2,5 from the mixing of the Ti 3d and O 2p levels.

This is highlighted in Brian's high resolution scans between TiO2 and Ti metal with the absence of the Ti Kb'' in the Ti metal (there is no O or C 2s there!) as well as the change in relative intensity of the Ti Kb2,5, and also in John's scans between TiC and TiO2 where the peak profile around the V Ka position is different (but the Ti Kb'' is present, just at a different energy and intensity corresponding to O and C 2s energies relative to Ti 1s).

These scans are telling us that we can't "cross-standardise" for the blank or interference correction, as the interference is species specific e.g. we can't use the Ti metal as an interference for V Ka in TiO2 as one of the major Ti interference peaks (the Kb'') isn't even present in Ti metal! 

Looking at the data, it's apparent than an interference correction is needed (~7200 ppm V measured). Using TiO2 as the interference standard for TiC gives us pretty close to the right answer, but the variance in the data set (between 240 ppm to -160 ppm) is pretty large - I can guess this isn't a trace element setup - and the TiC and TiO2 emission profiles fortuitously cross over close to the V Ka1 to minimise the issue (I did say we were mostly playing in the noise!). I imagine that the wheels would fall off if you try assigning the Ti interference on V Ka to Ti metal.   

I guess there's a rule of thumb that (at least for emission concerning valence shell transitions), the interference and/or blank standard also needs to be the same material as the unknown.