Hi John
Yes thanks for sorting that out John, I was definitely confused as to what was going on until you pointed out I needed to disable the same channel in the primary standard as well…
To give you some background on the relatively high beam conditions for what might seem like relatively high Cl concentrations, that glass shown was just one of many analysed, others having down to single digit Cl concentrations. It has been shown many times now that measuring Ti in quartz can get really nice DL via EPMA with aggregation on large xtals and blank subtraction, so I was just wondering how low we could go with Cl as well.
We have a group interested in low level halogens in minerals (F,Cl,Br,I), and although I can’t help them too much for low level Br and I via EPMA, I could have a go at Cl given I have four large and one regular PET xtal to sum. As with everything the main problem has been finding secondary standards with certified Cl concentrations to test against….which of course don’t really exist. There are a bunch of the common glass standards (NIST, USGS basalt glasses, MPI-DING etc) which have Cl numbers on them, but can vary quite a bit both inter technique (ie SIMS, Noble Gas, LA-ICP-MS, EPMA) and intra technique. There have been some attempts at creating halogen glass standards and I have kindly been given a few of them from researchers, but haven’t had a chance to analyse them yet. Also they are commonly in high concentration as to use as primary standards, so not great for checking your low level accuracy.
So it was a suck it and see. I ran spots at relatively moderate conditions (15kV, 40nA, 20um defocussed, 360 on peak, 180 off peak using alternating On/Off peak mode), and at more extreme conditions (20kV, 80nA, 20um defocussed, 360 on peak, 180 off peak using alternating On/Off peak mode). Individual spot errors halved with the higher conditions, and the TDI correction range was identical between both ranging from <1 to 2%. This is probably due to my highly defocussed beam, I am sure there would be a difference if I used a more focussed beam.
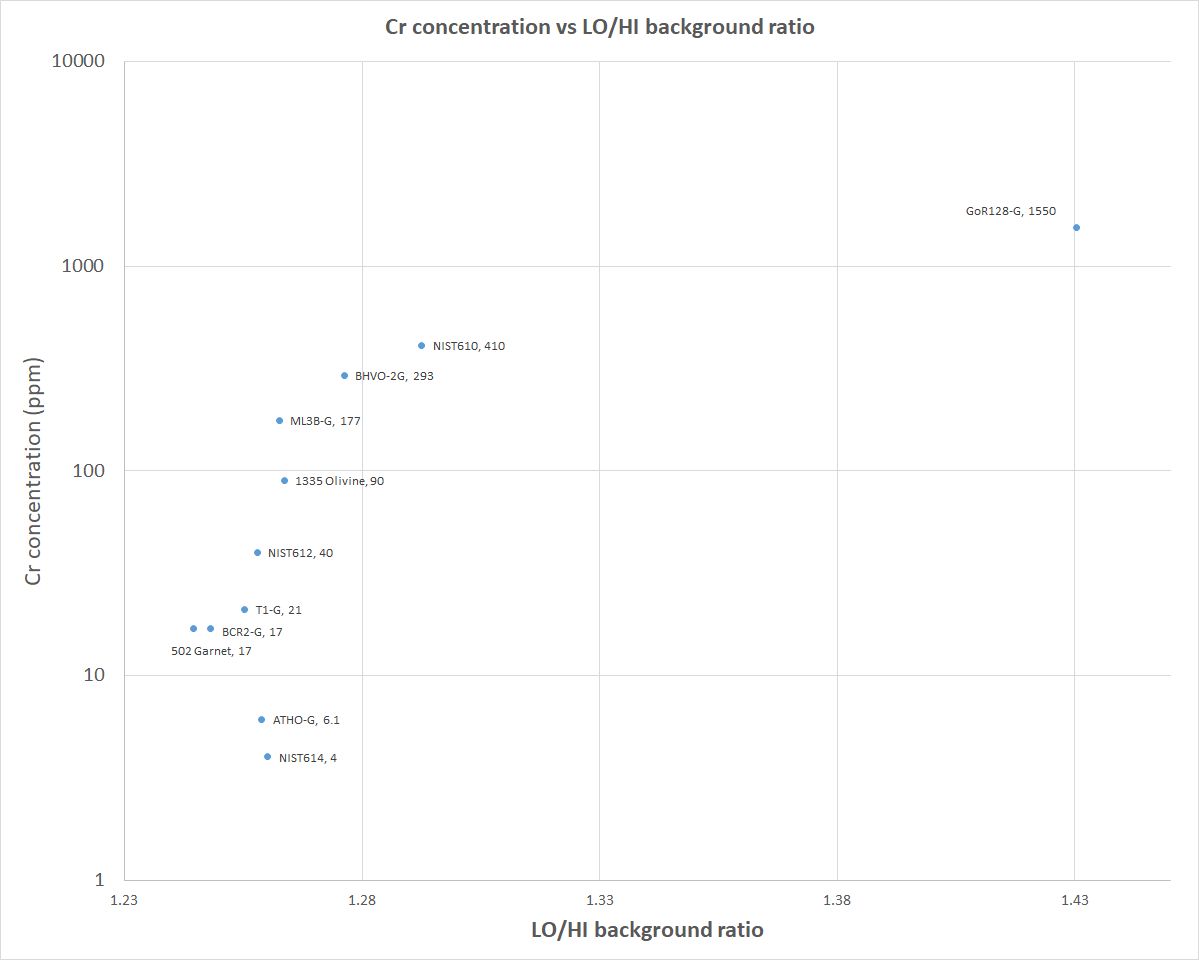
One problem I had is that for some glasses I was underestimating the concentration, others were OK. One of the glasses that has very low level Cl returned negative concentrations. If I plotted Cr concentration against the LO/HI background ratio there was a positive correlation, and it turns out there is a Cr Ka(II) peak right where I had set my low background (see plots below)….whoops. Given a lot of these were basalt glasses as well, some had high Cr. Its not a huge interference and was subtracting anywhere from 5-25 ppm from the peak measurement, so not much but enough to give negative concentrations in one of the glasses and affect some of the other low level ones.
I did do wavelength scans in the initial setup, but obviously:
1) at nowhere near long enough dwell times to pick up the small interference, and;
2) I didn’t do wavelength scans on all the glasses…only on BCR2G which has low Cr so wouldn’t have seen it anyway.

I also played around with blank subtraction, with the obvious problem what do I have that I know has either zero Cl in it, or that I know definitely what the Cl values is. The answer was nothing, so I just tried a couple of candidates, namely Astimex almandine garnet and San Carlos olivine. Below is a compilation table of the 20kV test results
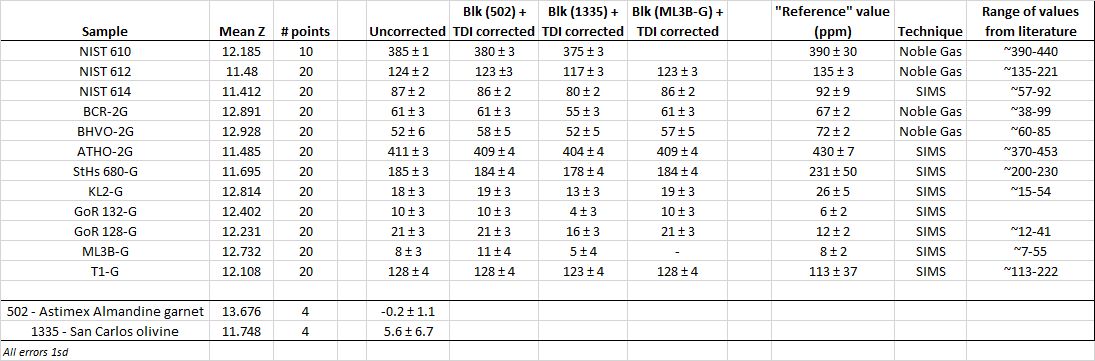
Turns out that San Carlos olivine ?probably? has some very small amount of Cl in it, despite being quite variable. The Astimex garnet was pretty much right on zero, and as a result there isn’t much difference between the uncorrected data and the blank (garnet) corrected data. If I trust the SIMS value for the ML3B-G glass and use that as a blank corrector, I get Cl concentrations identical to when I use the Astimex garnet.
Anyway, I now have some other standards to try, I am also going to go back to 15kV and use higher beam current. Currently all these runs have been done using natural tugtupite as a primary standard. Its internal variance is quite good (0.22% RSD on raw CPS/nA), however who knows how accurate the “certified” value is... As mentioned I do now have a halogen glass which I am going to use as a primary standard and see how it compares. Given the current state of the available standards I think accuracy is always going to be the biggest issue over precision.
Cheers


 If you can't see some "in-line" images in a post, try "refreshing" your browser!