Author Topic: MAN fit - ?Fluorescent? standards?  (Read 6183 times)

BenjaminWade

  • Professor
  • ****
  • Posts: 199
MAN fit - ?Fluorescent? standards?
« on: July 04, 2019, 09:22:43 PM »
Hi all
I am posting on an issue that I have noticed for a long time now, but never done anything about it. I am hoping that its an issue that others have, and are able to explain it to me. Namely why some "standards" just never sit on a MAN fit. To clarify I am not talking about:

1) Standards that have trace amounts of an element thus plot above MAN fit; or
2) Standards in which the element sits on a hole in the background continuum; or
3) Standards that have the wrong z-bar value.

I am talking about standards that consistently plot wayyyy below the MAN fit and constantly have to be removed from the MAN fit. You might ask why would you analyse these standards then. Well they are standards that I calibrate on in typical silicate runs, namely for elements such as Sr, Zr, Ba etc (ie Celestite, Zircon, Barite etc). I have posted below some MAN fits of some select elements that illustrate my problem. Note, although these are excel plots, the data used is the direct export of the MAN fit graph (via Export Dialog on right click of MAN plot in PfE). The reason I have put them in excel is, in PfE there is no way that I can display the troublesome standards on the sample plot without including them in the MAN fit regression.


What you will notice is that the vast majority of the standards (that I have analysed) that display this problem of low returned CPS, all fluoresce under an electron beam, some a lot more than others.  The standards use to construct the MAN fits nominally do not fluoresce under the beam. Without putting up MAN plots of every element, below is another plot of calculated wt% of all analysed elements in the "problem" standards, and you will note for the vast majority they are -ve due to this MAN fit problem, up to an over -1000ppm for some elements


Is anyone able to explain to me why this is happening? My understanding is that the ONPK CPS/nA used to create the MAN fits have already run through the ZAF correction routine, which is why we have the "Correct for Continuum Absorption" tickbox to display with and without.

Other than the obvious of just not using MAN fits for analysing these minerals, has anyone for example analysed for low level elements in zircon using MAN and noticed any problems? Would a separate MAN fit using only fluorescent minerals need to be constructed? It is of course not a huge problem for normal MAN work, as I just exclude these from the MAN fit, but if I ever wanted to use the MAN method to analyse low levels of some of these elements in zircon, going by these plots it would be a problem.

Hoping that it is something obvious I am missing.

Cheers
« Last Edit: April 13, 2020, 09:32:27 PM by BenjaminWade »

JakubHaifler

  • Post Doc
  • ***
  • Posts: 12
Re: MAN fit - ?Fluorescent? standards?
« Reply #1 on: July 05, 2019, 01:56:25 AM »
Hi Benjamin.

Few weeks ago, I had a similar observation of one standard being significantly below the MAN curve. It is posted in the topic on the MAN background. The standard was synthetic CaTh(PO4)2 which was prepared by my colleague. And I also observed very significant photoluminescence under the electron beam.


Best regards, Jakub Haifler
« Last Edit: July 05, 2019, 07:10:49 AM by JakubHaifler »
Department of Geological Sciences
Masaryk University
Brno, Czech Republic

John Donovan

  • Administrator
  • Emeritus
  • *****
  • Posts: 3304
  • Other duties as assigned...
    • Probe Software
Re: MAN fit - ?Fluorescent? standards?
« Reply #2 on: July 05, 2019, 10:27:00 AM »
Jakub and Ben,
Nice work. You have caused me to re-examine the correction for continuum matrix effects and we should work on this together. But first a little history.

When we first came up with the MAN background correction it was just a simple linear fit vs. Z-bar to deal with the fact that we had some fixed monochrometers permanently tuned to specific emission lines which could not be detuned off-peak to measure the background (necessity is a mother!). This was back in the mid 1980s. About 8 years later I was at an M&M conference and was explaining to John Armstrong how we were doing this mean atomic number (MAN) background method, and he said to me: "Are you doing a correction for continuum absorption to the standard intensities?", and I said "uh, no". But it made perfect sense that one should do that since the continuum *generated* in each standard will depend only on the average Z (Kramer's Law), but the continuum actually *emitted* by each standard will depend on the composition (Beer's Law). So as soon as I got home I added a continuum absorption into the code.

Because continuum x-rays are emitted somewhat differently than characteristic x-rays, the first thing I tried was a simple continuum absorption correction from Heinrich modified by Mycklebust, but that actually made the MAN fit worse! It was a very primitive calculation. So then I tried using just the absorption correction term from the normal matrix correction calculations, since the energy of these continuum emissions are essentially the same energy as the characteristic emission! Hey, you do what you have to!   :D

That actually worked pretty well and in almost every case produced a better fit to the MAN intensities, so we decided to just utilize that. That was 25 years ago!   :o

Fast forward to 2016, when Jared Singer and I wrote this up and we included John Armstrong as a co-author to thank him for his suggestion to add a correction to the continuum intensities for the MAN fit:

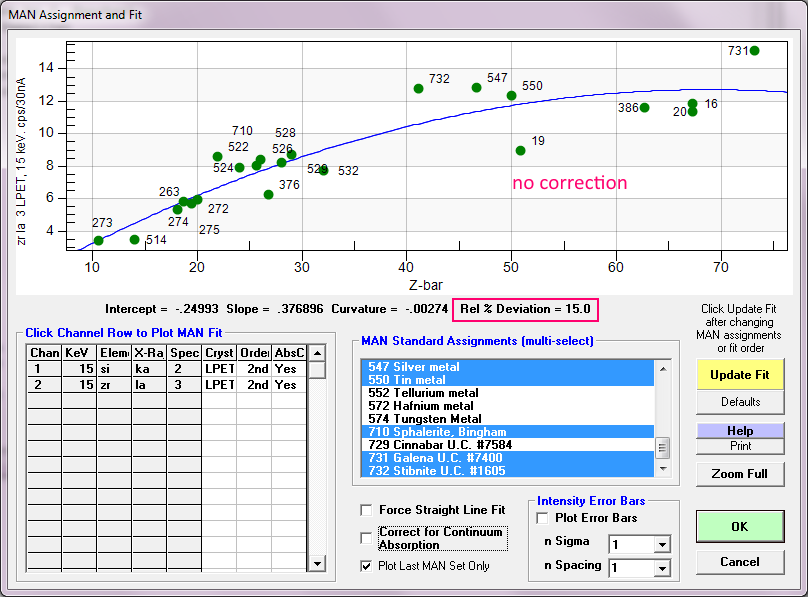
https://epmalab.uoregon.edu/publ/A%20new%20EPMA%20method%20for%20fast%20trace%20element%20analysis%20in%20simple%20matrices.pdf

So here are data from a test run I did recently to look at backscatter coefficients on some standard materials, but I had included a few analyzed elements just for fun. So looking at one of these emission lines, here are the Zr La MAN intensities measured on a number of standards, *without* any correction to the continuum x-rays:


Next, here are the same intensities but corrected for absorption (only) using the absorption correction term from the matrix correction physics for each standard:


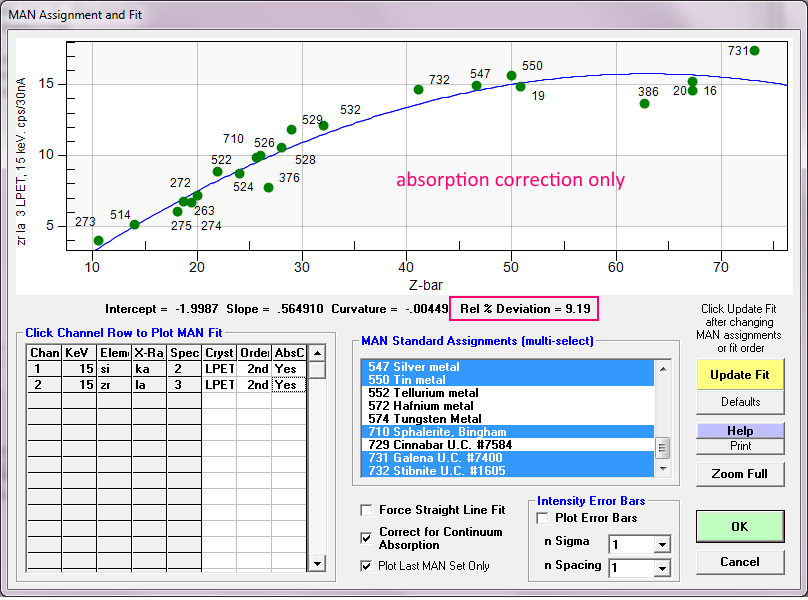
That is a significant improvement over doing no correction at all to the MAN standard intensities! And that's where things stood until now.  But now you guys are pointing out (correctly I should add!) that we really should also be looking at continuum fluorescence, because the continuum can fluoresce other characteristic x-rays in the MAN standards (and of course the unknowns as well!), that might (if we are unlucky), be the same energy as our analytical emission line and be detected by the spectrometer. And correct me if I am wrong, but it seems to me that we don't need to worry about backscatter loss or stopping power calculations since this is just x-ray physics.

Now I don't have any code laying around to do a proper treatment for continuum absorption and fluorescence, but thinking back to my early efforts, I decided to try the fluorescence correction term for each standard (yes, I know it shouldn't work), along with the absorption correction term, from the normal matrix correction calculations, and here is what we get:


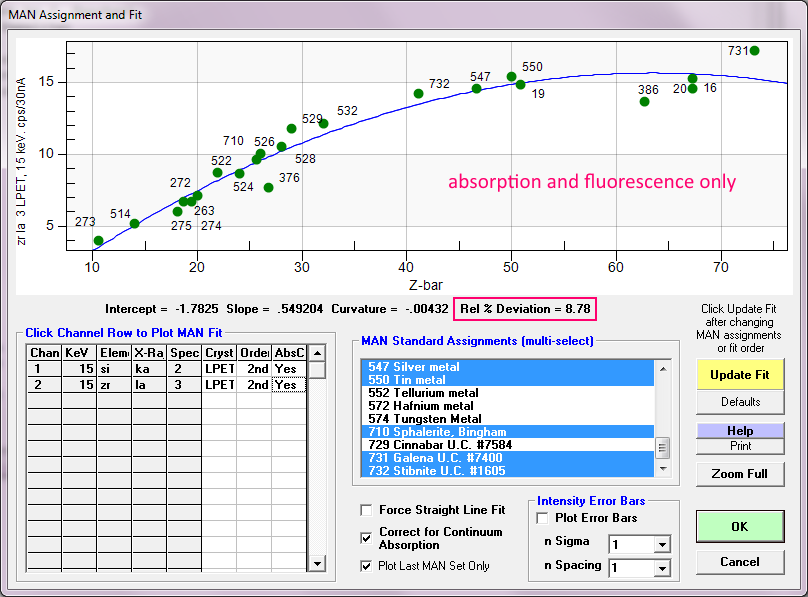
Well, I'll be darned.  That's even a better fit!

OK, let's get really crazy and just for fun, let's throw in the atomic number correction term as well, and now we get this:


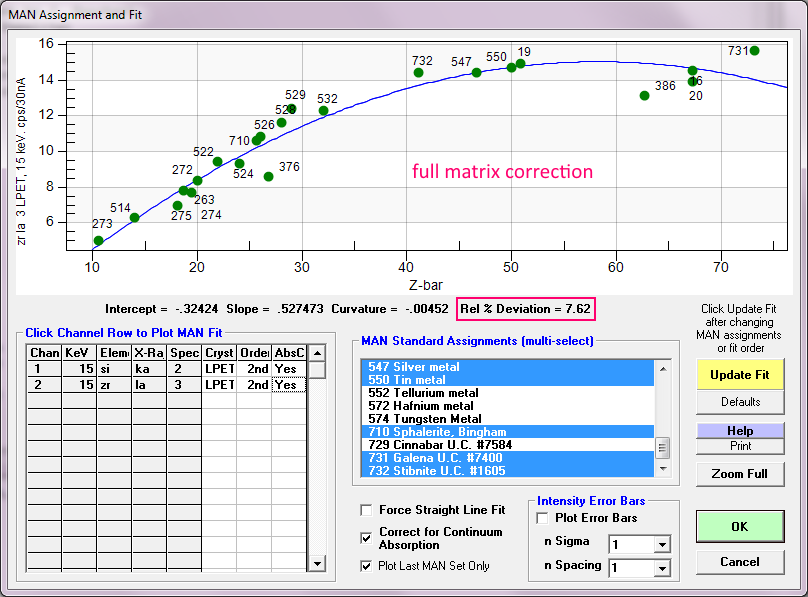
Dang, that's even better! I realize that this makes no sense at all from a physics perspective, but please try it out yourselves and please let me know what you find.  And if someone can come up with a proper continuum absorption/fluorescence correction, I would be thrilled to try it out!

But I think it's important to keep in mind that all these corrections to the MAN background are quite small, and also they are essentially normalized out when we perform the actual MAN correction. Because although we correct each MAN standard intensity for the matrix effects on the emitted continuum by multiplying the MAN standard intensities times the matrix correction (prior to the MAN fit regression), we then divide the unknown MAN intensity (derived from the MAN standard fit), by the unknown matrix correction!

For those reading all this that haven't thought about this stuff as much as Jakub and Ben have, the steps are:

1. Correct each MAN (continuum) standard intensity for the matrix correction physics for that standard (or whatever physics you want to use).
2. Calculate the fit coefficients for these corrected continuum intensities as a function of the average atomic number of each standard.
3. During the (unknown) sample matrix iteration, calculate the average Z of the unknown sample.
4. Determine the background intensity from the MAN standard fit coefficients based on the current unknown sample average atomic number.
5. De-correct the calculated unknown sample MAN intensity by the matrix correction (or whatever physics you want) for the current unknown composition.
6. Subtract the de-corrected unknown sample MAN intensity from the measured on-peak sample intensity
7. Repeat steps 3 to 6 until the MAN calculation converges...

It's so simple!    >:(

I think the first step is to look at the x-ray physics and see if we can try and understand what is it about these compositions that cause them to fall below the general trend of the MAN fit.  It could be fluorescence, but it could also be related to how we calculate average atomic number!  For example, we already know that we *cannot* utilize mass fractions for calculating average Z for backscatter coefficients, as shown here:

https://probesoftware.com/smf/index.php?topic=1111.msg8249#msg8249

Remember to log in to see the pdf attachment. I'll be presenting on this at M&M next month. I've played around with using a Z fraction weighting for calculating average atomic number for MAN plots and haven't found anything that works as well as plain old mass fraction weighting, but maybe it's a combination of absorption/fluorescence and average Z weighting for the continuum issues we are seeing...

Try looking at the A/Z ratios for the elements in these compounds, and take a look at the "alternative" Zbar calculations in the Output |  Calculate Alternative Zbars menu in the Standard application.

And finally if we want to utilize the MAN background correction for high Z materials, please remember that accuracy can be problematic. Which is why for best accuracy one should always combine the MAN correction with the blank correction using a suitable blank standard. For zircon a synthetic zircon works excellently.
« Last Edit: July 05, 2019, 02:48:21 PM by John Donovan »
John J. Donovan, Pres. 
(541) 343-3400

"Not Absolutely Certain, Yet Reliable"

John Donovan

  • Administrator
  • Emeritus
  • *****
  • Posts: 3304
  • Other duties as assigned...
    • Probe Software
Re: MAN fit - ?Fluorescent? standards?
« Reply #3 on: July 05, 2019, 12:28:28 PM »
By the way, the code from Heinrich/Myklebust to calculate continuum absorption is in the CalcZAF open source on Github, which is currently not utilized for the MAN fit, but I paste it here:

Code: [Select]
Sub ZAFGetContinuumAbsorption(continuum_absorption() As Single, zaf As TypeZAF)
' Calculate continuum absorption correction (modified Heinrich from Myklebust) for all emitters

ierror = False
On Error GoTo ZAFGetContinuumAbsorptionError

Dim i As Integer

ReDim m7(1 To MAXCHAN1%) As Single
ReDim h(1 To MAXCHAN1%) As Single
ReDim gsmp(1 To MAXCHAN1%) As Single
ReDim gstd(1 To MAXCHAN1%) As Single

' Calculate standard (pure element) absorption
For i% = 1 To zaf.in1%
If zaf.il%(i%) <= MAXRAY% - 1 Then
h!(i%) = 0.0000012 * (zaf.eO!(i%) ^ 1.65 - zaf.eC!(i%) ^ 1.65)
gstd!(i%) = (1# + h!(i%) * zaf.mup!(i%, i%) * zaf.m1!(i%)) ^ 2

' Modify intensity using depth production and anisotropy from Small and Myklebust
gstd!(i%) = gstd!(i%) * 1.15 - 0.15 * 1# / gstd!(i%)
End If
Next i%

' Calculate sample absorption
For i% = 1 To zaf.in1%
If zaf.il%(i%) <= MAXRAY% - 1 Then
m7!(i%) = ZAFMACCal(i%, zaf)
gsmp!(i%) = (1# + h!(i%) * m7!(i%) * zaf.m1!(i%)) ^ 2

' Modify intensity using depth production and anisotropy from Small and Myklebust
gsmp!(i%) = gsmp!(i%) * 1.15 - 0.15 * 1# / gsmp!(i%)
End If
Next i%

' Create continuum absorption correction factors
For i% = 1 To zaf.in1%
If zaf.il%(i%) <= MAXRAY% - 1 Then
continuum_absorption!(i%) = gsmp!(i%) / gstd!(i%)
End If
Next i%

Exit Sub

' Errors
ZAFGetContinuumAbsorptionError:
MsgBox Error$, vbOKOnly + vbCritical, "ZAFGetContinuumAbsorption"
ierror = True
Exit Sub

End Sub

Note as has been pointed out, we should probably perform a rigorous treatment for both continuum absorption and fluorescence!
« Last Edit: July 06, 2019, 09:27:24 PM by John Donovan »
John J. Donovan, Pres. 
(541) 343-3400

"Not Absolutely Certain, Yet Reliable"

Probeman

  • Emeritus
  • *****
  • Posts: 2856
  • Never sleeps...
    • John Donovan
Re: MAN fit - ?Fluorescent? standards?
« Reply #4 on: July 06, 2019, 06:48:56 PM »
Hi Ben,
Well I've been looking into the code and testing some data and found out why the Heinrich and Myklebust continuum absorption correction wasn't working as well as it should have. Now the Heinrich continuum absorption and the Armstrong phi-rho-Z absorption corrections both give similar results for the MAN curves, with the Heinrich method slightly better.

The data is a probe run I recently did looking at some standards with large differences in their A/Z elements, originally to look at the backscatter coefficients, but I also acquired Si Ka and Zr La just for fun.  So here are the correction factors for the Armstrong absorption correction for these two elements:

MAN fit data for Si ka, SP2 LPET, 15 keV
  MANStd  MANAss  MANSet    Npts   Z-bar     Cps AbsCorr
     522       1       1       1 21.9300 9.52304 1.34430
     524       2       1       2 23.9842 8.90178 1.48430
     526       3       1       3 26.0000 8.46901 1.64735
     528       4       1       4 28.0000 7.66998 1.83075
     529       5       1       5 28.9580 9.10173 1.95332
     532       6       1       6 32.0000 7.31487 2.35743
     540       7       1       7 39.8400 16.8615 1.27072
     542       8       1       8 41.7280 13.3753 1.34197
     547       9       1       9 46.6880 12.6544 1.56866
     550      10       1      10 50.0000 14.1195 1.74366
     552      11       1      11 52.0000 11.7216 1.85512
     574      12       1      12 73.8284 26.8303 1.36576
     710      13       1      13 25.5960 9.40190 1.69769
     729      14       1      14 71.1680 23.5443 1.46016
     731      15       1      15 73.1560 18.1162 1.51554
     732      16       1      16 41.0880 13.9311 1.53672

MAN fit data for Zr la, SP3 LPET, 15 keV
  MANStd  MANAss  MANSet    Npts   Z-bar     Cps AbsCorr
     514       1       1       1 14.0000 3.45187 1.49583
      16       2       1       2 67.2231 11.8851 1.28334
      19       3       1       3 50.8415 8.95550 1.65873
      20       4       1       4 67.2231 11.3864 1.28334
     263       5       1       5 18.6926 5.84859 1.15176
     272       6       1       6 20.0138 5.93751 1.20616
     273       7       1       7 10.5798 3.41837 1.17087
     274       8       1       8 19.4692 5.67127 1.17913
     275       9       1       9 18.0833 5.36072 1.12748
     376      10       1      10 26.7484 6.25967 1.23218
     386      11       1      11 62.7264 11.6543 1.17626
     522      12       1      12 21.9300 8.60179 1.02954
     524      13       1      13 23.9842 7.90280 1.10178
     526      14       1      14 26.0000 8.42461 1.19110
     528      15       1      15 28.0000 8.20279 1.28806
     529      16       1      16 28.9580 8.72435 1.35356
     532      17       1      17 32.0000 7.71448 1.57259
     547      18       1      18 46.6880 12.8653 1.16002
     550      19       1      19 50.0000 12.3656 1.26612
     710      20       1      20 25.5960 8.06984 1.22105
     731      21       1      21 73.1560 15.1411 1.15042
     732      22       1      22 41.0880 12.7766 1.14610

And here are the Heinrich absorption correction factors:

MAN fit data for Si ka, SP2 LPET, 15 keV
  MANStd  MANAss  MANSet    Npts   Z-bar     Cps AbsCorr
     522       1       1       1 21.9300 9.52304 1.41239
     524       2       1       2 23.9842 8.90178 1.58663
     526       3       1       3 26.0000 8.46901 1.79544
     528       4       1       4 28.0000 7.66998 2.05681
     529       5       1       5 28.9580 9.10173 2.14897
     532       6       1       6 32.0000 7.31487 2.58038
     540       7       1       7 39.8400 16.8615 1.30489
     542       8       1       8 41.7280 13.3753 1.38678
     547       9       1       9 46.6880 12.6544 1.64365
     550      10       1      10 50.0000 14.1195 1.80516
     552      11       1      11 52.0000 11.7216 1.88858
     574      12       1      12 73.8284 26.8303 1.35475
     710      13       1      13 25.5960 9.40190 1.87763
     729      14       1      14 71.1680 23.5443 1.48133
     731      15       1      15 73.1560 18.1162 1.53529
     732      16       1      16 41.0880 13.9311 1.62064

MAN fit data for Zr la, SP3 LPET, 15 keV
  MANStd  MANAss  MANSet    Npts   Z-bar     Cps AbsCorr
     514       1       1       1 14.0000 3.45187 1.66857
      16       2       1       2 67.2231 11.8851 1.30786
      19       3       1       3 50.8415 8.95550 1.75943
      20       4       1       4 67.2231 11.3864 1.30786
     263       5       1       5 18.6926 5.84859 1.21173
     272       6       1       6 20.0138 5.93751 1.28797
     273       7       1       7 10.5798 3.41837 1.24194
     274       8       1       8 19.4692 5.67127 1.24153
     275       9       1       9 18.0833 5.36072 1.17560
     376      10       1      10 26.7484 6.25967 1.29463
     386      11       1      11 62.7264 11.6543 1.19327
     522      12       1      12 21.9300 8.60179 1.04781
     524      13       1      13 23.9842 7.90280 1.13826
     526      14       1      14 26.0000 8.42461 1.25239
     528      15       1      15 28.0000 8.20279 1.38910
     529      16       1      16 28.9580 8.72435 1.43865
     532      17       1      17 32.0000 7.71448 1.66847
     547      18       1      18 46.6880 12.8653 1.18220
     550      19       1      19 50.0000 12.3656 1.28135
     710      20       1      20 25.5960 8.06984 1.30032
     731      21       1      21 73.1560 15.1411 1.14379
     732      22       1      22 41.0880 12.7766 1.17511

You'll notice that they track quite well, with the Heinrich absorption factors being somewhat larger.

Now when we apply the Armstrong absorption factors to this data set, we get a average fit deviation of 11.1 for Si Ka, and 9.19 for Zr La. When the Heinrich factors are applied we get 11.0 for Si Ka and 9.0 for Zr La. Not a big change, but an improvement.  Obviously we will need to test on many other data sets to know better, but we are working on a new version of Probe for EPMA with additional options in the GUI for toggling these calculations on and off.  More on that tomorrow.

But I do have a physics question. You mentioned the possibility that there might be some sort of a fluorescence correction needed for the MAN curve fit, at least for certain MAN standard compositions, but I'm not sure how that physics would work.  I can understand that we can get additional characteristic fluorescence from continuum production. For example at 15 keV about 1% of the Fe Ka produced in pure Fe metal is from continuum radiation:

https://probesoftware.com/smf/index.php?topic=58.msg5621#msg5621

But how can we get additional continuum radiation production? That is, when the element isn't present so there are no atoms to be fluoresced?  Continuum radiation should solely be a product of electron deceleration, no?  Are you thinking of a sample absorption edge effect where some of the continuum radiation produced is being absorbed on the way out?  But that should be taken care of by the continuum absorption correction I would think. 

I've added a MAN fluorescence correction plot option as seen here:


But right now it just returns a 1.0 correction factor when using the alternative continuum correction method (it utilizes the characteristic fluorescence correction factors when using the default continuum correction method which is wrong of course but interestingly it does seem to improve the fit- more on this later today). But if you (or anyone else) can think of what fluorescence physics might be involved, we will be happy to code it in so we can test it.
« Last Edit: July 07, 2019, 11:51:52 AM by Probeman »
The only stupid question is the one not asked!

John Donovan

  • Administrator
  • Emeritus
  • *****
  • Posts: 3304
  • Other duties as assigned...
    • Probe Software
Re: MAN fit - ?Fluorescent? standards?
« Reply #5 on: July 07, 2019, 02:32:34 PM »
Hi Ben (and Jakub),
I went a little crazy this weekend and we added several new options for testing different MAN fit parameters including switching between the matrix and continuum specific absorption correction methods and also using a Z fraction based average atomic number calculation as shown here:


This latest version of Probe for EPMA (12.6.6) will also save these parameters to the MDB file and display them when selected. Don't worry though, the default mode is to still utilize the MAN continuum absorption correction method we've been using all these years (using the characteristic absorption correction for the MAN intensities).

Here is an example of the new output using the Z (electron) fraction average atomic number method for Zr La:


This is an improvement over the weight fraction method which gives a average deviation of 9.19.  Note benitoite (376) now plots on the fitted line.

These options will give you a chance to try different data sets and report what you are seeing in your MAN curves.  Jakub if you'd be interested in trying this Z fraction method for calculating average atomic number see the abstract attached below, which I submitted to M&M 2019 for a presentation in August in Portland. Yes, it's specific to elastic (BSE) scattering, but similar physics should apply to both productions since neither elastic scattering nor continuum are significantly affected by mass (atomic weight).

Edit by John: I've decided to move these global MAN options from the Analysis Options dialog to the MAN dialog, to make it easier to compare the different results graphically. Give me a day to two and I will try to get to it.
« Last Edit: July 08, 2019, 08:27:19 AM by John Donovan »
John J. Donovan, Pres. 
(541) 343-3400

"Not Absolutely Certain, Yet Reliable"

John Donovan

  • Administrator
  • Emeritus
  • *****
  • Posts: 3304
  • Other duties as assigned...
    • Probe Software
Re: MAN fit - ?Fluorescent? standards?
« Reply #6 on: July 08, 2019, 07:57:22 PM »
Hi Ben,
OK, we just uploaded a new version of Probe for EPMA (12.6.7) which now has all the MAN fit options in the MAN dialog as seen here:


This should allow one to evaluate these options on various datasets more easily.  If you click the Cancel button the options selected are not saved for quant calculations and instead only displayed. But if you click the OK button, the MAN fit options are saved for quant calculations on samples.

Please let me know what you think.  We can work together on further code changes as necessary.
john
John J. Donovan, Pres. 
(541) 343-3400

"Not Absolutely Certain, Yet Reliable"

BenjaminWade

  • Professor
  • ****
  • Posts: 199
Re: MAN fit - ?Fluorescent? standards?
« Reply #7 on: July 08, 2019, 07:58:21 PM »
Hi John, Jakub, and all
Thankyou for the detailed reply, it has taken me some time to digest and have more of a play with my data using the new features. I think I can conclude at least one thing. That being, as you have surmised I think the effect I have been seeing is almost solely down to how the z-bar is calculated. Attached below are the MAN plots (including the problem elements) of the same elements from the original post (Cr Ka, Na Ka, and Ti Ka) both with the "traditional" default z-bar, and with an z-fraction exponent=0.7 z-bar fit.


As you can see the "problem" photoluminescent standards pull back right onto the MAN fit on both the Cr and Ti plots. Na is a bit messier as expected but arguably the plot is better using the z-fraction method. I have looked at most elements in my run now, and I can say that if I want to include the problem minerals (zircon, barite, etc) in the MAN fit, using the modified z-fraction method gives a vastly superior fit for all elements on PET and LIF, and probably TAP but the data is much noisier.

As such I may have been chasing a red herring regarding fluorescence. As you mention it is hard to conceptualise physically how this could have an effect on the generation of the background continuum at the peak position, I was more thinking that there was a first principle correlation in that the majority of problem standards luminesced under the beam more than the other standards. However I think this is probably just an unhappy coincidence, due to the fact that the problem standards are also compounds comprised of a heavy element with a light element, thus the z-bar recalculation will affect these standards the most (ie Zr/Si, Zr/O, Ca/W, Ca/Mo, Sr/C, Ba/S etc).

So this brings me to my next question, should we be using the exponent method by default? And if so what exponent should I be using? I note in your original post in the other thread you use 0.8, PfE uses 0.7 by default, and then in your post below you use 0.6. I am guessing that was playing around with the value to fit the empirical data the best. It sounds like potentially you are working on a software update to put those parameters into the MAN window to play around with it more easier, will be fun to use.

I guess we are talking about quite small differences in background interpolation, and when measuring minor to major elements its not really a problem anyway. But interesting! Let me know what you think.

Cheers
« Last Edit: April 13, 2020, 09:37:36 PM by BenjaminWade »

BenjaminWade

  • Professor
  • ****
  • Posts: 199
Re: MAN fit - ?Fluorescent? standards?
« Reply #8 on: July 08, 2019, 08:28:09 PM »
Hi Jakub
Interestingly I also note in your plot below, that if we recalculate that synthetic cheralite using exponent of 0.7 its z-bar comes down to ~34.6, bringing it much more in line with the MAN fit. Of course the rest of the MAN fit would change as well, so it may well bring it right back onto the line.

cheers


John Donovan

  • Administrator
  • Emeritus
  • *****
  • Posts: 3304
  • Other duties as assigned...
    • Probe Software
Re: MAN fit - ?Fluorescent? standards?
« Reply #9 on: July 09, 2019, 11:23:34 AM »
Hi John, Jakub, and all
Thankyou for the detailed reply, it has taken me some time to digest and have more of a play with my data using the new features. I think I can conclude at least one thing. That being, as you have surmised I think the effect I have been seeing is almost solely down to how the z-bar is calculated. Attached below are the MAN plots (including the problem elements) of the same elements from the original post (Cr Ka, Na Ka, and Ti Ka) both with the "traditional" default z-bar, and with an z-fraction exponent=0.7 z-bar fit.


[snip]

Hi Ben,
Wow, this is an impressive improvement.  Note particularly how standards 618, 617 and 739 change positions between the two average Z methods with the Z fraction method giving excellent results. If you download the latest PFE (v. 12.6.7) I've moved these options all into the MAN plot dialog.

Since this Z fraction averaging seems to deal pretty well with the fitting for these high Z materials, and we can't think of what fluorescence has to do with continuum emission I'm going to remove the fluorescence option from the MAN code later this week, unless anyone has any objections.

It's interesting that both you and Jakub seemed struck by the fact that many/most of the "problem" standards were cathodoluminescent, but I think that was just a coincidence, as I can't think of how band gap emission is related to continuum fluorescence, but what do I know? The only thing I noticed was that applying the characteristic fluorescence correction to the MAN intensities did seem to make a small improvement to the fit, but that was probably just a spurious correlation.

As to the exact exponent to utilize for the Z fraction weighting, yes, I was experimenting with different values, but something between 0.6 and 0.8 seems to give the best results.  I think you are correct in that this should be the new default, but I hesitate to change the default behavior of the software to avoid causing concern when people start seeing slightly different numbers.  But the software probably should output a warning if one is using the mass fraction averaging method for MAN fitting.

Thanks for pushing me to implement this idea as I've published on it, but never got around to coding it in PFE.
john
« Last Edit: September 19, 2021, 08:08:44 AM by John Donovan »
John J. Donovan, Pres. 
(541) 343-3400

"Not Absolutely Certain, Yet Reliable"

BenjaminWade

  • Professor
  • ****
  • Posts: 199
Re: MAN fit - ?Fluorescent? standards?
« Reply #10 on: July 09, 2019, 10:21:42 PM »
Hi John
Yes, many thanks once again for your quick implementation of the Z-fraction into the MAN fit window. I have gone through a bunch of my datasets now, and the improvement to the fit is remarkable for many of the elements, to the point that you could forgive someone if they accused you of fudging the MAN fit to make the standards sit on the same line. Elements on TAP still have their issues but that is due to other factors, even so it does improve these fits as well.

Importantly this has also cleared up a lot of problems I had been having with some sulfide standards always plotting below the MAN fit, which makes sense as they were standards like Grenockite (CdS), Cinnabar (HgS) etc, which you can imagine would benefit from this Z-fraction calculation.

Anyway, good stuff! I will do more testing but I can see myself using the z-fraction as default

Cheers

Probeman

  • Emeritus
  • *****
  • Posts: 2856
  • Never sleeps...
    • John Donovan
Re: MAN fit - Z fraction based Z-bar!
« Reply #11 on: July 10, 2019, 12:40:38 PM »
Hi Ben,
Again, thanks for pointing this out and I'll be further improving the plot/log output later this week for these parameters.   I also just got off the phone with Zack Gainsforth (card carrying physicist) and he concurs that photo-luminescence and continuum production is likely to be a 10-7 magnitude effect, so I will remove that option from the software.

It still amazes me to see the amount of improvement the Z^0.7 fraction Zbar has on these MAN fits. Looking a bit more at your data file (thanks!), I note that all the elements seem to benefit from the Z based fit, with the exception of Si Ka and Al Ka (where the fit gets slightly worse), but it should be noted that the other TAP elements all show improvement using the Z fraction Zbar.

It almost seems too good to be true. Here is another great example of a plot of K Ka with mass fraction averaging:


and the same using Z fraction averaging:


Like "beads on a string".   8)
The only stupid question is the one not asked!

John Donovan

  • Administrator
  • Emeritus
  • *****
  • Posts: 3304
  • Other duties as assigned...
    • Probe Software
Re: MAN fit - Z fraction based Z bar update
« Reply #12 on: July 11, 2019, 12:04:11 PM »
OK, the MAN dialog has been redesigned to better display the elements and MAN standard assignments.

Here is how it looks now with v. 12.6.8 showing Ben Wade's MAN data for Sr La on a PET crystal:


Without the Z fraction Zbar calculation the relative % deviation was 7.49 (compared to 2.01 in the above screenshot).

Ready to download now.

John J. Donovan, Pres. 
(541) 343-3400

"Not Absolutely Certain, Yet Reliable"

BenjaminWade

  • Professor
  • ****
  • Posts: 199
Re: MAN fit - ?Fluorescent? standards?
« Reply #13 on: July 11, 2019, 02:56:44 PM »
Looks great John. I like the extended box displaying the standards, will save my mouse scrolling finger getting RSI now.

Cheers

John Donovan

  • Administrator
  • Emeritus
  • *****
  • Posts: 3304
  • Other duties as assigned...
    • Probe Software
Re: MAN fit - ?Fluorescent? standards?
« Reply #14 on: July 12, 2019, 10:54:02 AM »
Looks great John. I like the extended box displaying the standards, will save my mouse scrolling finger getting RSI now.

Cheers

RSI? Repetitive Scrolling Irritation?   :)
John J. Donovan, Pres. 
(541) 343-3400

"Not Absolutely Certain, Yet Reliable"