Hello All,
This is beginner question: I am analyzing a 16 component glass, and have a run that consists of 25 standards and 6 unknowns. I analyzed extra standards so I could use them for interference corrections and to also help collect sufficient data for MAN background corrections. I collected standards before and after each unknown. I collected all of the data last week, and now I am going through the analysis process. The data from the standards looks reasonably close to the "published values", but there are some obvious outliers - elements reported that don't exist, or concentrations that are off from the reported values (e.g. B and O).
Question 1: As part of the analysis process, is one supposed to go through all of the measurements on all of the standards and perform interference corrections to address discrepancies between the measured and the reported values for the standards?
Hi Brad,
These are excellent questions, that should be discussed more often. It really comes down to "how confident can we be about accuracy in EPMA"? I'm going to start at the beginning, so bear with me while I discuss basic things I know you already understand quite well.
The fact that we can analyze each standard (as though it were an unknown), which we have acquired data for, is I think, one of the more powerful features in Probe for EPMA. The idea being that if our standards don't agree with each other, why even bother looking at actual unknown samples?
So, yes, one should definitely examine each standard that we've acquired in our probe runs, to be sure that not only does the analyzed value agree with the published value (assuming that we have a secondary standard to check against!). But also, if the standard database reports a zero concentration for that element, can we actually measure a zero concentration for that element? Remembering that the primary standard is the standard assigned to that element, and a secondary standard is any standard that contains a non-zero concentration of the element, that is not assigned as the primary standard for that element. These standard assignments are on an element by element basis so a standard can be the primary standard for some elements, and also a secondary standard for other elements.
So there are really two questions here: one, using a secondary standard that is (ideally) similar to our unknown matrix, how close are we to the published value? This is the accuracy check for EPMA. Here is an example of a secondary standard sample, being analyzed from the Analyze! window:
ELEM: Na Si K Al Mg Ca Ti Mn Fe P Cr SUM
365 .037 21.171 .007 4.807 11.702 10.871 -.009 .050 7.870 .015 .012 100.130
366 .044 21.212 .012 4.798 11.702 10.861 .014 .062 7.635 .008 .009 99.955
367 .042 21.316 .016 4.822 11.638 11.074 .011 .069 7.697 .018 .004 100.304
AVER: .041 21.233 .012 4.809 11.681 10.935 .005 .060 7.734 .014 .009 100.130
SDEV: .004 .075 .004 .012 .037 .120 .013 .010 .122 .005 .004 .175
SERR: .002 .043 .003 .007 .021 .069 .007 .006 .070 .003 .002
%RSD: 8.65 .35 37.11 .25 .31 1.10 246.35 16.28 1.57 37.98 45.57
PUBL: .043 21.199 n.a. 4.906 11.657 10.899 n.a. .077 7.742 n.a. n.a. 100.120
%VAR: -4.54 .16 --- -1.98 .20 .33 --- -21.72 -.10 --- ---
DIFF: -.002 .034 --- -.097 .024 .036 --- -.017 -.008 --- ---
STDS: 336 162 374 336 162 162 22 25 162 285 396
In this case we are using the NIST K-411 SRM (std #162) as a primary standard, to analyze the NIST K-412 SRM (std #160) as a secondary standard. The lines highlighted in red are the most important for our evaluation of accuracy.
Specifically the AVER: line is what the secondary standard analyzes as in elemental weight percent. Note also in the line labeled STDS: that K-411 (#162) is the assigned (primary) standard for Si, Mg, Ca, Fe. So next we look at the PUBL: line which is what our standard database is telling what we *should* be getting. To evaluate our accuracy, PFE conveniently displays the %VAR: line, which is the relative error between the AVER: line and the PUBL: line. The DIFF: line being the absolute difference between the two. Typically in EPMA we'd like to see accuracy in the 1 to 3% range, ideally below 2% relative accuracy.
What about our primary standard for Si, Mg, Ca and Fe:
ELEM: Na Si K Al Mg Ca Ti Mn Fe P Cr SUM
368 .014 25.269 .008 .016 8.873 10.995 .017 .117 11.210 .017 -.007 100.087
369 .003 25.547 .008 .011 8.875 11.167 -.006 .109 11.324 -.001 -.019 100.575
370 .008 25.357 .007 .020 8.833 11.077 -.029 .081 11.124 .007 .001 100.045
371 .007 25.329 .001 .019 8.804 11.014 .006 .122 11.176 .007 -.001 100.043
AVER: .008 25.376 .006 .016 8.846 11.063 -.003 .107 11.209 .007 -.007 100.187
SDEV: .005 .120 .003 .004 .034 .077 .020 .018 .084 .007 .009 .259
SERR: .002 .060 .002 .002 .017 .039 .010 .009 .042 .004 .005
%RSD: 57.93 .47 56.19 25.65 .38 .70 -643.83 16.86 .75 96.67 -138.78
PUBL: n.a. 25.382 n.a. .053 8.847 11.057 n.a. .077 11.209 n.a. n.a. 100.183
%VAR: --- (-.02) --- -69.51 (-.01) (.06) --- 39.36 (.00) --- ---
DIFF: --- (-.01) --- -.037 (.00) (.01) --- .030 (.00) --- ---
STDS: 336 162 374 336 162 162 22 25 162 285 396
Note that %VAR: and DIFF: values for those elements are in parentheses. This is to remind the user that these elements are assigned as the primary standard to this standard, so of course they look good! But note that the other elements (Na, K, Ti, P and Cr) in both standards are also a check for accuracy, however with the exception of Al, the other elements are essentially trace elements. So what accuracy is this checking? This is checking the accuracy of our background measurement!
That is, if the PUBL: value for an element is listed as zero (often n.a. for not analyzed), we should observe a value that is statistically zero. That is within a few standard deviations of zero as we can see for example in the case of K which is within 2 standard deviations of zero.
But not only does this check our background measurement, but to (finally!) get to your question it also checks for possible interferences from other elements. That is, if we are getting a non-zero value for an element which should be zero, we need to check for a possible interference using the Standard Assignments dialog as discussed here:
https://probesoftware.com/smf/index.php?topic=626.msg8019#msg8019Now there's also the possibility that this standard has a small contamination of the measured element, so we need to "know" our standards to "trust" them.
Question 2: What about selecting different reference standards for the same element on the different standards in my run? Is that analytically appropriate? Is it necessary? For example, I'm trying to measure oxygen. I have selected a fully-characterized multi-component glass as my reference standard for oxygen for all of the standards and all of the unknowns in my run. In some cases when measuring the concentration of oxygen in a mineral standard (e.g. Albite), I obtain better oxygen values when using another mineral standard (e.g. Orthoclase) as the reference for oxygen in Albite, as compared to using my glass standard or a simple oxide like Al2O3 as the oxygen standard for measuring oxygen in Albite. I'm assuming the variations in local chemical environment are responsible for the variations in calculated concentrations.
Yes, you are exactly correct. This is because the energy distribution of low Z emission lines are affected by the chemical state of the other elements bonded to that low Z element.
So in additional to all the the above issues regarding accuracy, oxygen and other low energy emission lines are subject to chemical state issues, which can affect the accuracy because the peak intensity is not accurately characterizing the elemental concentration. This is the idea behind Bastin's Area Peak Factors (APFs):
https://probesoftware.com/smf/index.php?topic=536.msg2993#msg2993One can also investigate Area Peak factors as described here, but it's ma bit of a research project:
https://probesoftware.com/smf/index.php?topic=536.msg2946#msg2946Another alternative for APFs is to utilize the "integrated peak intensities" acquisition option. This tells Probe for EPMA to acquire a full scan on each peak, as opposed to just the peak intensity. That is to utilize the integrated intensity as opposed to just the peak intensity to deal with chemical states causes shape changes in the peak. This option is here in the Elements/Cations dialog:
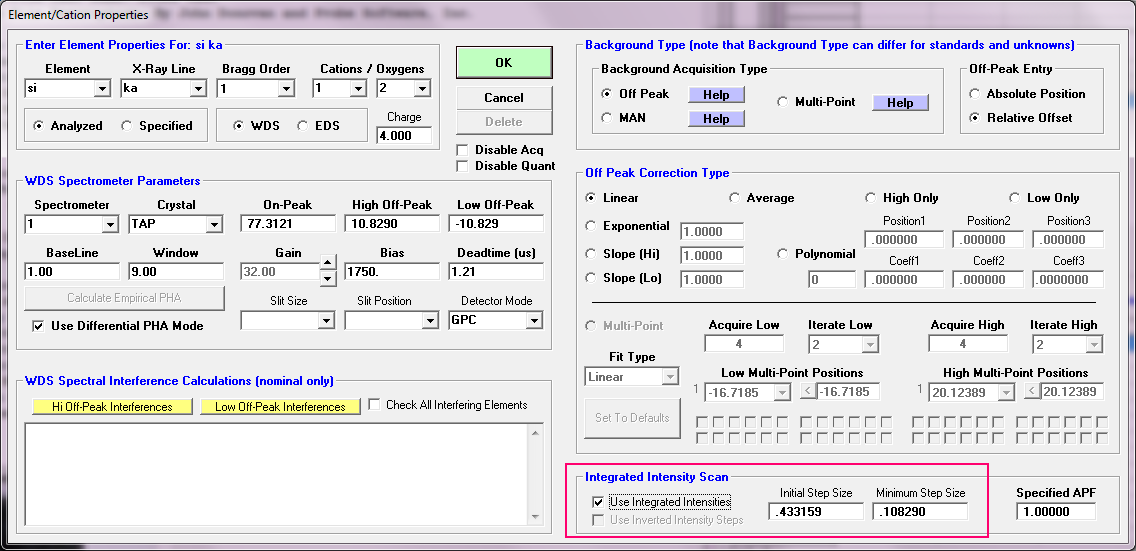
The basic idea is to acquire a scan from the low off-peak to the high off-peak to capture the entire integrated intensity of the peak. It works! But it is more time consuming than just measuring the peak intensity. Here is an example measuring sulfur which is a somewhat different animal because changes in the sulfur chemical state cause a change in the sulfur peak *position*, but not their *shape*:
https://probesoftware.com/smf/index.php?topic=733.msg4660#msg4660Question 3: If making interference corrections and adjustments to the measurements on the standards is an appropriate practice, what is the easiest way to apply the interference corrections and variations in reference standard to all of the sets of standard measurements in my run? (I have 6 sets of standards measurements in this run). I'm assuming that the "Set-up" feature is the path to pursue, but I haven't used that before, and I'm not sure if I need to use an "Elemenl Set-up" or a "Sample Set-up".
Thank you for your patience. And, I apologize if this is an obvious question.
If you're simply adding, removing or changing interference corrections to the standards (and hopefully also to the unknowns), just use the Select All button in the Analyze! window when the All Samples option is selected.
As for acquisition of new samples, the software automatically utilizes previously assigned interferences in the last unknown, or from the Automate! based on the Sample Setup, if Sample Setups were assigned there.
I probably missed some important questions in your post, so please feel free to ask further questions. Getting really accurate data isn't easy, but it can be done. Getting good data on oxygen and other low energy emission lines is even more challenging.
You might also want to investigate the application of empirical MACs as described here:
https://probesoftware.com/smf/index.php?topic=8.msg5258#msg5258Finally, here is a link to a report I wrote up in my attempts to measure boron in various magnesium boride copmpounds. It might provide you with some ideas:
https://epmalab.uoregon.edu/reports/Preliminary%20work%20on%20MgB2%20and%20MgB4.pdf

 We are a community of analysts, that cares about EPMA