We implemented a variation/correlation plotting method for quantitative pixel calculations in CalcImage from the Polygon/Pixel Filtering Extraction window as seen here:
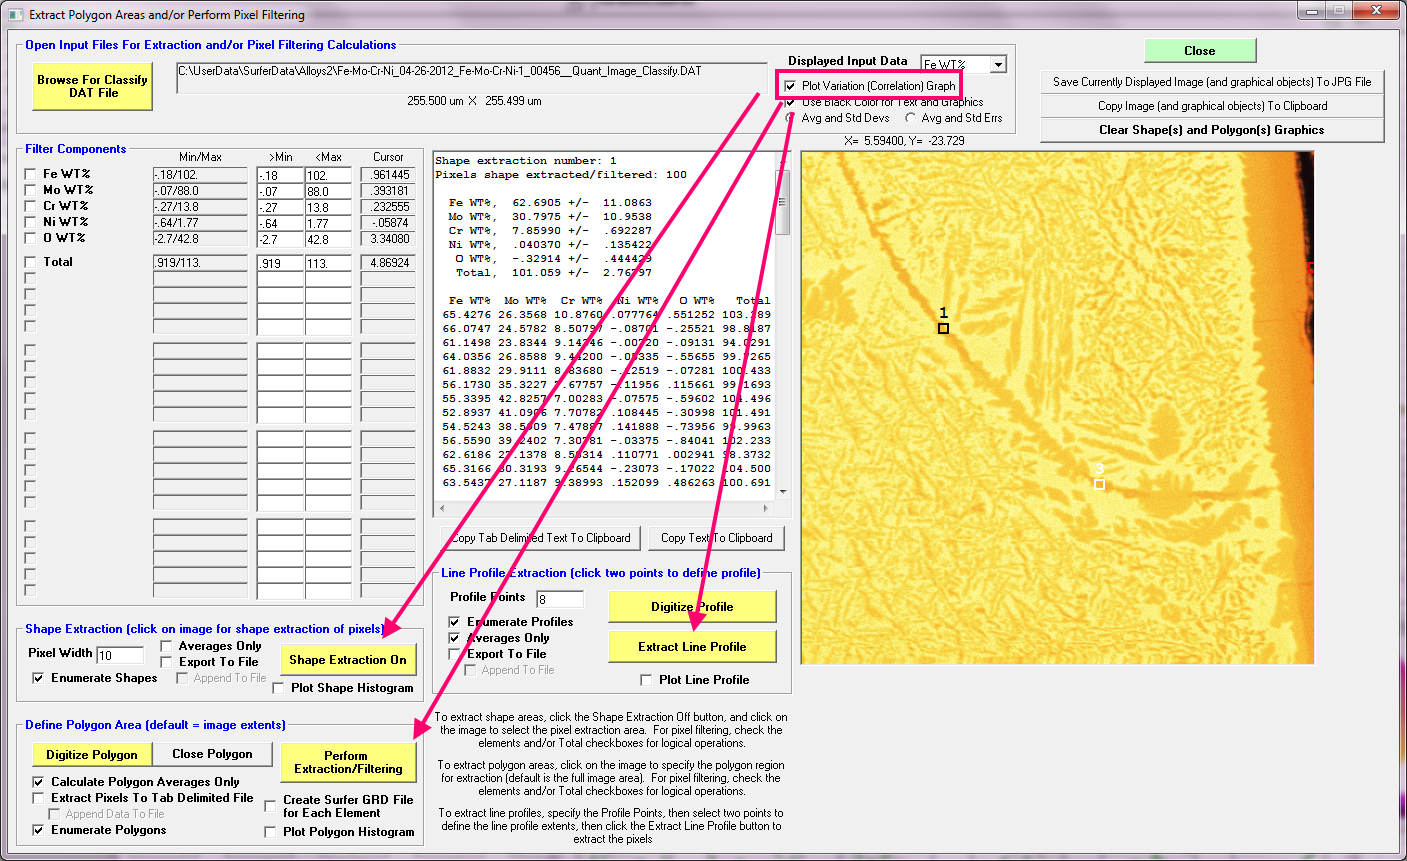
This variation plot method works for the shape extraction, polygon extraction and also line profile extraction methods. Here is an example using a 10 x 10 pixel shape extraction:
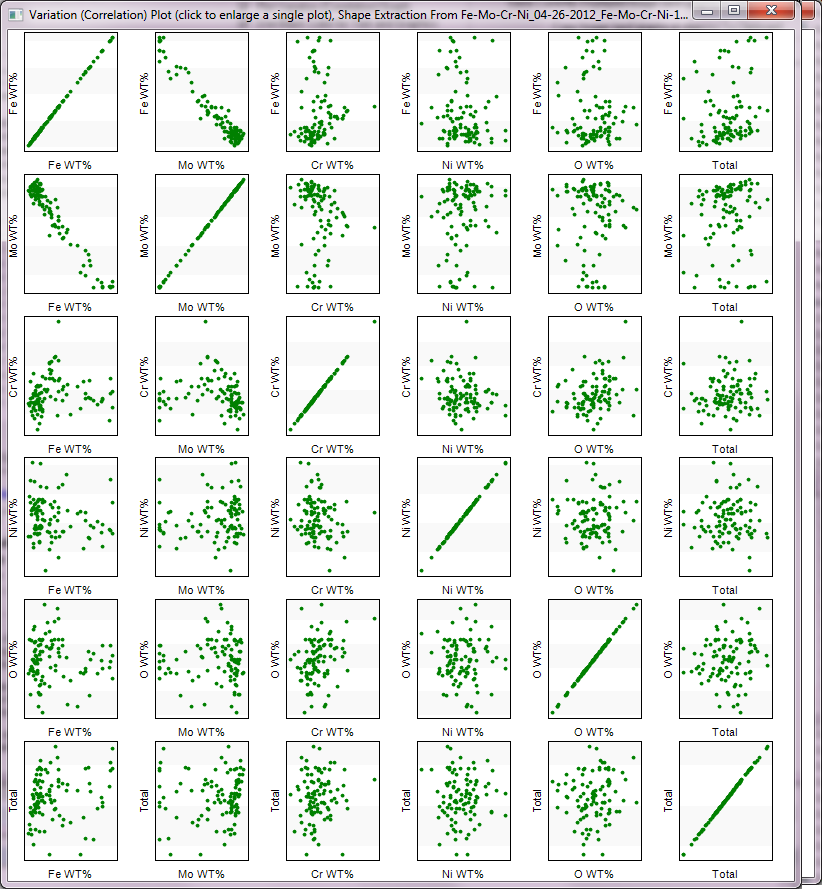
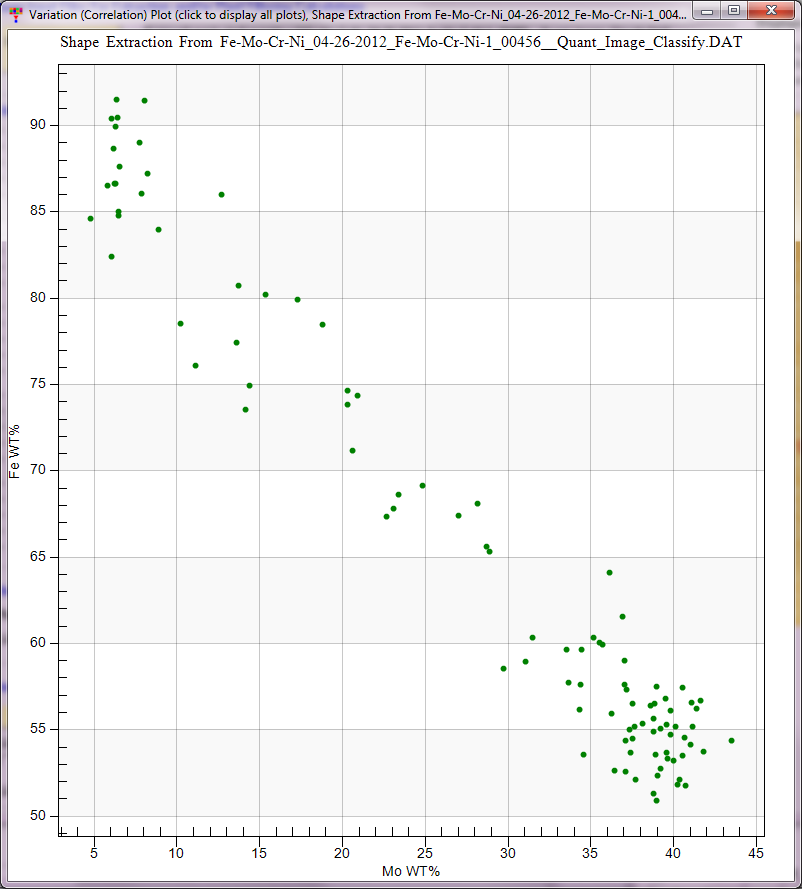
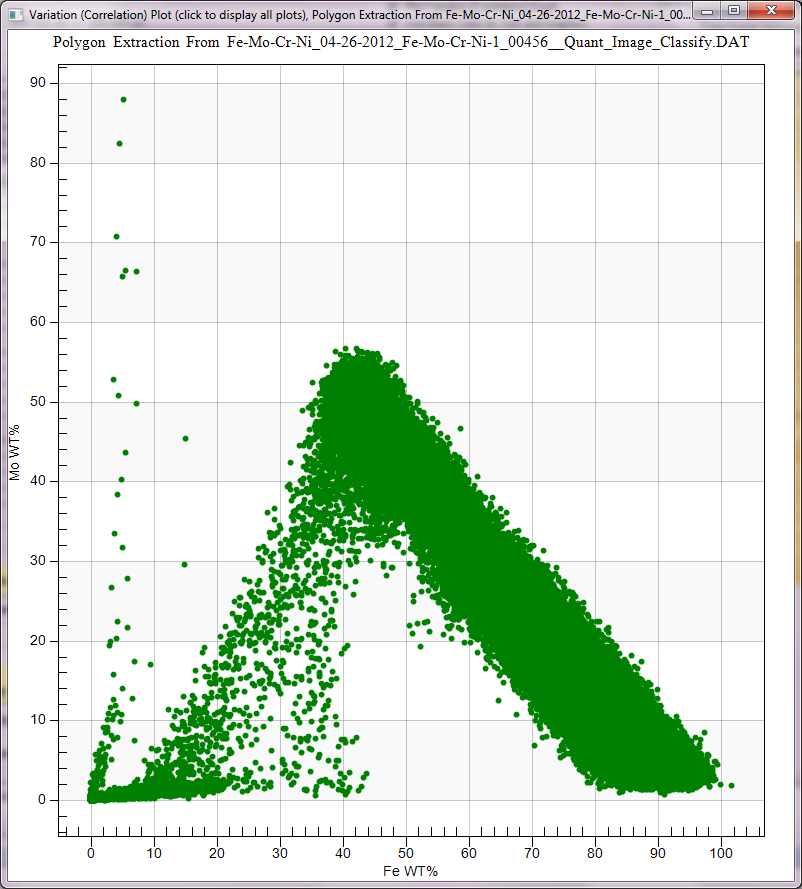
Again, as with the variation plotting in Probe for EPMA, if you click on one of the graphs, the plot is expanded as seen here:
If you decide to plot the quant pixels for the whole x-ray map image, be aware that as the number of pixels gets larger than 100K or so, the plotting slows down, but it does display eventually:
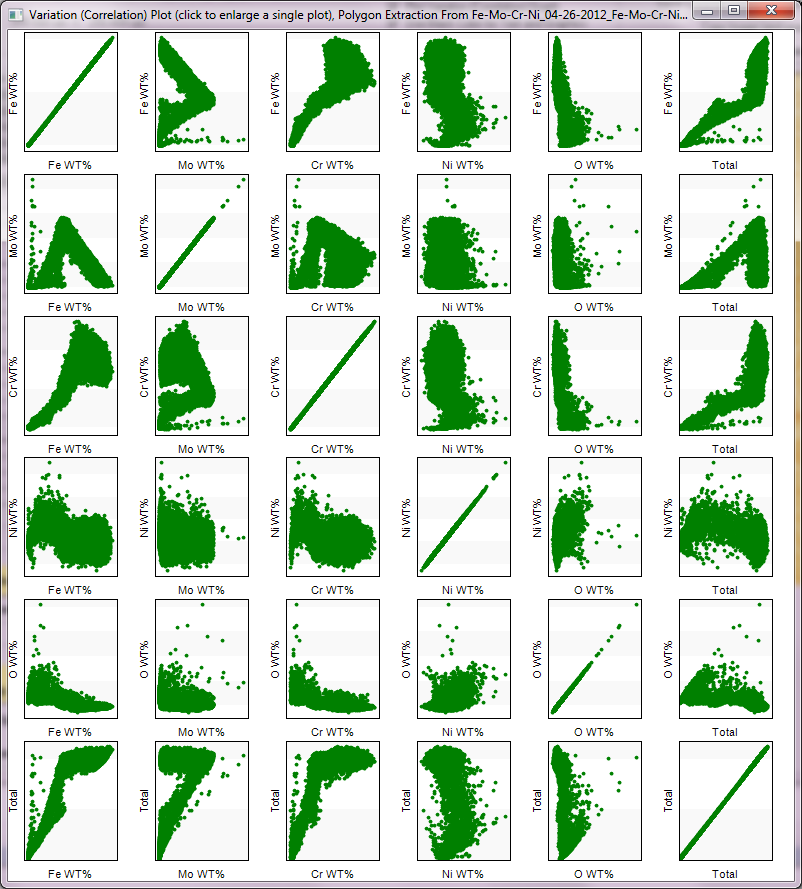
and again one can display a single element pair correlation:


 Welcome to the Probe Software forum area!