We've released a new pixel extraction plotting feature in v. 12.5.6 of Probe for EPMA in the CalcImage image quantification and analysis application.
This is just an initial effort at this new feature, but we think it could be useful for quantitative image analysis. To utilize this feature simply check one of these two checkboxes for either the shape extraction or polygon extraction methods:
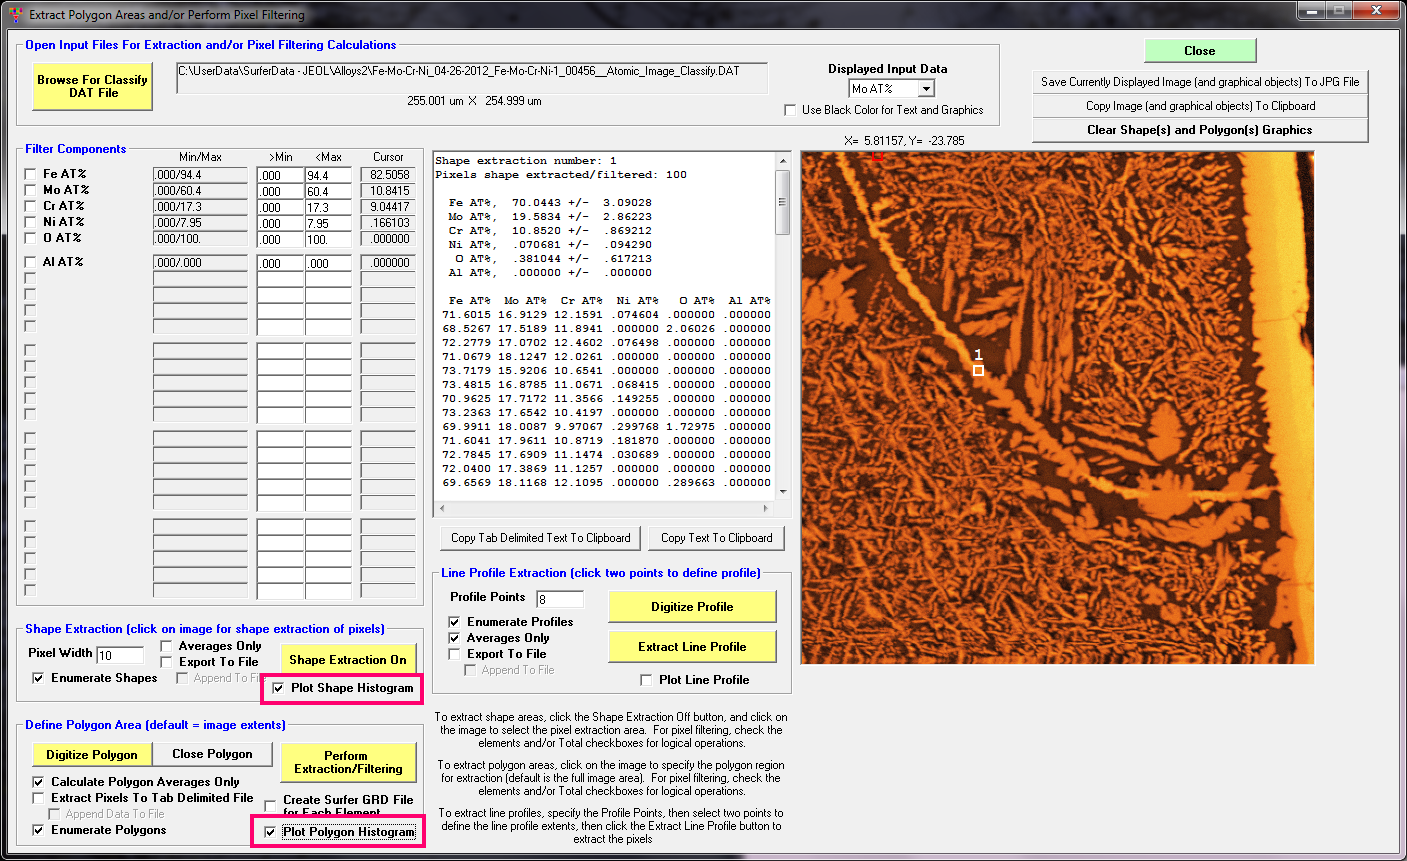
Because the polygon extraction method defaults to the entire image area, simply clicking the Perform Extraction/Filtering button will output the quantitative average and/or pixel results to the text windows or files. And if the Plot Polygon Histogram checkbox is checked, the application will also display a quantitative histogram, or as Ed Vicenzi suggests, a "Quantigram" plot. We like it.
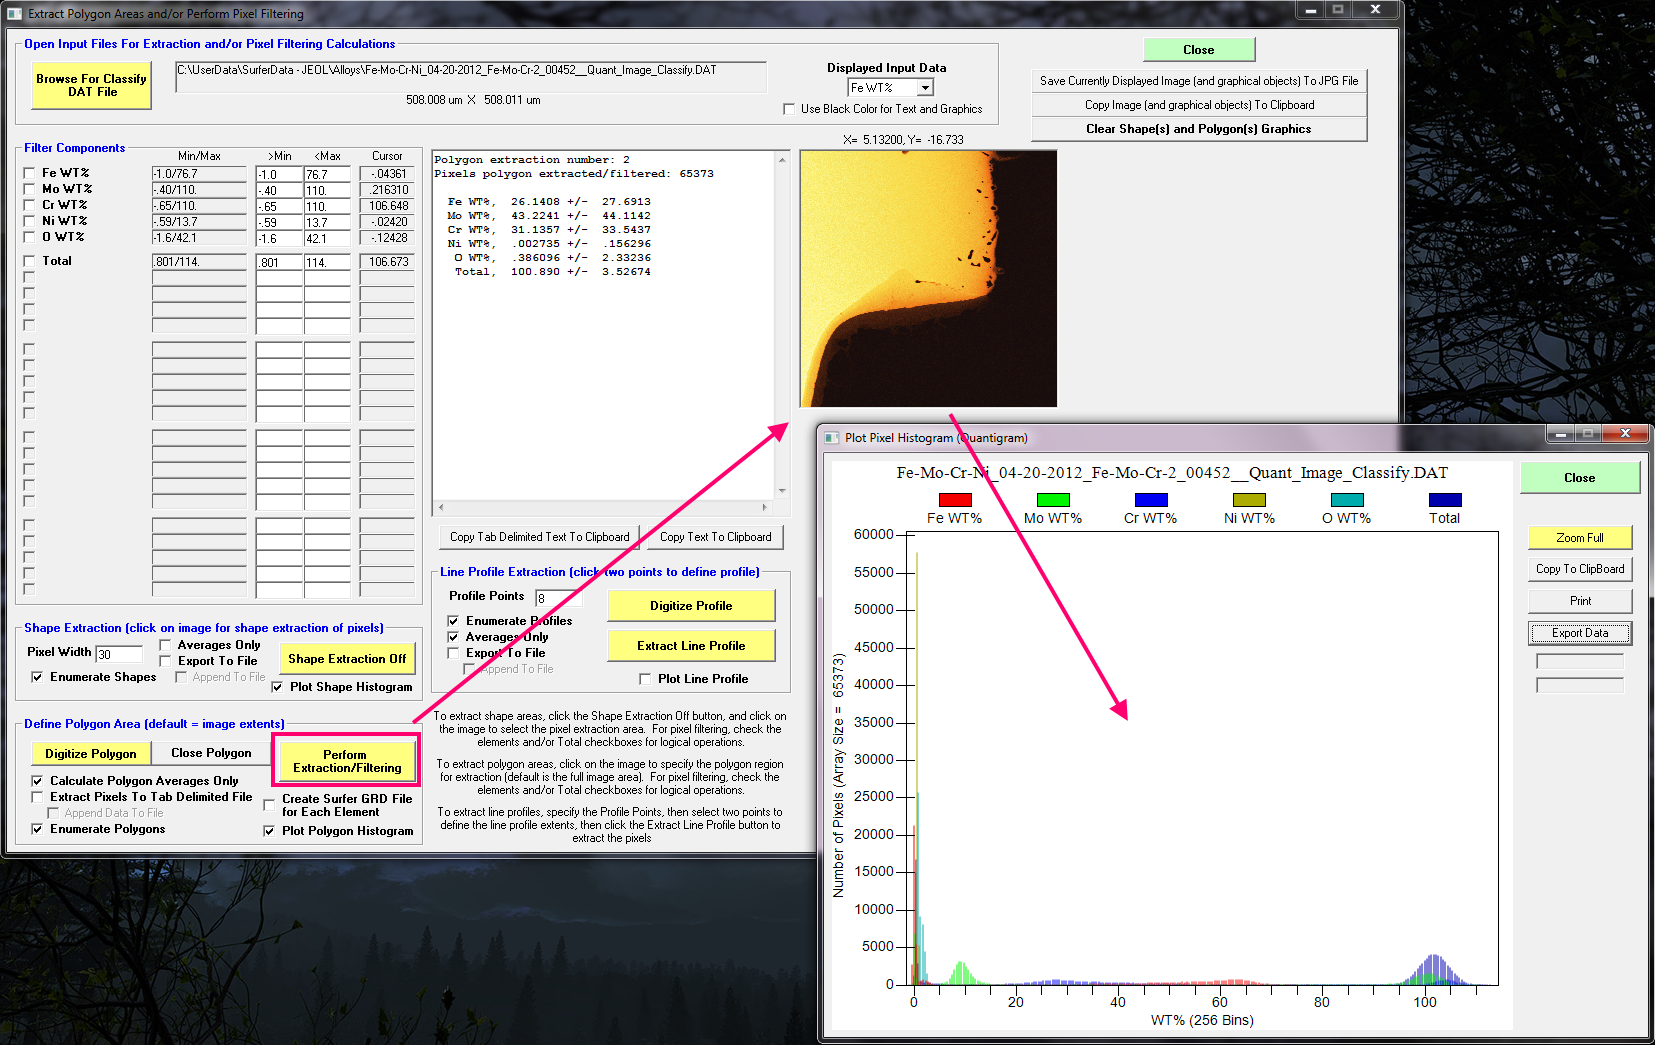
Here is a quantigram of a full quantitative x-ray map of an Fe-Mo-Cr alloy diffusion zone:
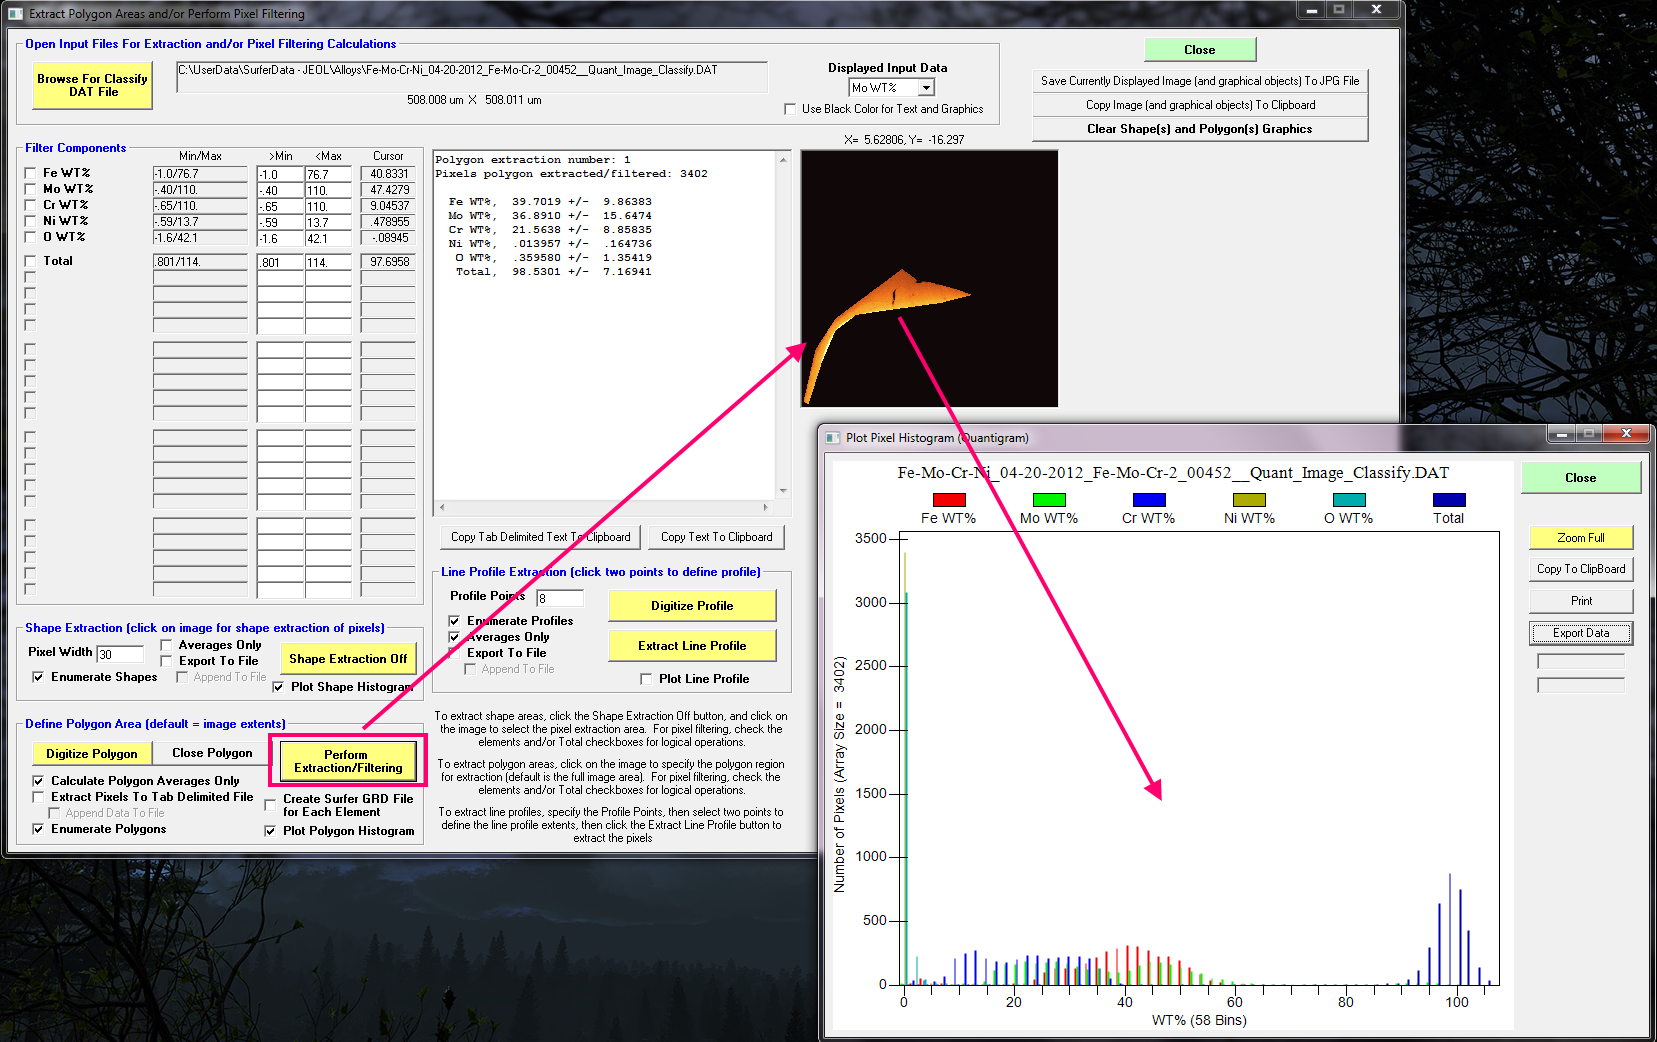
And here is a quantigram of a polygon area in this x-ray map:
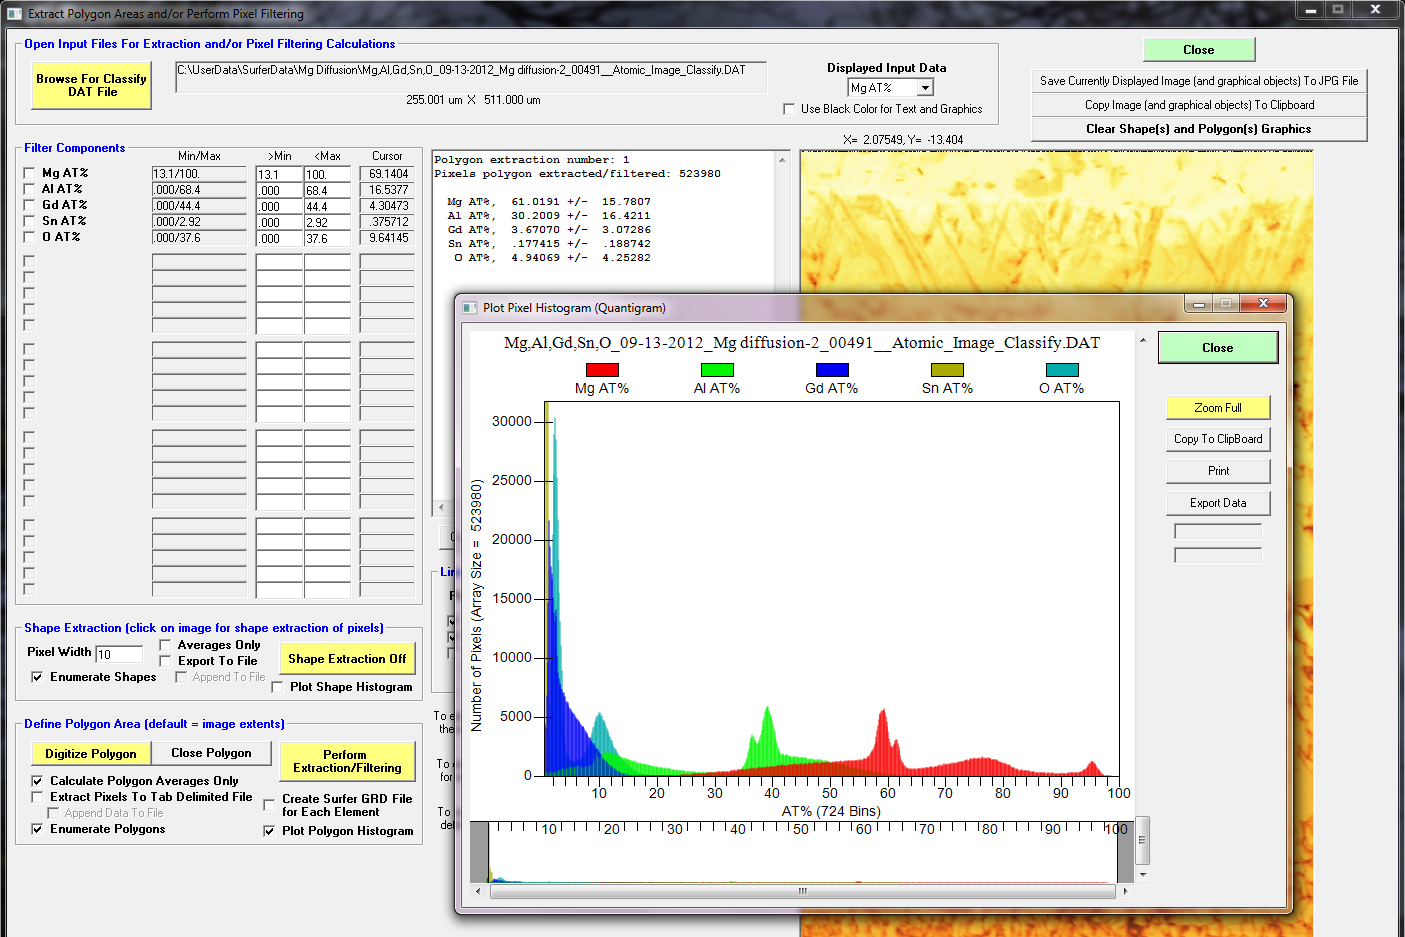
Finally, here is an example from a multiphase material showing the quantitative distribution of pixels:
Please update your Probe for EPMA and try out this latest pixel extraction plot feature in Calcimage and let us know what you think.


 Welcome to the Probe Software forum area!