OK, I have a question for you math experts. Because, Lord knows, math is not my strongest suit!
One of the neat things about the K-means clustering method in CalcImage is that one can choose to cluster a set x-ray maps based on any of the data types calculated during the map quantification. These data types of course always includes elemental (default quant), but the user can also perform cluster calculations on other data types for example, atomic, oxide, formula basis, net intensities, k-ratios, etc, etc.
I previously noticed when performing the k-means clustering calculation, that depending on the actual data type selected, the clustering process can produce somewhat different results. Now I am not surprised by this, because of course the input data is different for each data type, so why wouldn't the clustering results be different? But I am curious as to the precise mathematical effects involved.
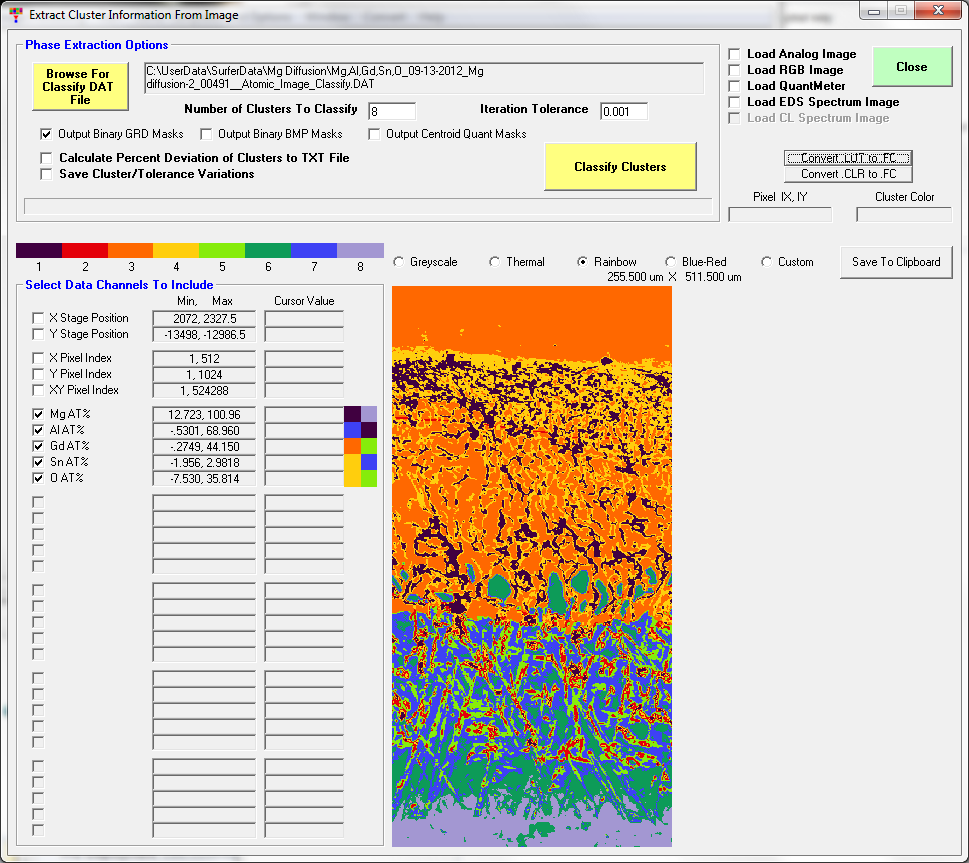
For example here is a map of a Mg-Gd-Al-Sn alloy with the k-means clustering based on atomic percents:
and here is the same map, but with the k-means clustering based on elemental wt percents:

Both clustering calculations were based on 8 phases and an iteration tolerance of 0.001 percent. Now, ignore the fact that the phases in the two results have different colors. The colors chosen for each phase are simply a result of the order in which each phase was identified in the clustering iteration process (which in itself tells you something is different mathematically). But also note that especially near the lower part of the sample, there is quite a bit of difference in the pixels assigned to the 8 phases.
Can someone please give us all a short explanation of what exactly is going on here? I send the atomic and elemental map data as tab delimited files to you if anyone is interested, but they are too big to upload as attachments.


 You cannot see "members only" boards if you are not a member, so please join the forum!