Author Topic: EDS collimation effects  (Read 3298 times)

Gian Colombo

  • Post Doc
  • ***
  • Posts: 11
EDS collimation effects
« on: September 22, 2016, 10:31:13 AM »
John,

Do you have an idea of how much deflection an EDS detector might tolerate?  Some regions in our specimens were pushing the beam over 100-150 microns off-axis which pushed the limits of my beam offset "correction" procedure.  Do you think EDS could handle being that far "out-of-focus"?

We don't have an EDS system on our SX100, but we do have other SEM's equipped with EDS that I might be able to do some work on.

Probeman

  • Emeritus
  • *****
  • Posts: 2858
  • Never sleeps...
    • John Donovan
Re: EDS collimation effects
« Reply #1 on: September 22, 2016, 10:52:59 AM »
Do you have an idea of how much deflection an EDS detector might tolerate?  Some regions in our specimens were pushing the beam over 100-150 microns off-axis which pushed the limits of my beam offset "correction" procedure.  Do you think EDS could handle being that far "out-of-focus"?

We don't have an EDS system on our SX100, but we do have other SEM's equipped with EDS that I might be able to do some work on.

Hi Gian,
I haven't performed an actual test, but considering the aperture based collimation that EDS detectors generally utilize, I would guess that they could tolerate millimeters of beam deflection (at least).  Maybe more. This is not too surprising as even at very low beam scan magnifications, we don't see any spectrometer defocusing  in EDS x-ray maps.

EDS vendors have certainly improved their spectrometer collimation however. Remember the ubiquitous system peaks that were so visible in older EDS systems?

Almost as important is a related question: how well aligned is one's EDS detector?  That is, is the EDS collimation actually centered on the beam spot?

Someone should run a quick test for us using manual beam deflection.
john
« Last Edit: September 22, 2016, 11:30:21 AM by Probeman »
The only stupid question is the one not asked!

Karsten Goemann

  • Global Moderator
  • Professor
  • *****
  • Posts: 228
Re: EDS collimation effects
« Reply #2 on: September 22, 2016, 04:19:08 PM »
That should also depend on things like detector area, solid angle etc., right? So it might be best to actually determine that individually on your system.

On our field emission SEM which has an 80mm^2 SDD at 40 degrees take-off-angle, 15mm working distance, we start to notice intensity loss of more than 1% relative in the corners of 4x3 rectangular maps when the horizontal field width exceeds about 400 microns. I haven't tried to measure the actual detector - sample distance, so I don't know the solid angle.

For us this is important as we actually do standards-calibrated quantitative EDS by point & shoot on that instrument (without normalising to 100% total).

I've attached a PDF with the test series I did.


Probeman

  • Emeritus
  • *****
  • Posts: 2858
  • Never sleeps...
    • John Donovan
Re: EDS collimation effects
« Reply #3 on: September 22, 2016, 08:10:43 PM »
That should also depend on things like detector area, solid angle etc., right? So it might be best to actually determine that individually on your system.

Absolutely!

In the magnetic samples from Ohio State that we had to deal with at U of Oregon, the maximum beam deflection we observed (compared to the optical image) was always less than 50 um, so we felt we were safe enough to utilize EDS for quantification of these alloys. And in fact, our (also un-normalized!) totals seemed to be quite good (at least significantly better than WDS due to the greater defocusing effects of Bragg spectrometers- in some directions anyway!). 

Interestingly, this discussion is a little related to issues of secondary fluorescence  from grain boundaries-  with EDS, the grain boundary orientation is of little consequence to the secondary fluorescence from grain boundaries, but for WDS the degree of Bragg defocus depends greatly on the grain boundary to spectrometer crystal orientation!  In some orientations, no problem, other orientations the secondary fluorescence can extend for hundreds of microns...

But yes, I totally agree that everyone should perform a test of this effect on their own EDS systems.  In fact, even identical EDS systems mounted on different instruments will likely produce different "collimation defocus" effects, depending on the particular sample to detector distance (not to mention systems that have retractable EDS detectors!).

On our field emission SEM which has an 80mm^2 SDD at 40 degrees take-off-angle, 15mm working distance, we start to notice intensity loss of more than 1% relative in the corners of 4x3 rectangular maps when the horizontal field width exceeds about 400 microns. I haven't tried to measure the actual detector - sample distance, so I don't know the solid angle.

For us this is important as we actually do standards-calibrated quantitative EDS by point & shoot on that instrument (without normalising to 100% total).

I've attached a PDF with the test series I did.

Excellent.  I hope that our forum members will take a few minutes and perform some EDS measurements similar to yours, to help answer this question.  Whether it is magnetic samples deflecting the beam or point and shoot methods, it would be good to know where particular EDS systems on particular instruments start to exhibit these collimation defocus effects.
john
« Last Edit: September 22, 2016, 08:18:22 PM by Probeman »
The only stupid question is the one not asked!

Karsten Goemann

  • Global Moderator
  • Professor
  • *****
  • Posts: 228
Re: EDS collimation effects
« Reply #4 on: September 22, 2016, 08:19:50 PM »
I agree. You can see in our test that this is totally angle dependent. In our case the detector looks from the north in relation to the maps/images.

Our other SEM has two identical EDS detectors (to maximise counts). It'll be interesting to do the same test there.

Probeman

  • Emeritus
  • *****
  • Posts: 2858
  • Never sleeps...
    • John Donovan
Re: EDS collimation effects
« Reply #5 on: September 23, 2016, 09:43:51 AM »
I've attached a PDF with the test series I did.

Hi Karsten,
I'm curious. In your attached pdf you show x-ray maps of "unnormalised" maps and  "normalised" maps. It appears that the "normalised" maps are being corrected for the EDS collimation issues we've been discussing.

May I ask how you are performing the "normalisation"?   I've used the CPQ feature in CalcImage, where the standard is acquired as a map along with the unknown map, and therefore the k-ratio "normalizes" out the Bragg defocusing effect as seen here:

http://probesoftware.com/smf/index.php?topic=114.0
« Last Edit: September 26, 2016, 01:56:02 PM by Probeman »
The only stupid question is the one not asked!

Probeman

  • Emeritus
  • *****
  • Posts: 2858
  • Never sleeps...
    • John Donovan
Re: EDS collimation effects
« Reply #6 on: September 26, 2016, 02:13:06 PM »
So I decided to perform a test on my Cameca Sx100 by tuning up a number of elements and acquiring a beam deflection analysis on some standards. In this image we see the SrTiO3 standard and two traverses digitized (roughly) west to east and north to south. The data was acquired by moving the stage to the center of the digitized image and utilizing beam deflection to move the beam to each traverse position.


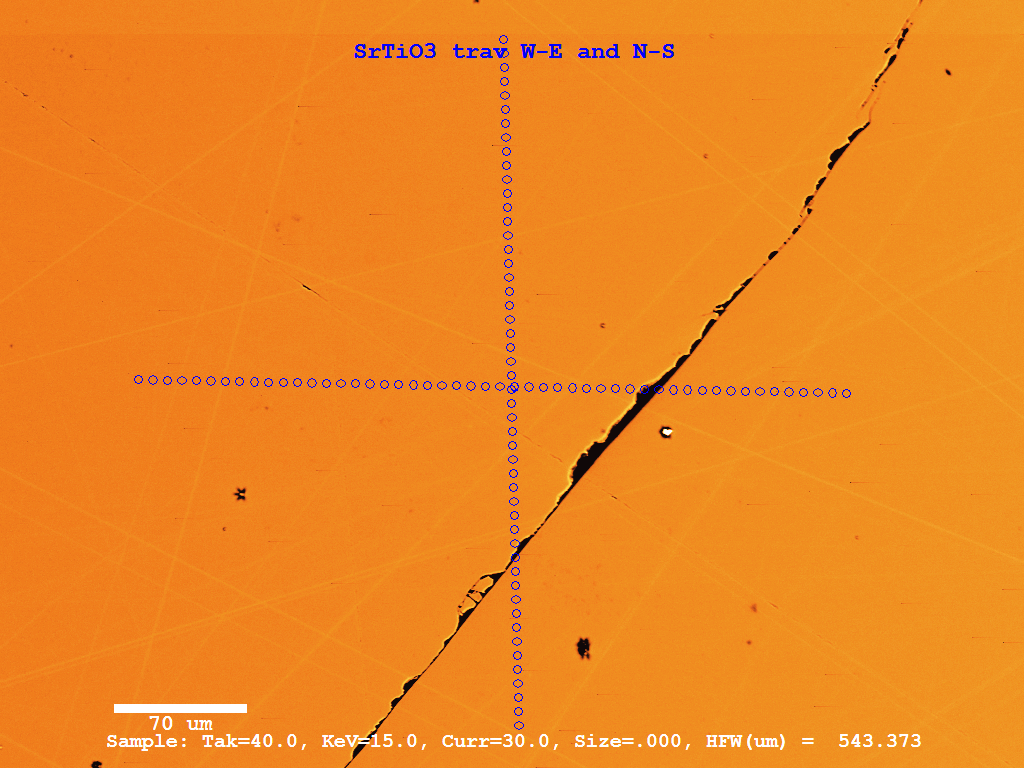
Both WDS and EDS spectra were acquired at the same time and processed separately. The WDS setup looks like this:


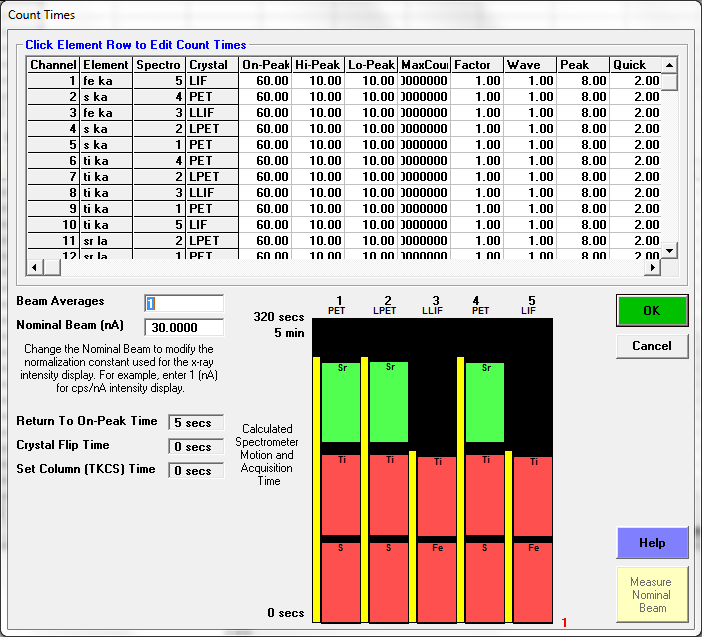
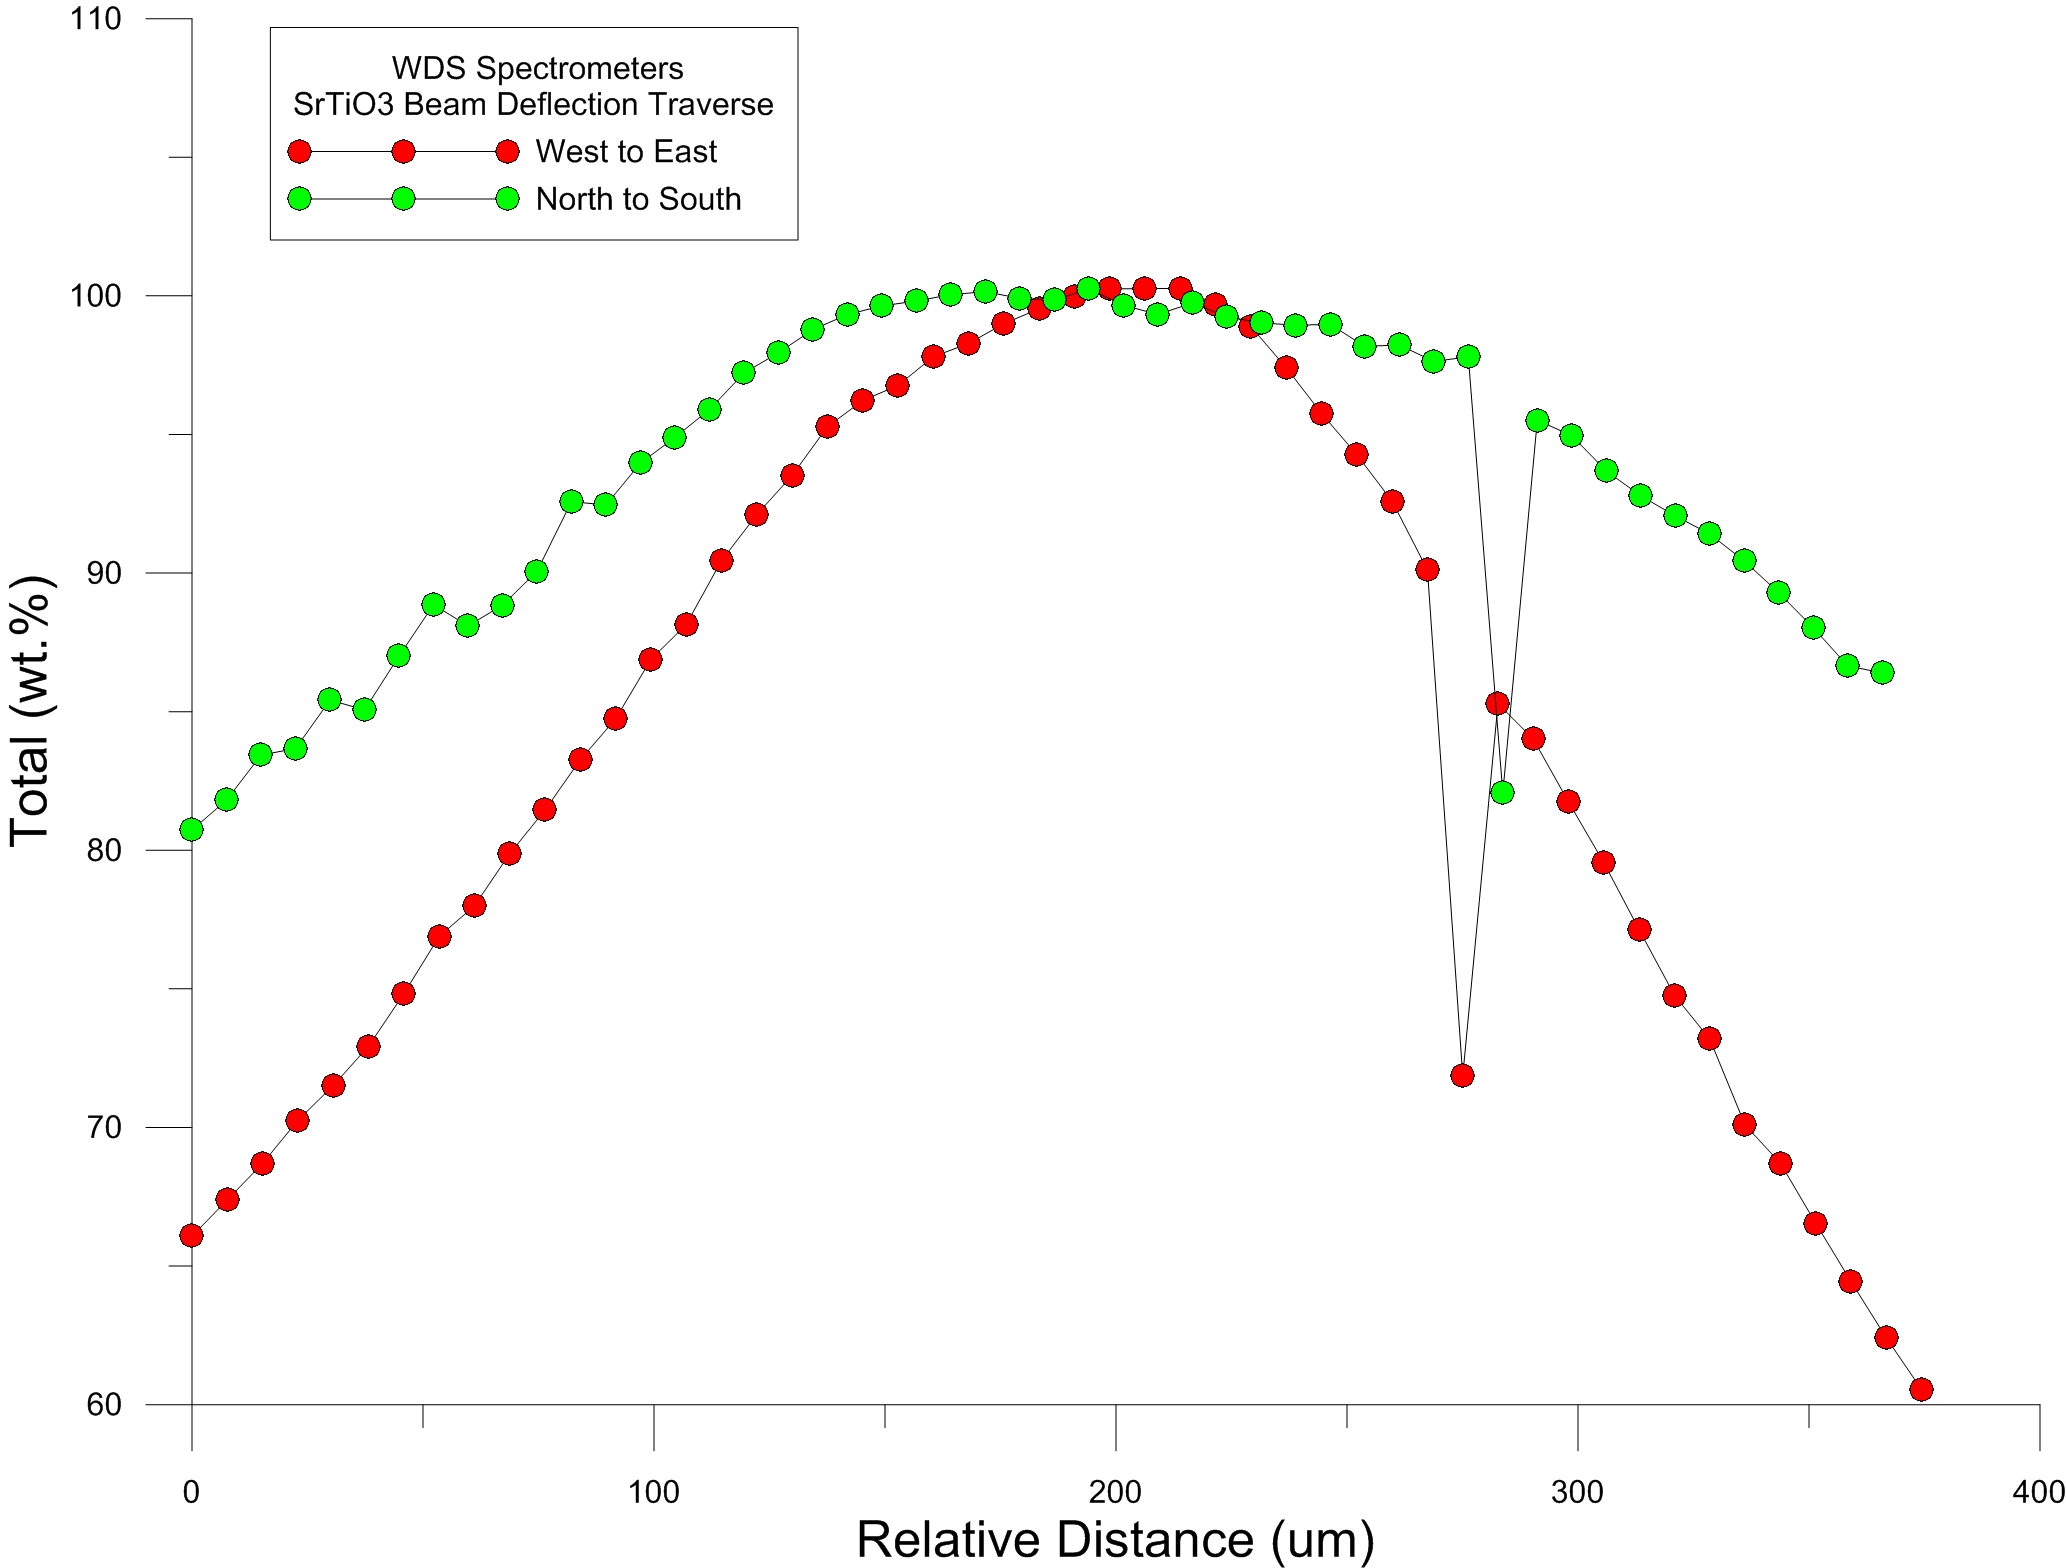
Here are the WDS results just looking at spectrometers 1, 2 and 4 for Sr La (PET, LPET and PET) and all 5 spectrometers for Ti Ka (PET, LPET, LLIF, PET and LIF). Oxygen was calculated by stoichiometry and the acquired elements were "aggregated" using the Probe for EPMA aggregate intensity feature:


Next the same acquisition but processed for Ti, Sr, S and Fe as EDS elements:


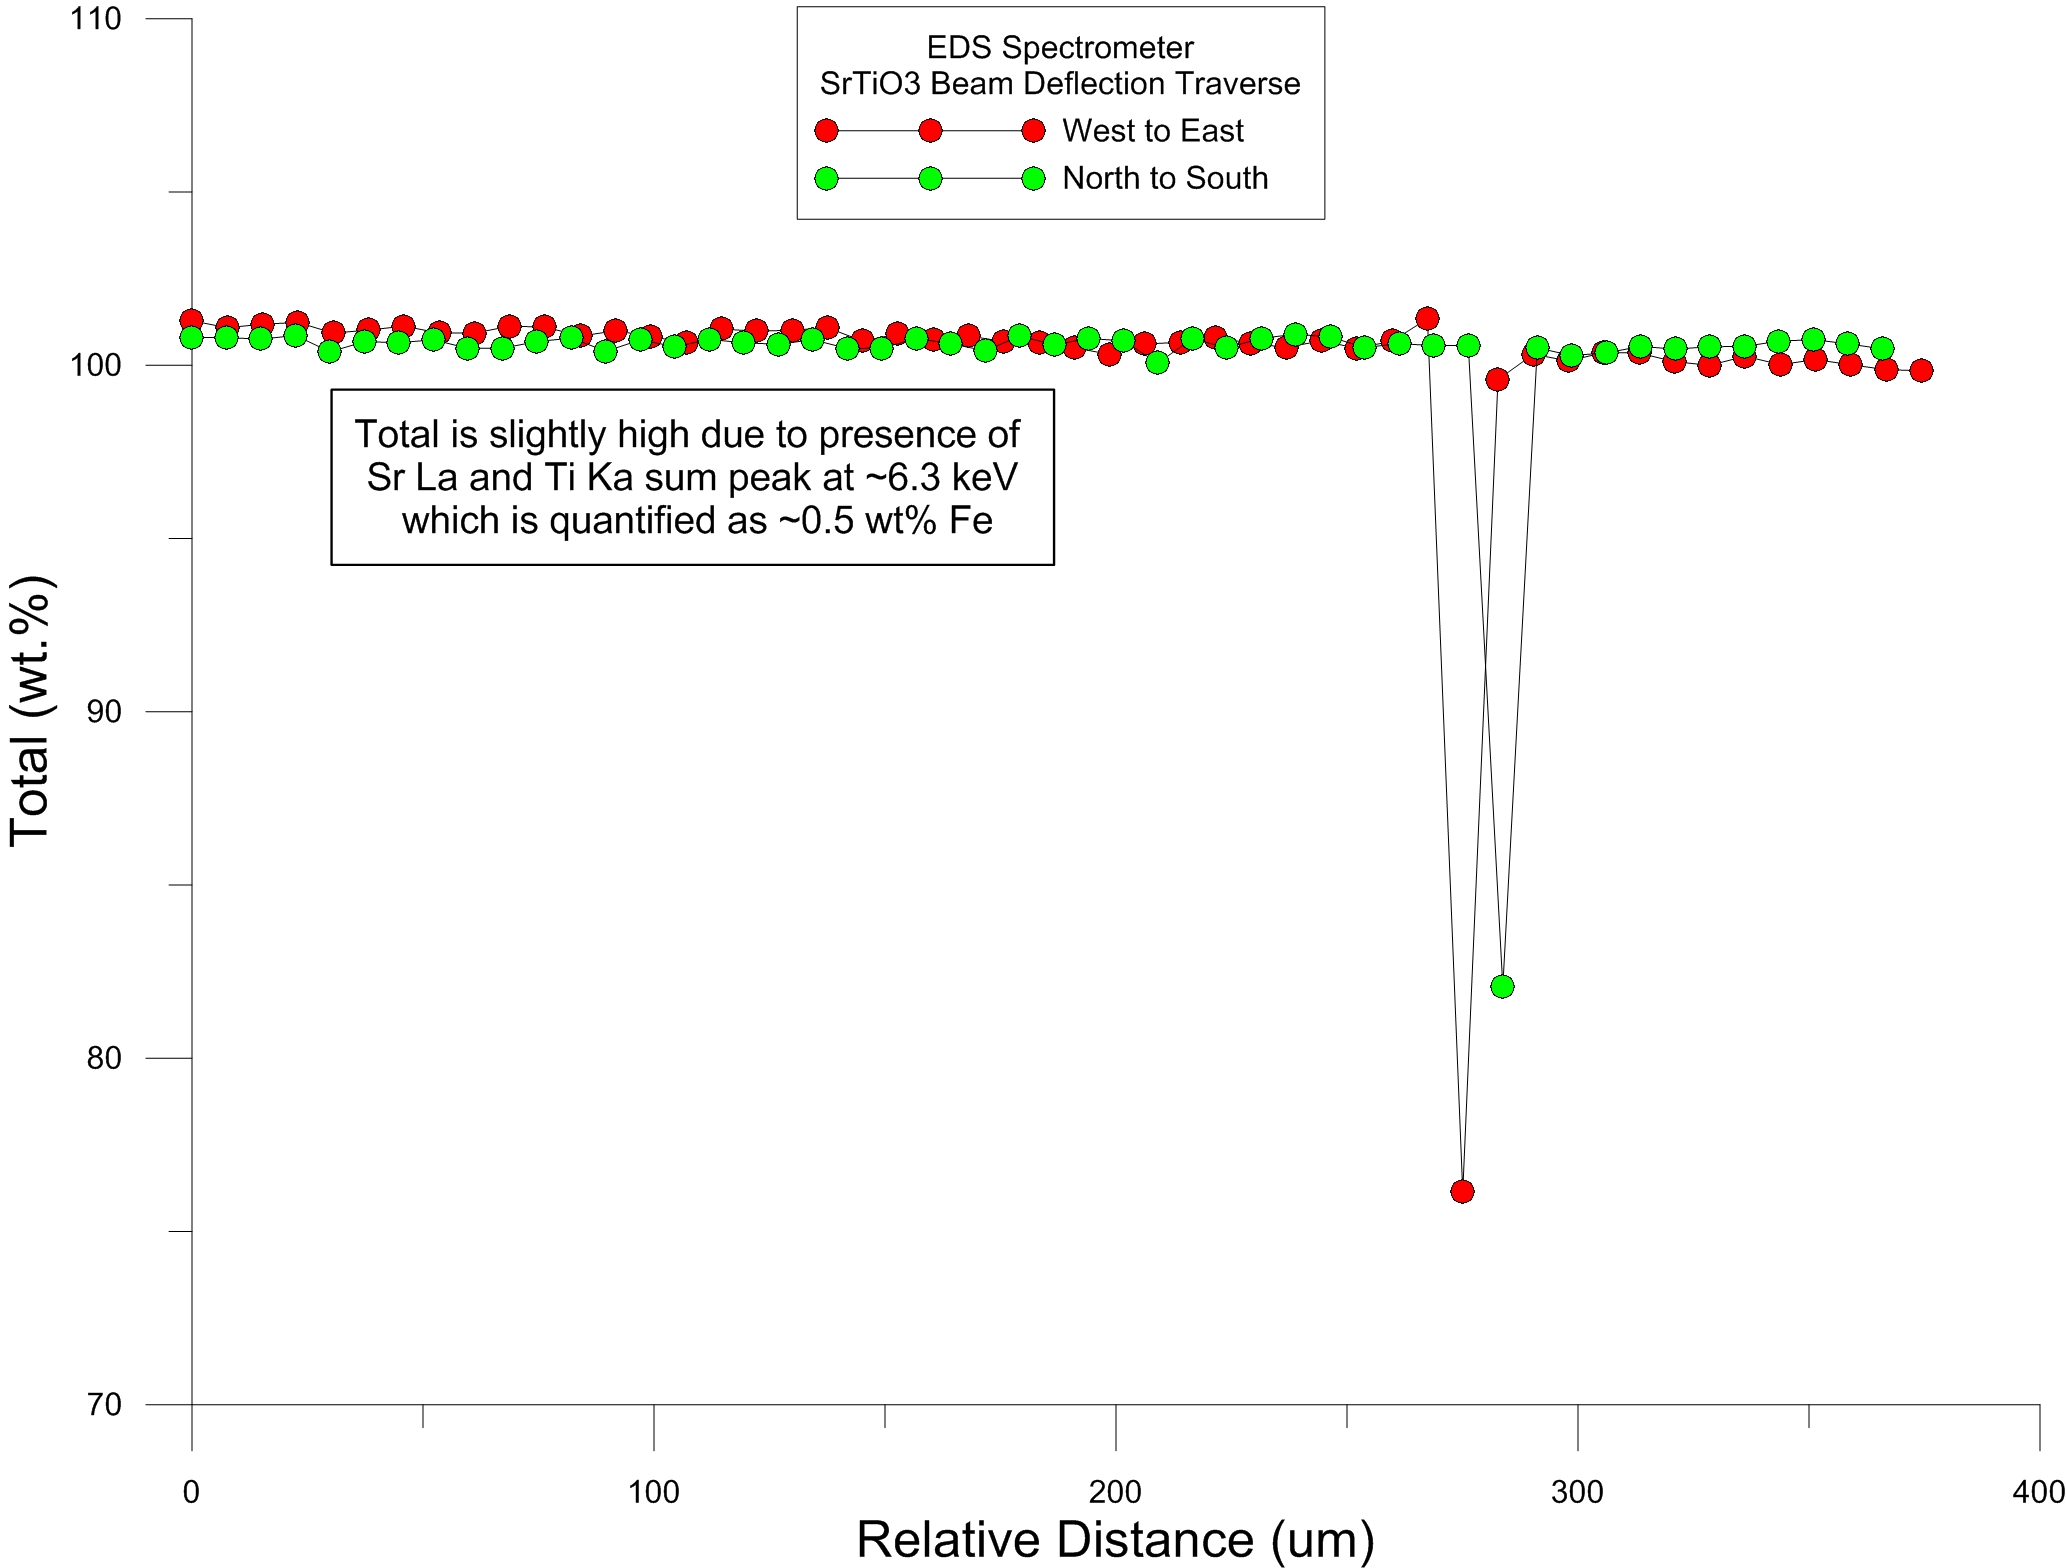
So, with a Thermo NSS EDS system (10 sq. mm) in the front port, we see essentially *no* "collimation defocusing" on the EDS out to ~+/- 200 um, but (of course) we see severe Bragg defocusing with the WDS spectrometers even a few 10 tens of microns from the Bragg x-ray focus.

I expect that every EDS system will differ more or less depending on the mechanical details. So we now have two data points, the UTAS SEM and the UofO Sx100. 

Any JEOL people with a Thermo detector interested in trying this test? 
john
« Last Edit: April 12, 2020, 06:27:20 PM by John Donovan »
The only stupid question is the one not asked!

Probeman

  • Emeritus
  • *****
  • Posts: 2858
  • Never sleeps...
    • John Donovan
Re: EDS collimation effects
« Reply #7 on: September 26, 2016, 03:30:44 PM »
And just for fun, here are the (unaggregated) Ti concentrations from Spec 5 only showing the difference between a traverse (west to east) which generally follows the minimum Bragg defocus for this spectrometer which sits at the back of the instrument, versus a traverse (north to south) which is perpendicular to the axis of minimum Bragg defocus:


Please note that because the intensities were not aggregated as in the previous post, the concentrations shown above are quite inaccurate due to the average total of 365%, which produces an improper treatment of the matrix corrections...
john
« Last Edit: April 12, 2020, 06:27:33 PM by John Donovan »
The only stupid question is the one not asked!

Karsten Goemann

  • Global Moderator
  • Professor
  • *****
  • Posts: 228
Re: EDS collimation effects
« Reply #8 on: September 26, 2016, 05:00:13 PM »
Hi John,

Hi Karsten,
I'm curious. In your attached pdf you show x-ray maps of "unnormalised" maps and  "normalised" maps. It appears that the "normalised" maps are being corrected for the EDS collimation issues we've been discussing.

May I ask how you are performing the "normalisation"?

This is just a quick test I did in 2012 and it was way less fancy than your CPQ method. These are quantified grids and the normalisation to 100% total is just a tick box in the quantification options dialog of the EDS software. I used a basalt glass and the total list of quantified elements was O, Na, Mg, Al, Si,  K, Ca, Ti, Cr, Mn, Fe. I compared it with just doing the normalisation to 100% total in Excel after quantification and the differences appear to be minimal, <0.01wt% for all elements. But looking at the "normalised" maps it appears to correct the defocussing issue reasonably well in this case. Obviously this is not an ideal approach but I just wanted to get a feel for what the limits are. For some semiquant EDS maps normalising to 100% total might be OK and that way we would be able to use larger fields of view. And for the full quant point&shoot and mapping we now know not to go larger than 400 microns FOV on this system.

Probeman

  • Emeritus
  • *****
  • Posts: 2858
  • Never sleeps...
    • John Donovan
Re: EDS collimation effects
« Reply #9 on: September 26, 2016, 09:33:51 PM »
Hi John,

Hi Karsten,
I'm curious. In your attached pdf you show x-ray maps of "unnormalised" maps and  "normalised" maps. It appears that the "normalised" maps are being corrected for the EDS collimation issues we've been discussing.

May I ask how you are performing the "normalisation"?

This is just a quick test I did in 2012 and it was way less fancy than your CPQ method. These are quantified grids and the normalisation to 100% total is just a tick box in the quantification options dialog of the EDS software. I used a basalt glass and the total list of quantified elements was O, Na, Mg, Al, Si,  K, Ca, Ti, Cr, Mn, Fe. I compared it with just doing the normalisation to 100% total in Excel after quantification and the differences appear to be minimal, <0.01wt% for all elements. But looking at the "normalised" maps it appears to correct the defocussing issue reasonably well in this case. Obviously this is not an ideal approach but I just wanted to get a feel for what the limits are. For some semiquant EDS maps normalising to 100% total might be OK and that way we would be able to use larger fields of view. And for the full quant point&shoot and mapping we now know not to go larger than 400 microns FOV on this system.

Hi Karsten,
OK I understand.

Of course while it's obvious that one would not want to perform a similar normalization to 100% for WDS intensities, because each spectrometer (and crystal) will have significantly different defocus curves, I wonder if a more subtle collimation effect could affect low energy versus high energy emission lines in the EDS spectra?

For example, could the EDS detector window thickness vary with radius (or other effects at the edge of EDS detector collimation), and preferentially attenuate low energy lines at geometric extremes of collimation?

I expect there's little or no effect like this with EDS, but if there was I suppose it would depend entirely on the EDS detector mechanical details.
john
« Last Edit: September 26, 2016, 09:56:10 PM by Probeman »
The only stupid question is the one not asked!

Karsten Goemann

  • Global Moderator
  • Professor
  • *****
  • Posts: 228
Re: EDS collimation effects
« Reply #10 on: September 26, 2016, 09:56:15 PM »
Well, I think it does. Looking at my test results it looks more pronounced for O Ka than Si Ka than Fe Ka.

Probeman

  • Emeritus
  • *****
  • Posts: 2858
  • Never sleeps...
    • John Donovan
Re: EDS collimation effects
« Reply #11 on: September 26, 2016, 10:18:39 PM »
Well, I think it does. Looking at my test results it looks more pronounced for O Ka than Si Ka than Fe Ka.

You mean that the area of 'close to 100% data' in the oxygen maps looks a little smaller than the same area for the other elements?

I think I might agree...
john
The only stupid question is the one not asked!

Karsten Goemann

  • Global Moderator
  • Professor
  • *****
  • Posts: 228
Re: EDS collimation effects
« Reply #12 on: September 26, 2016, 10:28:14 PM »
Yep, to me it looks like that for Si vs Fe as well. Or at least the distribution has less of this "V" shape that the Si and O maps have.