Author Topic: Magnetite Off-peak vs. MAN Precision Example  (Read 2735 times)

John Donovan

  • Administrator
  • Emeritus
  • *****
  • Posts: 3304
  • Other duties as assigned...
    • Probe Software
Magnetite Off-peak vs. MAN Precision Example
« on: August 15, 2015, 08:51:02 AM »
I want to report the magnetite data comparison for off-peak and MAN that I ran last night.  I'll be posting further results regarding sensitivity in the MAN Precision and Accuracy topic here:

http://probesoftware.com/smf/index.php?topic=307.msg3190#msg3190

once I finish coding Jared Singer's MAN regression sensitivity equations, but for now let's just look at the magnetite sample Ti and Mn standard deviations for the calculated concentrations starting with Ti Ka calculated using off-peak backgrounds:

ELEM:       Ti      Ti      Ti      Ti      Ti      Fe      Mn      Al      Si      Mg       O   SUM 
XRAY:     (ka)    (ka)    (ka)    (ka)    (ka)      ()      ()      ()      ()      ()      ()
   137    .031    .015    .027    .019    .017  72.080    .054    .201    .000    .072  27.803 100.318
   138    .038    .028    .034    .031    .061  72.080    .054    .201    .000    .072  27.803 100.401
   139    .022    .012    .022    .022    .005  72.080    .054    .201    .000    .072  27.803 100.293
   140    .071    .066    .065    .068    .063  72.080    .054    .201    .000    .072  27.803 100.544
   141    .077    .078    .076    .078    .095  72.080    .054    .201    .000    .072  27.803 100.614
   142    .020    .010    .014    .021    .016  72.080    .054    .201    .000    .072  27.803 100.292
   143    .027    .016    .026    .021    .013  72.080    .054    .201    .000    .072  27.803 100.314
   144    .015    .016    .024    .005    .022  72.080    .054    .201    .000    .072  27.803 100.293

AVER:     .038    .030    .036    .033    .037  72.080    .054    .201    .000    .072  27.803 100.384
SDEV:     .024    .027    .022    .026    .032    .000    .000    .000    .000    .000    .000    .127

For now we will just focus on the variances since that is the best indication of data precision and consider accuracy later (I don't have an Fe3O4 blank standard sample in the lab- yet!). In rede above we can see the standard deviations for Ti off-peak measurements and below the same data but calculated for MAN backgrounds instead:

ELEM:       Ti      Ti      Ti      Ti      Ti      Fe      Mn      Al      Si      Mg       O   SUM 
XRAY:     (ka)    (ka)    (ka)    (ka)    (ka)      ()      ()      ()      ()      ()      ()
   137    .027    .020    .024    .020    .009  72.080    .054    .201    .000    .072  27.803 100.310
   138    .032    .031    .033    .032    .050  72.080    .054    .201    .000    .072  27.803 100.388
   139    .015    .018    .020    .016    .013  72.080    .054    .201    .000    .072  27.803 100.291
   140    .066    .069    .062    .066    .065  72.080    .054    .201    .000    .072  27.803 100.538
   141    .075    .080    .075    .073    .078  72.080    .054    .201    .000    .072  27.803 100.591
   142    .015    .016    .015    .020    .017  72.080    .054    .201    .000    .072  27.803 100.293
   143    .025    .019    .025    .018    .011  72.080    .054    .201    .000    .072  27.803 100.309
   144    .015    .020    .023    .011    .021  72.080    .054    .201    .000    .072  27.803 100.300

AVER:     .034    .034    .035    .032    .033  72.080    .054    .201    .000    .072  27.803 100.377
SDEV:     .024    .026    .022    .024    .027    .000    .000    .000    .000    .000    .000    .120

As one can see the MAN background corrected Ti concentration variances are similar or smaller than the off-peak calculated concentrations. We will investigate how to calculate the sensitivity in the MAN Precision and Accuracy topic later, but now let's look at the Mn Ka data. It is worth noting however that off-peak measurements for Mn in magnetite are interfered with by the tail of the Fe Ka peak since it is so large, therefore we must utilize same side off-peaks or another method that avoids the tail of the Fe peak on the low side of the Mn ka position, as seen here:


And here for Mn Ka using off-peak backgrounds:

ELEM:       Mn      Mn      Mn      Mn      Mn      Fe      Al      Si      Ti      Mg       O   SUM 
XRAY:     (ka)    (ka)    (ka)    (ka)    (ka)      ()      ()      ()      ()      ()      ()
   129    .038    .061    .028   -.001    .045  72.080    .201    .000    .012    .072  27.803 100.339
   130    .104    .073    .056    .052    .069  72.080    .201    .000    .012    .072  27.803 100.521
   131    .063    .049    .038    .024    .011  72.080    .201    .000    .012    .072  27.803 100.353
   132    .076    .050    .057    .023    .079  72.080    .201    .000    .012    .072  27.803 100.452
   133    .051    .063    .054    .029    .040  72.080    .201    .000    .012    .072  27.803 100.404
   134    .048    .036    .033    .013    .048  72.080    .201    .000    .012    .072  27.803 100.346
   135    .039    .053    .035    .048    .022  72.080    .201    .000    .012    .072  27.803 100.365
   136    .058    .048    .026    .050    .034  72.080    .201    .000    .012    .072  27.803 100.383

AVER:     .060    .054    .041    .030    .043  72.080    .201    .000    .012    .072  27.803 100.395
SDEV:     .022    .011    .013    .019    .022    .000    .000    .000    .000    .000    .000    .063

and the same raw data calculated using MAN backgrounds:

ELEM:       Mn      Mn      Mn      Mn      Mn      Fe      Al      Si      Ti      Mg       O   SUM 
XRAY:     (ka)    (ka)    (ka)    (ka)    (ka)      ()      ()      ()      ()      ()      ()
   129    .027    .042    .030    .014    .035  72.080    .201    .000    .012    .072  27.803 100.316
   130    .069    .058    .054    .044    .060  72.080    .201    .000    .012    .072  27.803 100.453
   131    .041    .030    .034    .022    .015  72.080    .201    .000    .012    .072  27.803 100.309
   132    .064    .049    .054    .044    .061  72.080    .201    .000    .012    .072  27.803 100.440
   133    .051    .044    .047    .030    .043  72.080    .201    .000    .012    .072  27.803 100.383
   134    .040    .032    .032    .021    .041  72.080    .201    .000    .012    .072  27.803 100.334
   135    .021    .033    .030    .034    .018  72.080    .201    .000    .012    .072  27.803 100.305
   136    .044    .026    .027    .022    .034  72.080    .201    .000    .012    .072  27.803 100.322

AVER:     .045    .039    .039    .029    .038  72.080    .201    .000    .012    .072  27.803 100.358
SDEV:     .017    .011    .011    .011    .017    .000    .000    .000    .000    .000    .000    .060

For Mn, the precision is even better probably partly due to the extrapolated nature of the off-peak calculation necessitated by the Fe Ka tail interference on the low side Mn off-peak position.
John J. Donovan, Pres. 
(541) 343-3400

"Not Absolutely Certain, Yet Reliable"

John Donovan

  • Administrator
  • Emeritus
  • *****
  • Posts: 3304
  • Other duties as assigned...
    • Probe Software
Re: Magnetite Off-peak vs. MAN Precision Example
« Reply #1 on: August 15, 2015, 09:17:11 AM »
And a quick mention concerning accuracy.  You may have noticed above that while the off-peak and MAN background corrected data concentrations for Ti look very similar, there was a greater difference between the concentrations reported for Mn comparing the off-peak and MAN background corrections.  In fact the Mn Ka MAN concentrations are consistently lower. Now why would that be? 

Let's first look at an MAN background regression plot first for Ti ka and observe that it looks fine:


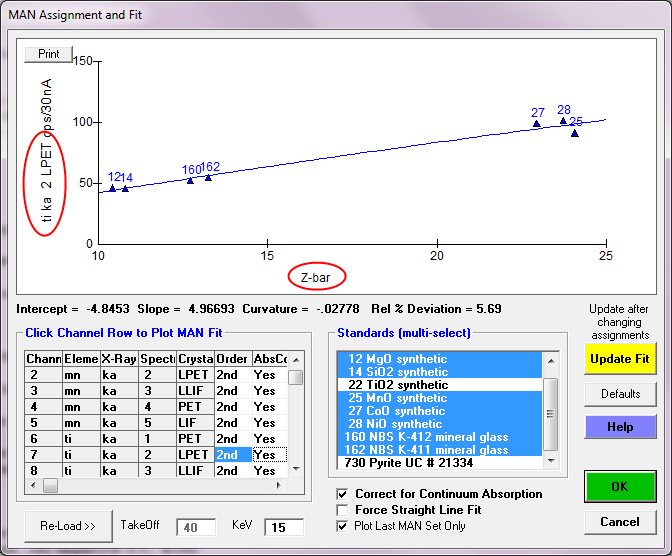
Note that the average Z of magnetite is around Z-bar = 21 or so. Now the Mn MAN regression fit that was utilized in the above post:


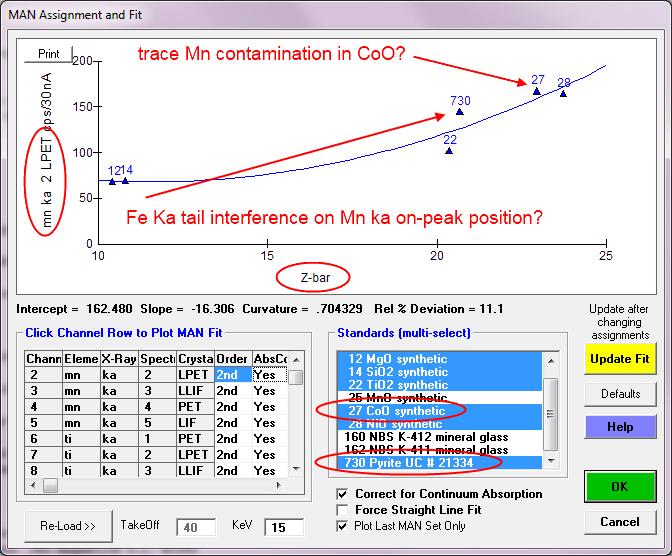
It is clear that standards 27 (CoO) and 730 (FeS2 or pyrite) fall *above* the main line of the regression curve.  This may be due to some trace Fe contamination in the CoO crystal and the Fe Ka tail in the FeS2 interfering now not only with the Mn Ka low off-peak position, but in this case even with the Mn Ka on-peak position! 

In the off-peak situation we were able to deal with this off-peak and on-peak interferences by utilizing "same side" off-peak positions, but for the MAN regression we must simply avoid the on-peak interference by removing the CoO and FeS2 standards from the fit as seen here:


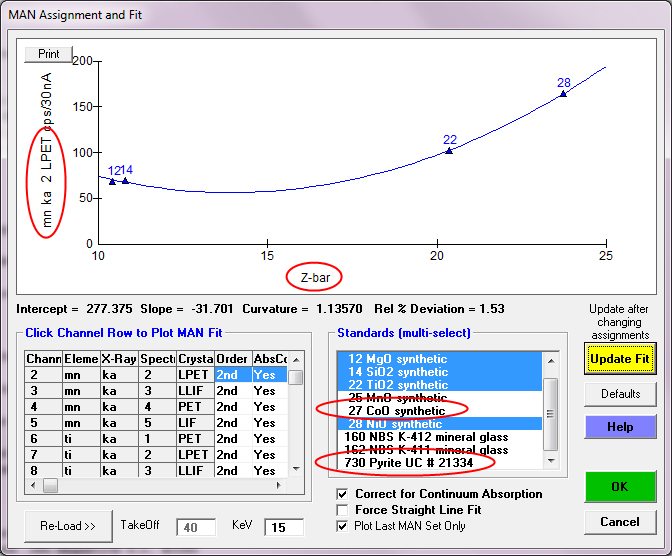
Removing these problematic standards we move the MAN regression fit to a lower intercept. Remember, background is the lowest intensity we can measure generally, so by removing the standards with the highest positive variances above the regression trend, we will improve the *accuracy* of the MAN background correction for Mn Ka. Also note that the variances of the Mn concentrations remain *exactly* the same!

So here, as a reminder, are the Mn MAN background corrected concentrations as calculated with CoO and FeS2 in the MAN regression fit:

ELEM:       Mn      Mn      Mn      Mn      Mn      Fe      Al      Si      Ti      Mg       O   SUM
XRAY:     (ka)    (ka)    (ka)    (ka)    (ka)      ()      ()      ()      ()      ()      ()
   129    .027    .042    .030    .014    .035  72.080    .201    .000    .012    .072  27.803 100.316
   130    .069    .058    .054    .044    .060  72.080    .201    .000    .012    .072  27.803 100.453
   131    .041    .030    .034    .022    .015  72.080    .201    .000    .012    .072  27.803 100.309
   132    .064    .049    .054    .044    .061  72.080    .201    .000    .012    .072  27.803 100.440
   133    .051    .044    .047    .030    .043  72.080    .201    .000    .012    .072  27.803 100.383
   134    .040    .032    .032    .021    .041  72.080    .201    .000    .012    .072  27.803 100.334
   135    .021    .033    .030    .034    .018  72.080    .201    .000    .012    .072  27.803 100.305
   136    .044    .026    .027    .022    .034  72.080    .201    .000    .012    .072  27.803 100.322

AVER:     .045    .039    .039    .029    .038  72.080    .201    .000    .012    .072  27.803 100.358
SDEV:     .017    .011    .011    .011    .017    .000    .000    .000    .000    .000    .000    .060


And here are the Mn MAN concentrations again, but this time with the CoO and FeS2 (pyrite) standards removed from the MAN fit:

ELEM:       Mn      Mn      Mn      Mn      Mn      Fe      Al      Si      Ti      Mg       O   SUM 
XRAY:     (ka)    (ka)    (ka)    (ka)    (ka)      ()      ()      ()      ()      ()      ()
   129    .044    .054    .041    .026    .045  72.080    .201    .000    .012    .072  27.803 100.377
   130    .086    .070    .064    .057    .070  72.080    .201    .000    .012    .072  27.803 100.515
   131    .057    .042    .044    .034    .025  72.080    .201    .000    .012    .072  27.803 100.371
   132    .081    .061    .064    .056    .071  72.080    .201    .000    .012    .072  27.803 100.501
   133    .067    .056    .058    .042    .053  72.080    .201    .000    .012    .072  27.803 100.444
   134    .056    .044    .042    .033    .051  72.080    .201    .000    .012    .072  27.803 100.395
   135    .037    .045    .041    .047    .029  72.080    .201    .000    .012    .072  27.803 100.367
   136    .061    .038    .038    .035    .045  72.080    .201    .000    .012    .072  27.803 100.384

AVER:     .061    .051    .049    .041    .049  72.080    .201    .000    .012    .072  27.803 100.419
SDEV:     .017    .011    .011    .011    .017    .000    .000    .000    .000    .000    .000    .060

Remember the lowest intensities on can measure, must be the background- by definition!

Now these Mn MAN background corrected concentrations seem to agree much closer to the off-peak corrected concentrations shown here again for comparison:

ELEM:       Mn      Mn      Mn      Mn      Mn      Fe      Al      Si      Ti      Mg       O   SUM
XRAY:     (ka)    (ka)    (ka)    (ka)    (ka)      ()      ()      ()      ()      ()      ()
   129    .038    .061    .028   -.001    .045  72.080    .201    .000    .012    .072  27.803 100.339
   130    .104    .073    .056    .052    .069  72.080    .201    .000    .012    .072  27.803 100.521
   131    .063    .049    .038    .024    .011  72.080    .201    .000    .012    .072  27.803 100.353
   132    .076    .050    .057    .023    .079  72.080    .201    .000    .012    .072  27.803 100.452
   133    .051    .063    .054    .029    .040  72.080    .201    .000    .012    .072  27.803 100.404
   134    .048    .036    .033    .013    .048  72.080    .201    .000    .012    .072  27.803 100.346
   135    .039    .053    .035    .048    .022  72.080    .201    .000    .012    .072  27.803 100.365
   136    .058    .048    .026    .050    .034  72.080    .201    .000    .012    .072  27.803 100.383

AVER:     .060    .054    .041    .030    .043  72.080    .201    .000    .012    .072  27.803 100.395
SDEV:     .022    .011    .013    .019    .022    .000    .000    .000    .000    .000    .000    .063

But we won't know for sure which background correction method is more accurate, until we have a pure Fe3O4 standard to utilize as a "blank"!
« Last Edit: August 15, 2015, 01:14:22 PM by John Donovan »
John J. Donovan, Pres. 
(541) 343-3400

"Not Absolutely Certain, Yet Reliable"