If one needs an accurate model of the interaction volume for a measurement, Monte-carlo is the way to go, though it takes some time for reasonable precision certainly. But for the purposes of roughly (or relatively) modeling the interaction volume, the basic analytical expressions from Kanaya-Okayama work well enough.
This electron and x-ray range window is accessed from the Run | Calculate Electron And X-ray Ranges menu in CalcZAF.Let start by modeling a Ni-Fe NIST alloy (density = 8.2) using a 10 keV electron beam as seen here:

Note first the NiFe alloy at density 8.2 (important for calculating linear distances), then note that although the 99% electron range is ~0.48 um, the Fe Ka production radius is less than half that (~0.21 um). This is because as the incident electrons lose energy and fall below the excitation energy for Fe Ka production (edge energy = 7.11 kV), they can no longer create Fe Ka emissions.
Finally note that the transmission efficiency for Fe Ka at the 0.21 um depth is over 98%, so there is little or no matrix absorption here.
What about other x-ray lines? Well replacing Fe Ka by Si ka we can see that although Si Ka x-rays are produced almost to the 99% electron range (0.45 um) in this matrix, the transmission efficiency of Si ka from that depth is significantly less, around 38% as seen here:
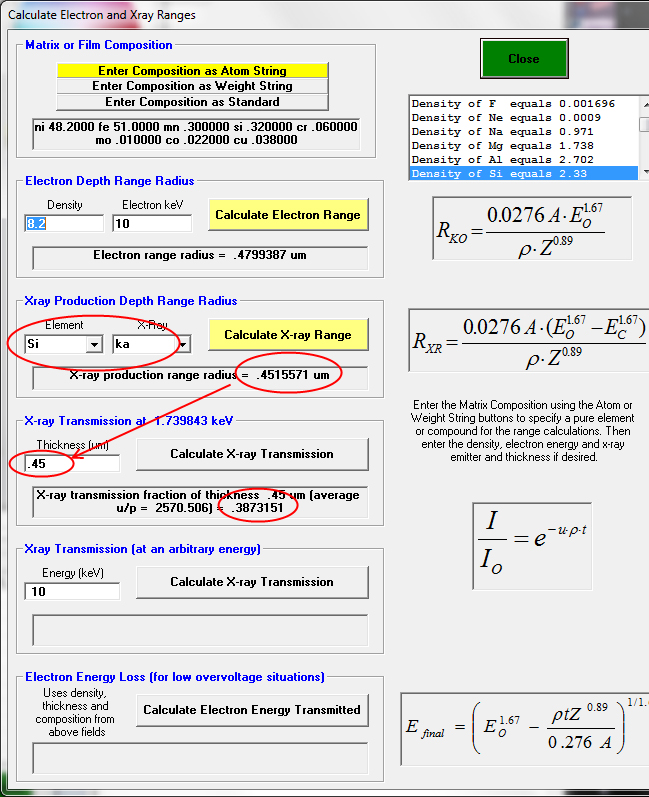
That means that Si measurements are more "surface specific" than the Fe Ka measurements. For lower x-ray energies (e.g., O Ka), these measurements become even more "surface specific".
But at least for Fe and Ni Ka we can obtain sub micron spatial resolution by using K lines at moderate overvoltages (~ 10 keV for Fe and Ni K lines).
What about low voltage analysis, say 5 keV? Well we won't be able to use the Fe and Ni K lines anymore and in fact we might decide to use the La or Lb emission lines. However, due to significant self-absorption and chemical state effects on these emission lines, we might find that we're better off using low overvoltage measurements using K lines as described already.
But, nevertheless, here is a quick calculation for this matrix at 5 keV:
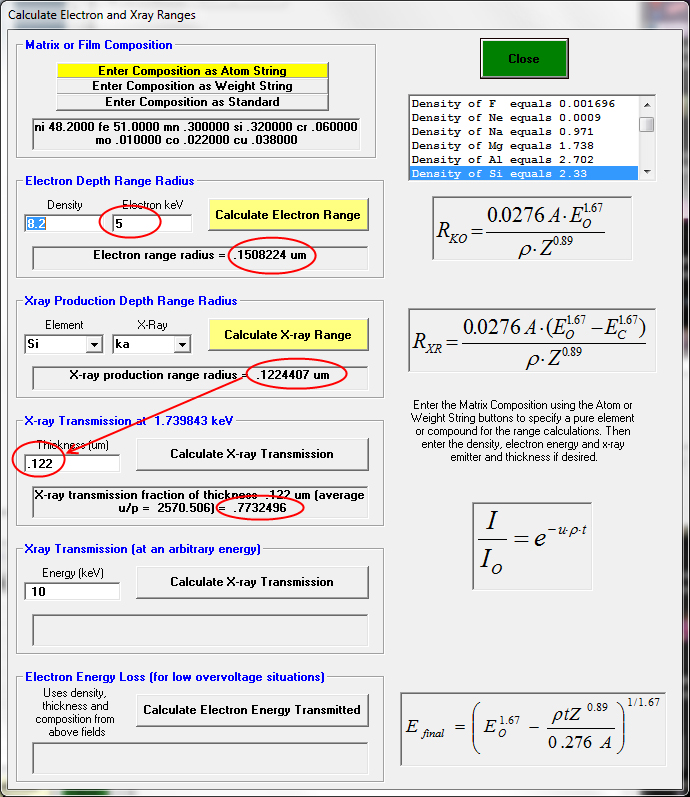
The 99% electron radius is *only* 150 nm, and the Si Ka transmission efficiency at it's 99% production depth is over 77%.
For Fe La the 99% production depth and transmission efficiency will be around the same (145 nm and 74%) as seen here:
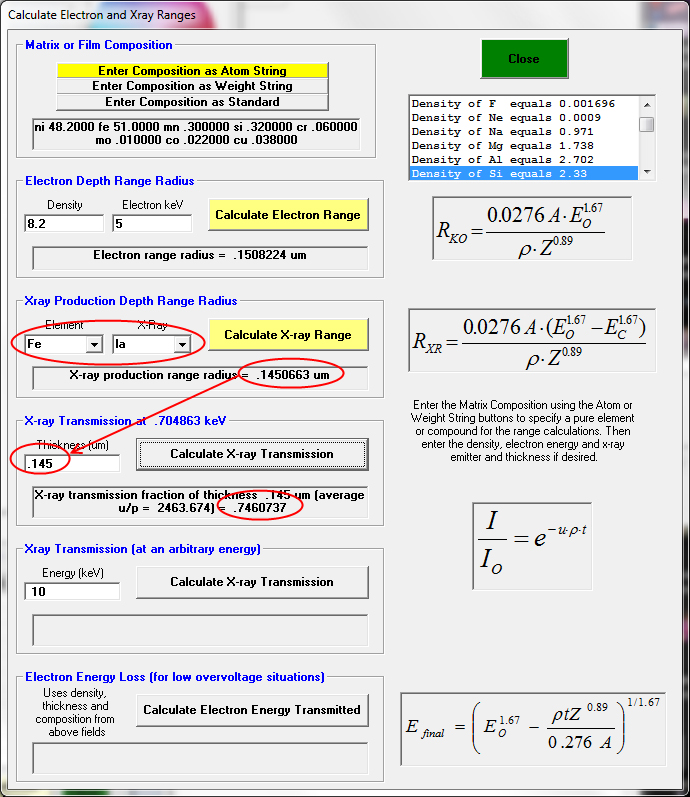
These calculations especially at low voltages will be more accurate using Monte-Carlo modeling, but they provide some practical guidelines.
My suggestion is that we need to improve the physics of transition metal La/Lb series for quantitative analysis. Since there is no practical way to include chemical effects in Monte-Carlo simulations (pers. comm. Salvat), we are left with empirical analytical approaches, e.g., Area Peak Factors (APFs).


 We are a community of analysts, that cares about EPMA