Here's an example I did from earlier this year in getting ready for my light element talk this summer at M&M.
Here are some simple oxides (averages from two sets of measurements) in my standard mount using MgO (912) as a primary standard for O ka plotting measured concentrations (y axis) versus "published" oxygen concentrations (x axis) in these oxides (assuming single crystal stoichiometry). First without using empirical MACs and APFs and plotted as a 1:1 plot in concentration units:
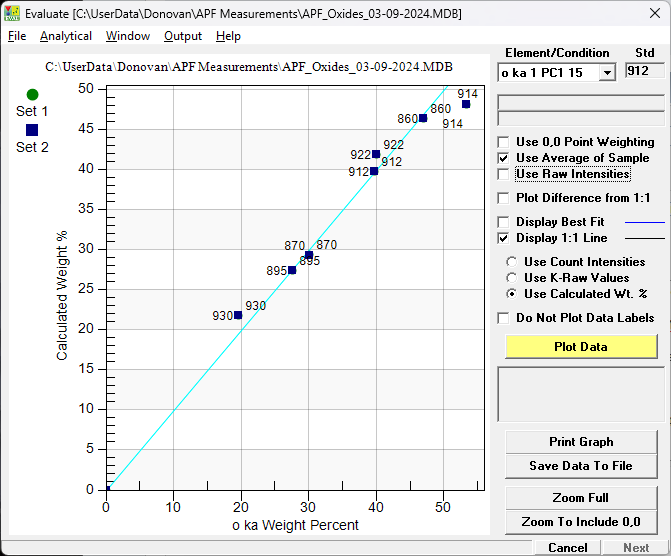
Note that the 1:1 line intersects MgO which is the primary standard. And again but this time plotting the concentration differences to the 1:1 line normalized to the highest concentration standard (SiO2):
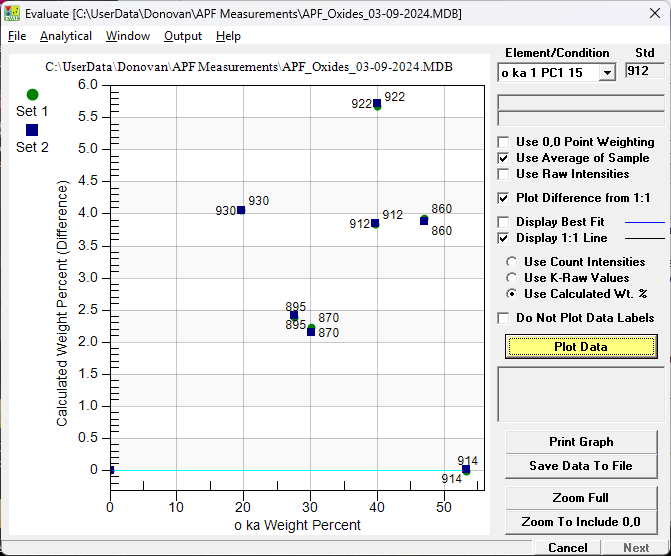
Note that TiO2 (922) is the largest outlier as the absorption of oxygen Ka by Ti is very large and nominal table values are not accurate. And plotting once again, but this time using empirical determined MACs and APFs from Bastin and Pouchou:

The empirical MACs helped a lot particularly for TiO2. The only big outlier is ZnO (930) and maybe it's not exactly stoichiometric? The others are all within +/- 2% relative or so. The oxide standard numbers are:
860 Set 1 Al2O3 + 0.40 Cr single crystal (#260)
870 Hematite Sennin (#370)
895 Magnetite (std #395)
912 MgO (elemental) (#12)
914 SiO2 (elemental) (#14)
922 TiO2 (elemental) (#22)
930 ZnO (elemental) (#30)


 If you can't see some "in-line" images in a post, try "refreshing" your browser!