Since we had some difficulty attempting to measure our F Ka k-ratios on TAP crystals, I decided to look at all 5 PET crystals on my instrument, using both Si Ka for high sin thetas and Ti ka for lower sin thetas.
As you may remember from previous posts this was a typical trend that we saw for Si Ka on both TAP and PET crystals:
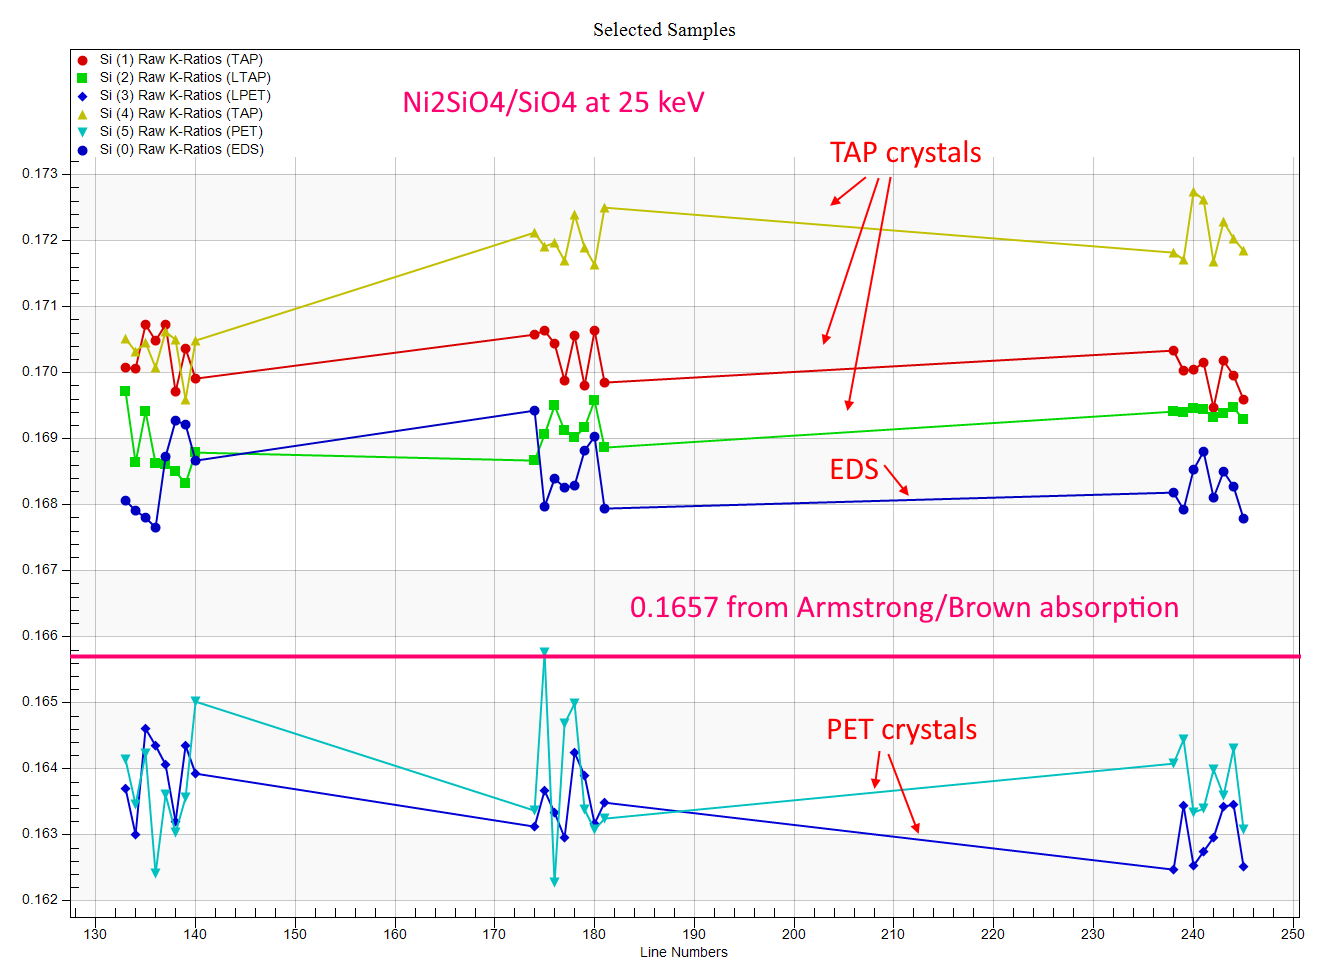
What we saw above was that for Si ka on PET (high sin thetas) we observed k-ratios falling below the expected k-ratio models (and the EDS k-ratios), while for Si Ka on TAP (at low sin thetas) we saw k-ratios that were above the predicted k-ratios (and the EDS k-ratios). But will these trends hold up for all PET crystals?
This time we tuned up Si Ka on all 5 PET crystals and EDS, but utilized a different mount than before so I was more limited in what materials I could utilize. Here are Si Ka k-ratios at 25 keV on labradorite and SiO2:
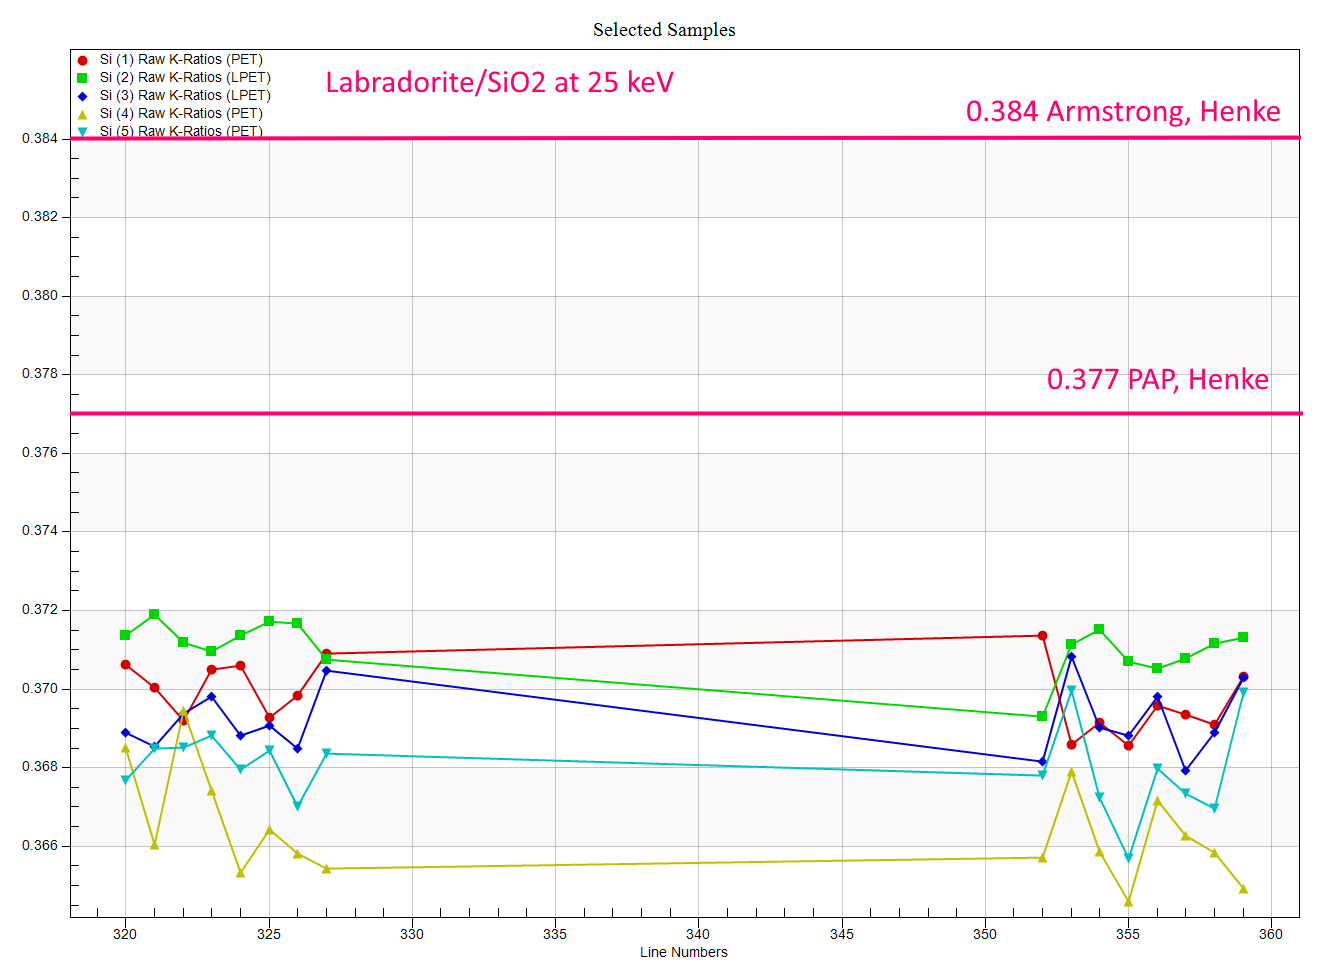
Again we are able to reproduce the seemingly lower k-ratios for Si Ka on these PET crystals.
Unfortunately the EDS spectrometer gave very scattered results, probably due to the difficulty that Nicholas Ritchie mentioned regarding the fitting of the Si absorption edge from the EDS detector material. Steve Seddio is looking at these spectra to see if we can improve the modeling of the continuum to get more consistent results.
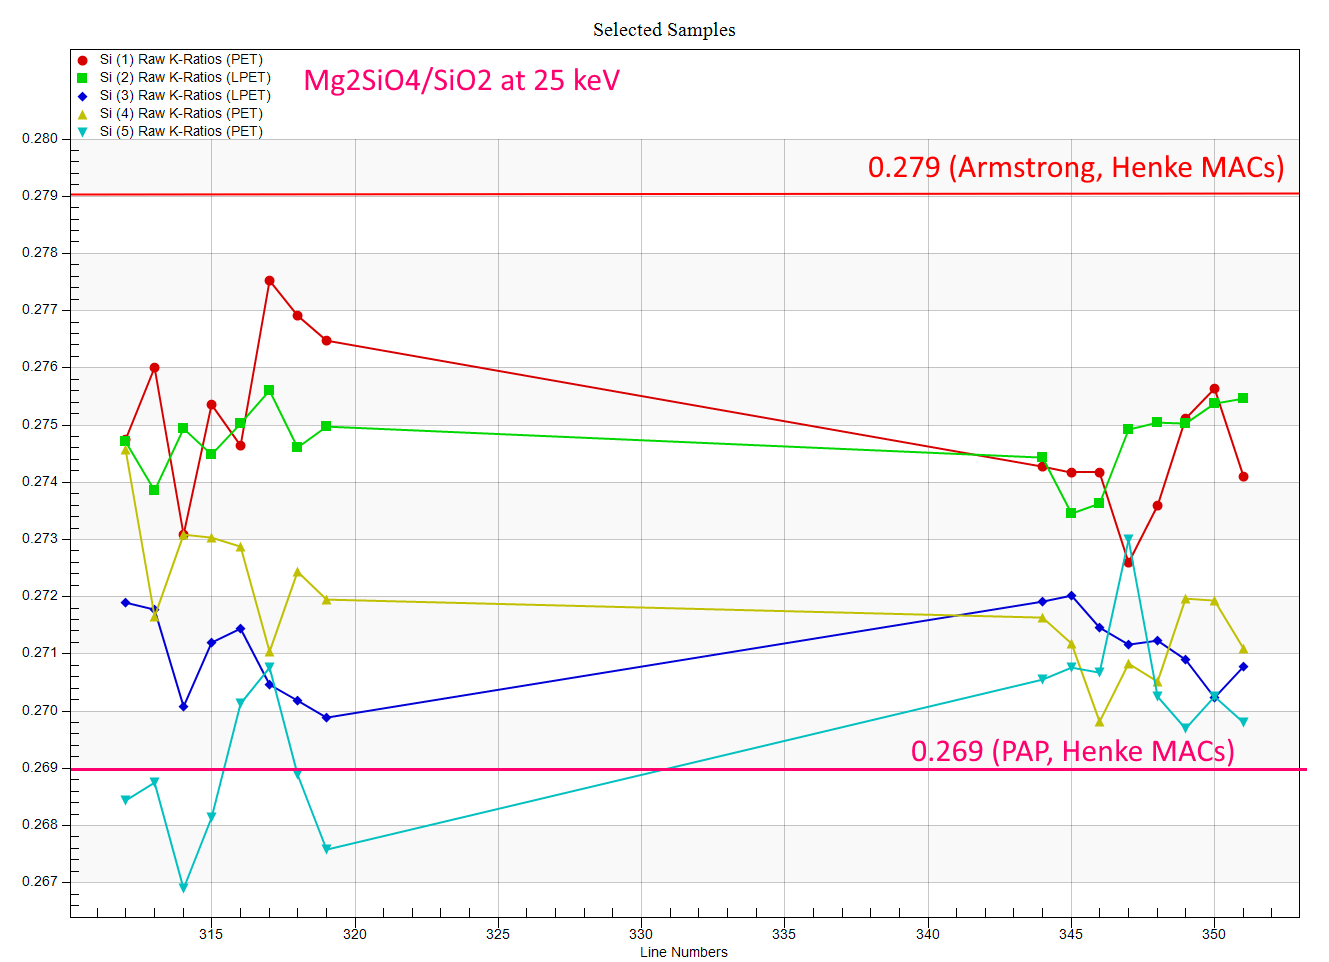
We can also see this more ambiguous data for Mg2SiO4:
And for the other silicate I measured, PbSiO3, the models are very spread out, though here the EDS data was quite consistent (which makes me wonder if the issue with Si is more related to the Mg and Al peaks in the other materials), so it is included in this plot:
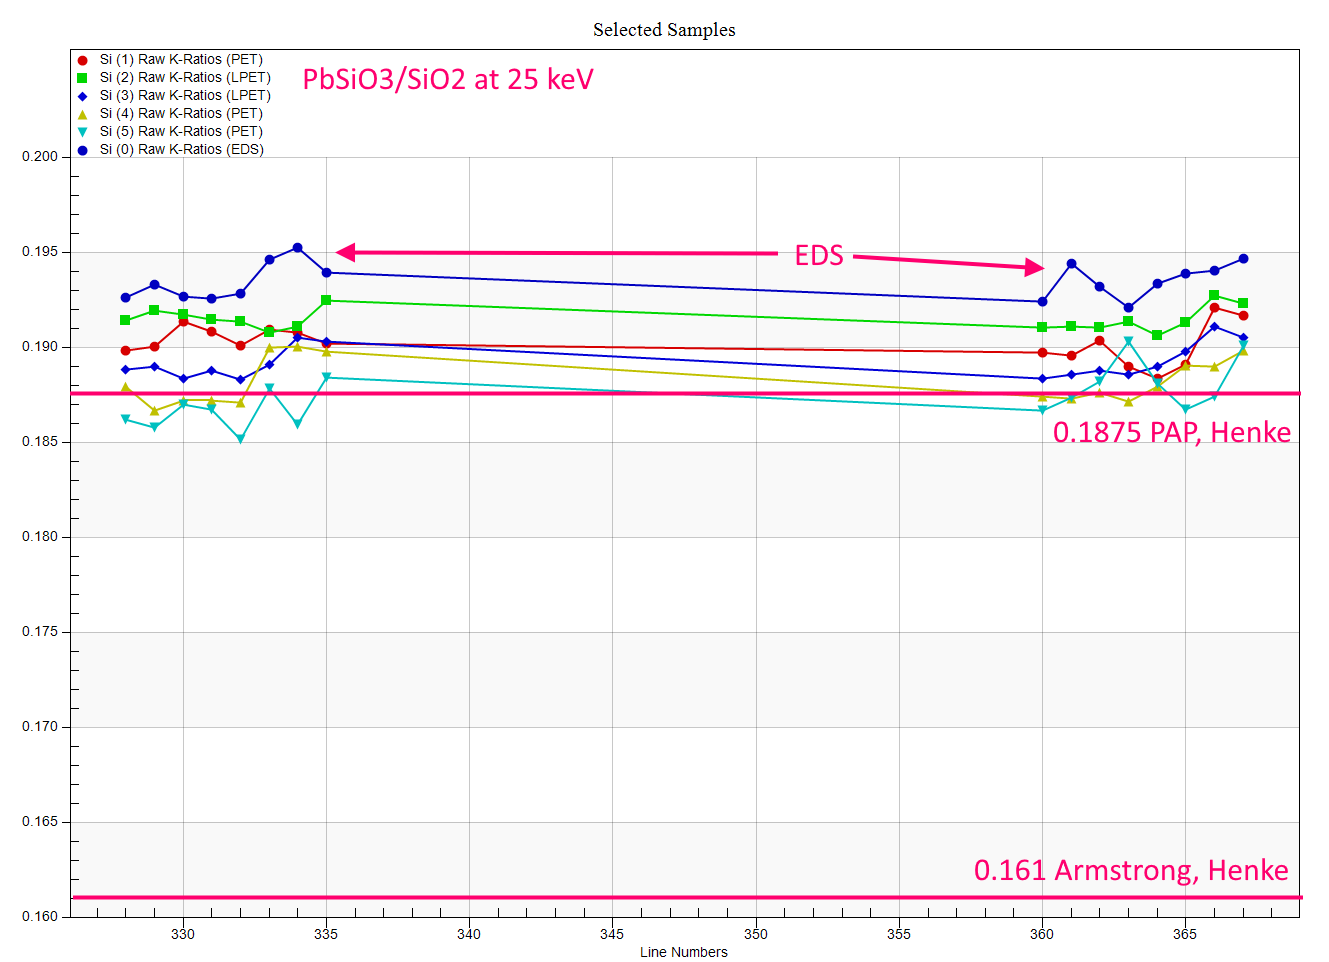
And if we do trust the EDS k-ratio data to be more representative of a 40 degrees take off angle, then again we see all 5 PET crystals yielding k-ratios lower then we should expect. As for not using Si Ka, it would be nice to use another emission line at a high sin theta on PET but that leaves us with Ka emissions from P, S, Cl and Ar for which stable materials are not so readily available... maybe I will try GaP and InP next time...
Next we'll look at Ti Ka on all 5 PET crystals.


 We depend on your feedback and ideas!