Author Topic: Classify feature, K-means clustering for phase identification  (Read 7122 times)

John Donovan

  • Administrator
  • Emeritus
  • *****
  • Posts: 3304
  • Other duties as assigned...
    • Probe Software
I just realized that we've never created a dedicated topic for discussing phase extraction calculations in CalcImage.  This feature is accessed from the Image Processing | Classify Image menu in CalcImage as seen here:


This phase classification utilizes a modified k-means clustering method which allows the user to specify the number of phases to detect and also a precision parameter (Iteration Tolerance) to trade off calculation speed for sensitivity in the detection of discrete phases. Here is an example of using 8 phases and an iteration tolerance of 0.1 (%):


I know that several users already take advantage of this feature, but feel free to comment or ask questions about this method.
« Last Edit: April 13, 2020, 07:14:01 PM by John Donovan »
John J. Donovan, Pres. 
(541) 343-3400

"Not Absolutely Certain, Yet Reliable"

Probeman

  • Emeritus
  • *****
  • Posts: 2856
  • Never sleeps...
    • John Donovan
Re: Classify feature, K-means clustering for phase identification
« Reply #1 on: April 26, 2018, 12:57:24 PM »
It should be added that these phase extractions can be performed not only on the elemental concentrations, but also on any data type output from CalcImage, which would include not only net intensities and k-ratios, but also oxide concentrations, atomic percents, formula basis, etc.

I don't know how different the phase results will be by utilizing different data types for classification, but I do know they will be somewhat different.
« Last Edit: April 26, 2018, 03:26:35 PM by Probeman »
The only stupid question is the one not asked!

John Donovan

  • Administrator
  • Emeritus
  • *****
  • Posts: 3304
  • Other duties as assigned...
    • Probe Software
Re: Classify feature, K-means clustering for phase identification
« Reply #2 on: April 26, 2018, 01:00:32 PM »
And here is a k-means calculation on the same data as in the first post, but this time using 12 phases (which is probably a bit overkill):

« Last Edit: April 13, 2020, 08:55:27 AM by John Donovan »
John J. Donovan, Pres. 
(541) 343-3400

"Not Absolutely Certain, Yet Reliable"

John Donovan

  • Administrator
  • Emeritus
  • *****
  • Posts: 3304
  • Other duties as assigned...
    • Probe Software
Re: Classify feature, K-means clustering for phase identification
« Reply #3 on: April 28, 2018, 03:01:53 PM »
And here is a k-means phase classification with 10 phases which looks reasonable:


Then just for fun I ran the modal analysis feature in CalcImage (from the Image Processing | Calculate Modal Abundances menu) and after matching to the (default) DHZ mineral database, we get the following results:


When we click the Calculate Modal Parameters button we get this output from Surfer:


I just noticed that the above image looks a little funny, and the reason is because the default for Surfer (v. 13 and higher)  now is to have "hill shading" turned on, so I will fix that in the script, but in the meantime we simply uncheck this box and it looks more like *microanalysis*:


But in any case clearly the DHZ database is limited to rock forming minerals, so we'd probably want to utilize a more complete match database such as the the AMCSD.MDB mineral database which contains over 4000 (ideal) minerals. 

Anyway, just a quick review so you all know what is available already in CalcImage.  More details can be found by searching the CalcImage board.
« Last Edit: April 12, 2020, 10:04:01 PM by John Donovan »
John J. Donovan, Pres. 
(541) 343-3400

"Not Absolutely Certain, Yet Reliable"

John Donovan

  • Administrator
  • Emeritus
  • *****
  • Posts: 3304
  • Other duties as assigned...
    • Probe Software
Re: Classify feature, K-means clustering for phase identification
« Reply #4 on: April 16, 2019, 10:16:35 PM »
We made a small change to the Classify window in CalcImage to improve how images are handled when the current instrument configuration (JEOL vs. Cameca) loads a classify .DAT file which is from the "other" instrument.


For example, when installing Probe for EPMA on an off-line computer the default instrument configuration is JEOL. If one then opens a CalcImage classify .DAT file acquired on a Cameca instrument, this new code will now handle this situation properly.

Of course one can also simply use the File | Use JEOL Simulation Mode or File | Use Cameca Simulation Mode menus in Probe for EPMA to switch instrument configurations.

https://probesoftware.com/smf/index.php?topic=837.msg5978#msg5978

Also one can export their current instrument configuration from any recently acquired MDB file as described here:

https://probesoftware.com/smf/index.php?topic=76.msg2196#msg2196

In any case, the new Classify display code should handle all situations properly. Ready to update now.
« Last Edit: April 17, 2019, 08:36:05 AM by John Donovan »
John J. Donovan, Pres. 
(541) 343-3400

"Not Absolutely Certain, Yet Reliable"

Probeman

  • Emeritus
  • *****
  • Posts: 2856
  • Never sleeps...
    • John Donovan
Re: Classify feature, K-means clustering for phase identification
« Reply #5 on: May 22, 2019, 10:31:03 AM »
OK, I have a question for you math experts.  Because, Lord knows, math is not my strongest suit!

One of the neat things about the K-means clustering method in CalcImage is that one can choose to cluster a set x-ray maps based on any of the data types calculated during the map quantification.  These data types of course always includes elemental (default quant), but the user can also perform cluster calculations on other data types for example, atomic, oxide, formula basis, net intensities, k-ratios, etc, etc.

I previously noticed when performing the k-means clustering calculation, that depending on the actual data type selected, the clustering process can produce somewhat different results. Now I am not surprised by this, because of course the input data is different for each data type, so why wouldn't the clustering results be different?  But I am curious as to the precise mathematical effects involved.

For example here is a map of a Mg-Gd-Al-Sn alloy with the k-means clustering based on atomic percents:
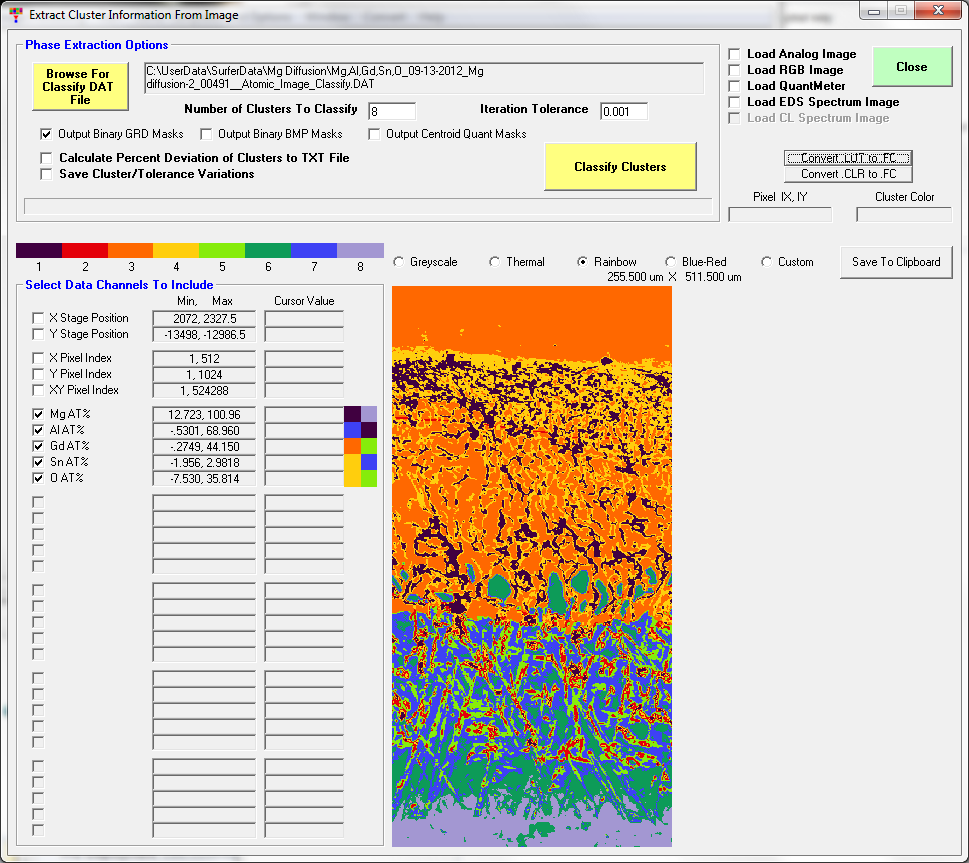


and here is the same map, but with the k-means clustering based on elemental wt percents:


Both clustering calculations were based on 8 phases and an iteration tolerance of 0.001 percent. Now, ignore the fact that the phases in the two results have different colors. The colors chosen for each phase are simply a result of the order in which each phase was identified in the clustering iteration process (which in itself tells you something is different mathematically).  But also note that especially near the lower part of the sample, there is quite a bit of difference in the pixels assigned to the 8 phases.

Can someone please give us all a short explanation of what exactly is going on here?  I send the atomic and elemental map data as tab delimited files to you if anyone is interested, but they are too big to upload as attachments.
« Last Edit: May 22, 2019, 10:36:26 AM by Probeman »
The only stupid question is the one not asked!

JonF

  • Professor
  • ****
  • Posts: 155
Re: Classify feature, K-means clustering for phase identification
« Reply #6 on: May 22, 2019, 11:52:26 AM »
Quote
The colors chosen for each phase are simply a result of the order in which each phase was identified in the clustering iteration process (which in itself tells you something is different mathematically).

Without knowing the details of how the k-means clustering algorithm in CalcImage is implemented (a very nice feature, btw!), I was under the impression that the initial centroid positions are randomly distributed in multidimensional space (the dimensions being the elements). This would then mean that the colours assigned to each centroid/phase are random - to test this, what happens when you run the classification on the same dataset under the same conditions multiple times?

This would then have a knock on effect on what pixels are incorporated within each phase (as they may not reach the same position twice!).

Probeman

  • Emeritus
  • *****
  • Posts: 2856
  • Never sleeps...
    • John Donovan
Re: Classify feature, K-means clustering for phase identification
« Reply #7 on: May 22, 2019, 12:23:47 PM »
Hi Jon,
I think the results are exactly the same each time this particular k-means classification is run on a particular input (though it's easy enough to check), but maybe that's only because there's no random "seed" that is varied. At least from the calling code.  It's a DLL call so I'm not sure exactly what's going on inside, which is why I asked above.

But I'm glad you chimed in because your comment made me remember that the author (Kardi Teknomo) did write me up a short description of what he did and that is here:


So I guess I answered my own question to some degree!

By the way, I'm glad you like this k-means clustering feature in CalcImage. I haven't gotten much feedback from people, except Gareth Hatton who was the guy who prompted us to develop this clustering method.

I know some people like to "roll their own", for example Paul Carpenter likes to try all sorts of different clustering methods using different libraries, and I'm sure they all give slightly different results based on their methods, but I was just curious what it means to have the same composition classified differently depending on the data type.

I guess I am mostly just thinking out loud here, and not in a very organized fashion. What I'm getting at I guess is that (for example) it seems that whether one classifies using elemental wt% or oxide wt%, one could get different results, but probably it's only an issue when one has solid solutions or zoning where the compositional changes are gradual.

But as I said, math hurts my brain, but it's fun!
« Last Edit: May 22, 2019, 05:37:09 PM by Probeman »
The only stupid question is the one not asked!

JonF

  • Professor
  • ****
  • Posts: 155
Re: Classify feature, K-means clustering for phase identification
« Reply #8 on: May 23, 2019, 11:07:02 AM »
Thinking some more about this (on the train again!), could this also be a symptom of overestimating the number of clusters/centroids? It would be good to do hierarchical clustering of the data set to see how many phases we can realistically tell apart (above noise) - do you have the compositions of the individual phases? I'm thinking that the effect of normalising pixel data with a large error to get the at% could push a pixel in to a different phase, especially if we're telling the algorithm to shoe horn the data in to more clusters than actually exist.

I wouldn't mind a copy of the data to play with, if you wouldn't mind sending it.

Probeman

  • Emeritus
  • *****
  • Posts: 2856
  • Never sleeps...
    • John Donovan
Re: Classify feature, K-means clustering for phase identification
« Reply #9 on: November 04, 2019, 01:10:08 PM »
Has anyone written a script or app to take the elemental maps from a Thermo NSS/pathfinder spectrum image and save it to the "classify" .DAT format used in CalcImage for phase extraction?

The classify .DAT format is a tab delimited ASCII (text) file with the following format shown here opened in Excel:


Where, the first line specifies the number of X pixels, the number of Y pixels. the total number pixels and the number of columns in the classify .DAT file.

and the first six columns specify:

"NK"   is the phase or cluster number (zero when unclassified)
"X"    is the X stage coordinate
"Y"    is the Y stage coordinate
"NX"   is the X pixel sequence number
"NY"   is the Y pixel sequence number
"NXY"  is the XY or pixel sequence number


And the remaining columns are the compositional data. So has anyone created a filter or script to take a Thermo NSS/Pathfinder spectrum image (SI) file and write this file format?
« Last Edit: November 04, 2019, 05:35:51 PM by Probeman »
The only stupid question is the one not asked!

emma_fisi

  • Professor
  • ****
  • Posts: 28
Classification questions
« Reply #10 on: April 16, 2021, 02:11:57 PM »
Re: Classify points from Probe for EPMA Quantification

I am very much a novice at using CalcImage, so apologies in advance if this is a daft question. I have a quantified map, and I go to Classify points (from Probe for EPMA Quantification), choose my Quant_Classify.dat file, and get a matrix of analyses that I can filter based on the analysis total. So far, so good. I can classify my clusters just fine. But when I try to export the data to Excel ("Send Classify Data to Excel"), I see Excel open up but no data is deposited in there - I get a blank spreadsheet. Has anyone else had this issue? Is it an Excel thing, and if so, does anyone know a fix?

Also, if I filter the data by some range in totals (e.g. 97-103 percent), extract that range, and open the .dat file in Grapher, analyses with totals outside of the 97-103 range show crazy values (like 1x10^38). So I can't filter my data, save it as a .dat file, and open it in Excel either.

Any thoughts?
Em

John Donovan

  • Administrator
  • Emeritus
  • *****
  • Posts: 3304
  • Other duties as assigned...
    • Probe Software
Re: Classify feature, K-means clustering for phase identification
« Reply #11 on: April 16, 2021, 03:45:06 PM »
Hi Emma,
I'll have to check on the Excel export, but you can certainly just open the .DAT file in Excel using File | Open.

As for the 10^38 value, that is the blank flag value for Golden Software's Surfer program. All values that are filtered out are set "blanked". That is, flagged as do not use, and are set to this constant:

Global Const BLANKINGVALUE! = 1.70141E+38   ' Surfer blanking grid value

I'm surprised that Golden Software's Grapher software doesn't understand this blanking value, since Grapher is from the same company! But you can just set all these values as zero in Excel I guess.

I wish they had selecting using a 10^-38 value instead because it would be essentially a zero!
« Last Edit: April 16, 2021, 06:11:33 PM by John Donovan »
John J. Donovan, Pres. 
(541) 343-3400

"Not Absolutely Certain, Yet Reliable"

John Donovan

  • Administrator
  • Emeritus
  • *****
  • Posts: 3304
  • Other duties as assigned...
    • Probe Software
Re: Classification questions
« Reply #12 on: April 17, 2021, 12:58:19 PM »
Re: Classify points from Probe for EPMA Quantification

I am very much a novice at using CalcImage, so apologies in advance if this is a daft question. I have a quantified map, and I go to Classify points (from Probe for EPMA Quantification), choose my Quant_Classify.dat file, and get a matrix of analyses that I can filter based on the analysis total. So far, so good. I can classify my clusters just fine. But when I try to export the data to Excel ("Send Classify Data to Excel"), I see Excel open up but no data is deposited in there - I get a blank spreadsheet. Has anyone else had this issue? Is it an Excel thing, and if so, does anyone know a fix?

Also, if I filter the data by some range in totals (e.g. 97-103 percent), extract that range, and open the .dat file in Grapher, analyses with totals outside of the 97-103 range show crazy values (like 1x10^38). So I can't filter my data, save it as a .dat file, and open it in Excel either.

Any thoughts?
Em

Hi Emma,
I tested the Export to Excel feature in the CalcImage Classify Points window (using points exported using the Output | Cluster Classification Format menu in Probe for EPMA), and it seems to export to Excel just fine on my computer.  Note that on my version of Excel it loads three blank sheets when it starts, so the new data goes in "Sheet4".
« Last Edit: April 18, 2021, 01:52:59 PM by John Donovan »
John J. Donovan, Pres. 
(541) 343-3400

"Not Absolutely Certain, Yet Reliable"

emma_fisi

  • Professor
  • ****
  • Posts: 28
Re: Classify feature, K-means clustering for phase identification
« Reply #13 on: April 20, 2021, 12:16:38 PM »
Hi John,

Thanks for checking this. Our export to Excel is giving us just two blank worksheets - I'll check to see if that's some setting in our version of Excel (maybe there's some way to have it open four spreadsheets, and that will give us the data!)

Cheers,
Em

John Donovan

  • Administrator
  • Emeritus
  • *****
  • Posts: 3304
  • Other duties as assigned...
    • Probe Software
Re: Classify feature, K-means clustering for phase identification
« Reply #14 on: April 20, 2021, 01:18:54 PM »
Very strange. This is what I see:


Do the export to Excel buttons/menus work in Probe for EPMA?
john
John J. Donovan, Pres. 
(541) 343-3400

"Not Absolutely Certain, Yet Reliable"