Author Topic: Variation (Correlation) Plotting  (Read 1495 times)

John Donovan

  • Administrator
  • Emeritus
  • *****
  • Posts: 3304
  • Other duties as assigned...
    • Probe Software
Variation (Correlation) Plotting
« on: January 24, 2019, 06:39:07 PM »
In getting ready to implement a variation (correlation) plot method for quantitative x-ray maps in CalcImage, we decided to move the variation plot method in Evaluate over to Probe for EPMA and tweak it a bit. The idea being that in PFE it will plot quant points, and in CalcImage it will plot quant pixels.

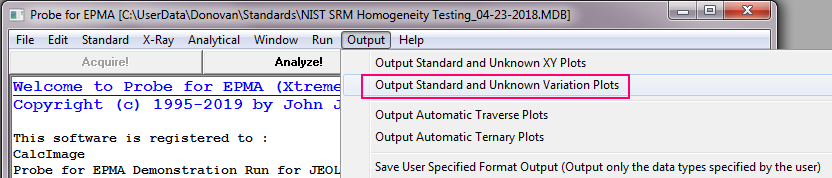
The new menu in Probe for EPMA is here under the Output menu:


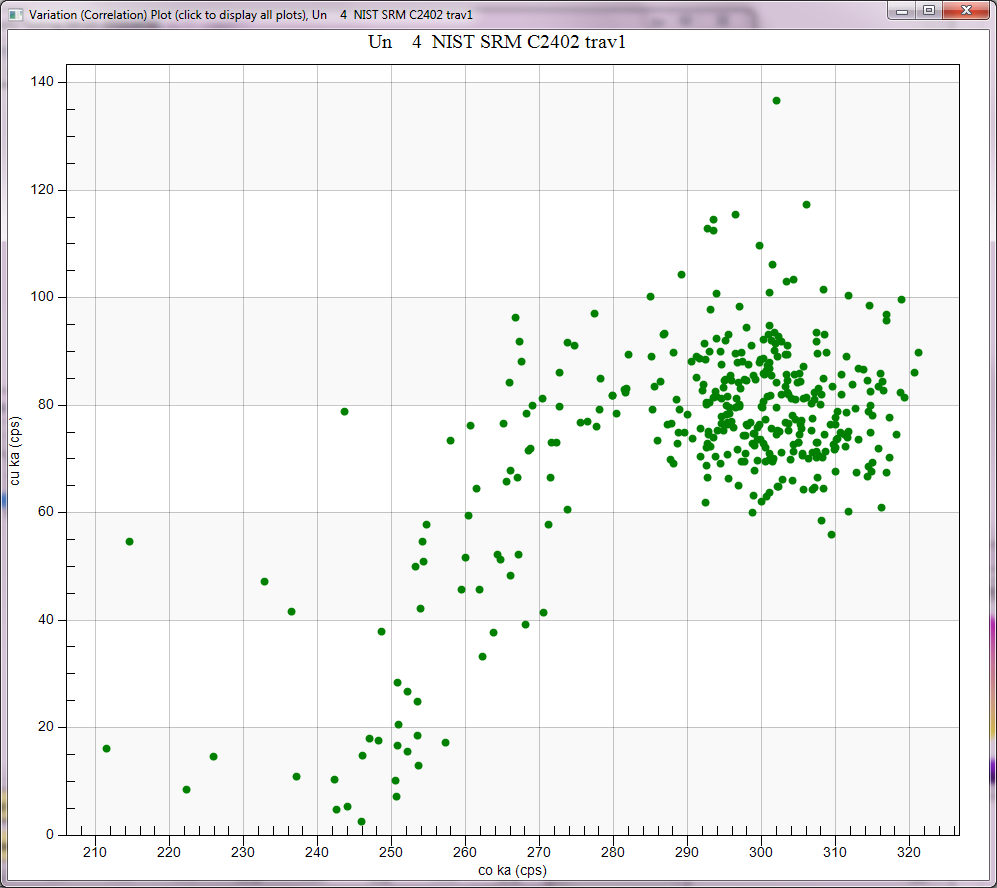
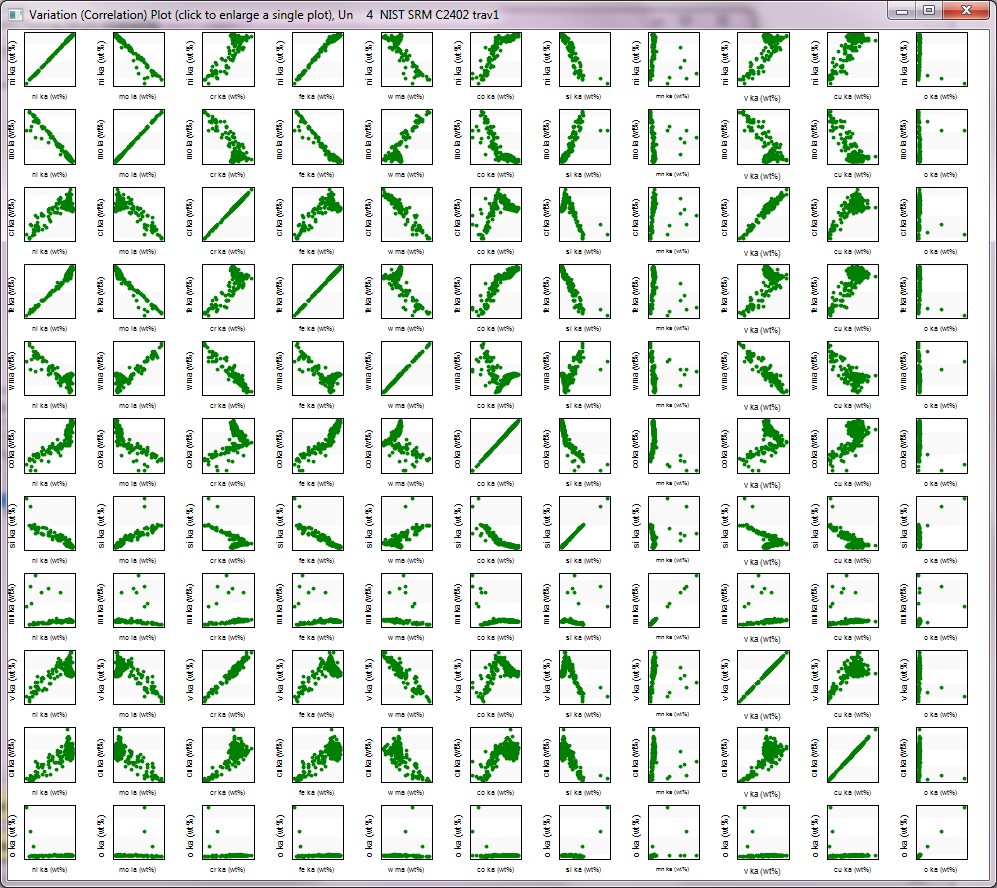
Then you'll see a window with a list of samples and two options. The first to just plot the raw (deadtime, beam drift and off-peak background corrected) element intensities as seen here:


and note that if you click on a single graph, it will expand as seen here:


And second, to plot the actual element concentrations (corrected for matrix, interference, TDI effects, etc., etc.) as seen here:


this again can be expanded by clicking, to contemplate the quantitative element correlations in detail:


You can also display the individual analysis numbers for each data point:


This is ready to download now in v. 12.5.7 from the Probe for EPMA Help | Update Probe for EPMA menu.
« Last Edit: January 24, 2019, 06:43:31 PM by John Donovan »
John J. Donovan, Pres. 
(541) 343-3400

"Not Absolutely Certain, Yet Reliable"

John Donovan

  • Administrator
  • Emeritus
  • *****
  • Posts: 3304
  • Other duties as assigned...
    • Probe Software
Re: Variation (Correlation) Plotting
« Reply #1 on: January 25, 2019, 08:55:18 AM »
In addition, the variation (correlation) plot method also outputs Pearson's Correlation Coefficient as seen here sorted by ranking to the PFE log window:


This may be useful to see which elements are most correlated with each other.
John J. Donovan, Pres. 
(541) 343-3400

"Not Absolutely Certain, Yet Reliable"

Probeman

  • Emeritus
  • *****
  • Posts: 2856
  • Never sleeps...
    • John Donovan
Re: Variation (Correlation) Plotting
« Reply #2 on: January 31, 2019, 06:15:28 PM »
I have absolutely no idea what this might be useful for, but I noticed that it's an option in the Probe for EPMA variation (correlation) plot method.

And that is, in addition to plotting standard and unknown intensities and concentrations as correlation plots, one can also plot *wavescan* intensities as correlation plots as seen here:


And as for the standard and unknown data, one can also click a graph to plot a single element pair:


In the case of wavescans, an element being the element that the spectrometer was peaked on, and the intensities around that emission peak (or perhaps a full range scan?).

Again, I have no idea what this might be useful for, but it's there.
The only stupid question is the one not asked!