Last month Ben Wade posted this interesting observation of a mystery emission line near F Ka in TiO2:
http://probesoftware.com/smf/index.php?topic=4.msg6305#msg6305
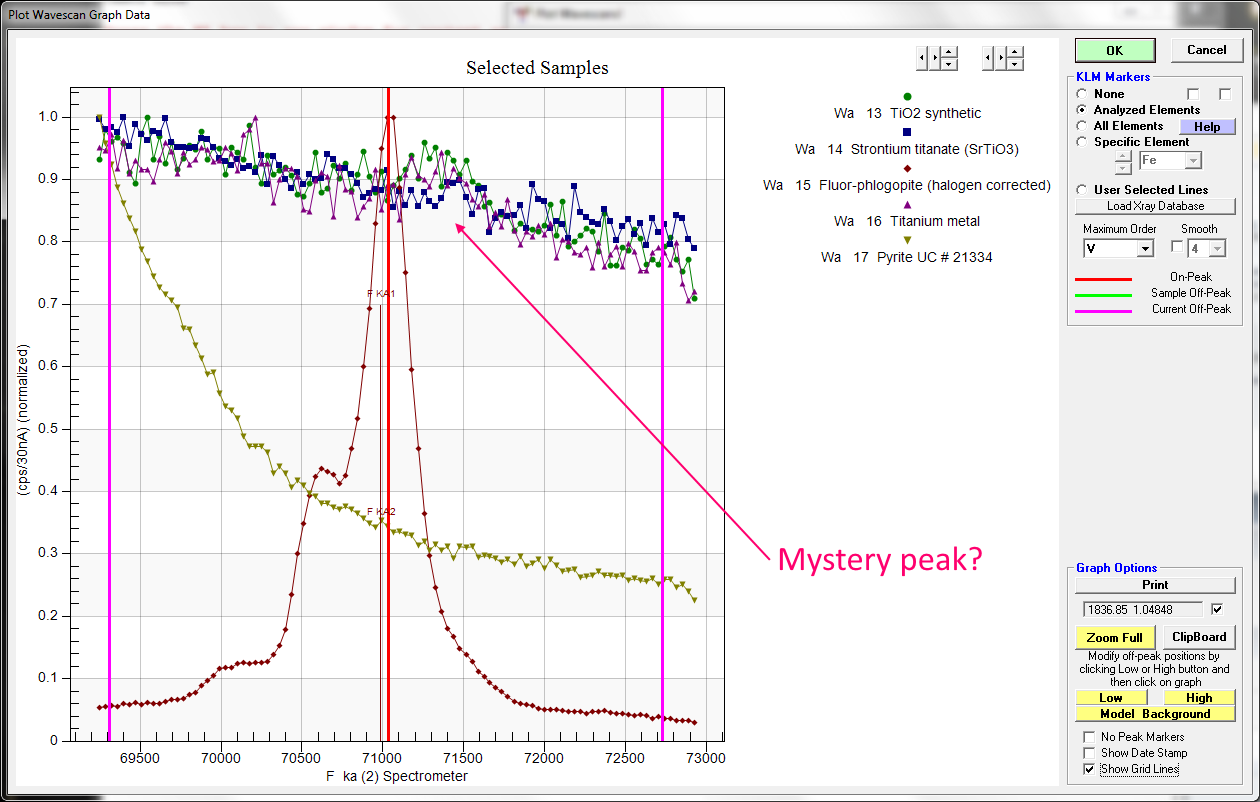
Here is a plot of fluor-phlogopite and TiO2 normalized intensity. I wanted to see if I could say whether the mystery line was a first order emission line or not:

Just eyeballing it I'd say it looks about as wide as the F Ka emission, so yes, I think it is a first order line, but next I'll try some really high precision wavescans.
john
Remember we noticed that we were seeing a very weak peak (possibly Ti) interfering with F Ka, but only for TAP crystals? The above plot scan is from my SX50 which just has normal sized TAP crystals (but using 60 sec per point), so I thought I would try again on my SX100 using the LTAP crystal and double the counting time expecting to see some even nicer looking peaks (we used 15 keV and 50 nA for all scans).
My first attempt surprised my students and I because there was no peak there! Here is using a LTAP crystals and 120 sec per point for TiO2 and Ti metal:
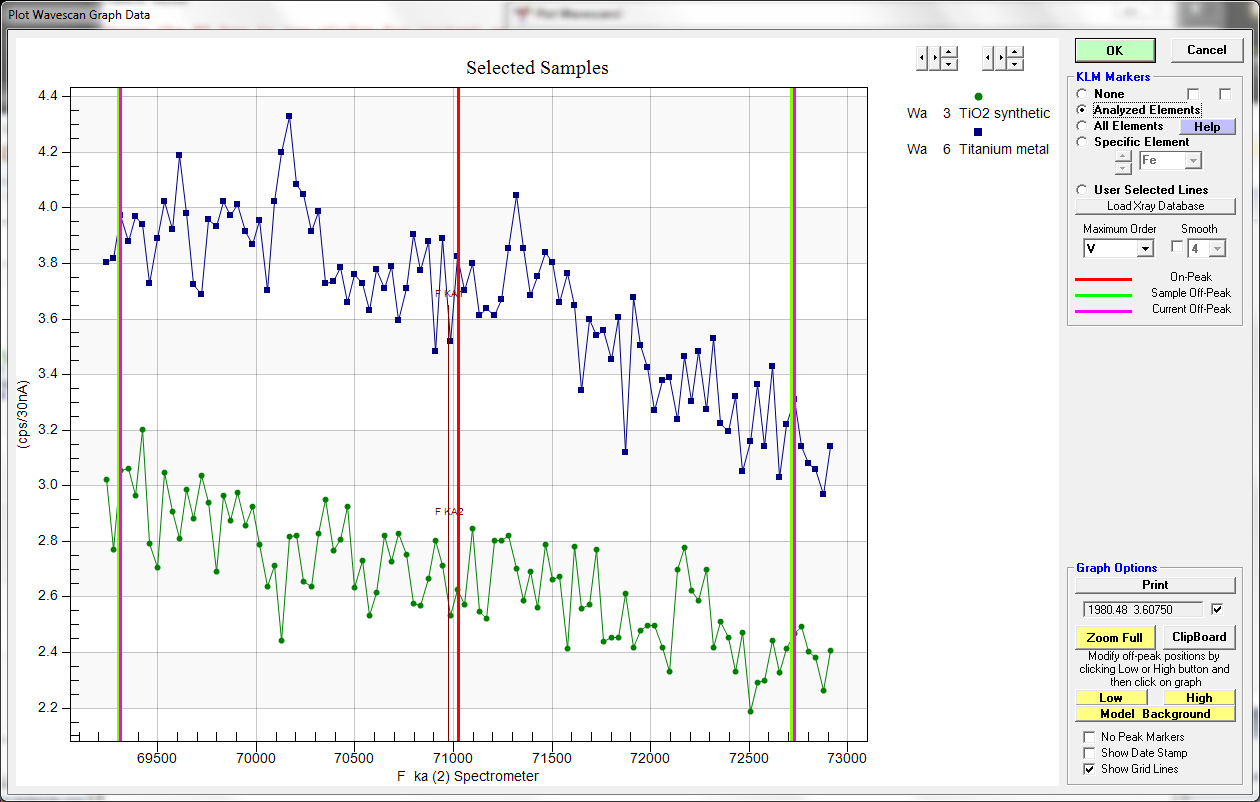
So then I said, OK let's try 300 sec per point, and we got this:

Pretty disappointing. This tells me that this peak is spectrometer/crystal dependent but still related to Ti content. I would guess that some cracks in the Bragg crystal are causing a secondary diffraction from some Ti emission and that is what we are seeing.
Here is a summary of Ti, TiO2, SrTiO3 and FeS2 with fluor-phlogopite as a F ka peak reference:
I expect that my old Sx50 has a more cracked TAP and that is why this mystery peak artifact is more visible even at much shorter counting times.
I don't know what else to say...
john


 You cannot see "members only" boards if you are not a member, so please join the forum!