Author Topic: Odd PHA scans Ti Ka vs. Ni Ka  (Read 5971 times)

John Donovan

  • Administrator
  • Emeritus
  • *****
  • Posts: 3304
  • Other duties as assigned...
    • Probe Software
Odd PHA scans Ti Ka vs. Ni Ka
« on: November 04, 2013, 04:47:42 PM »
All,
I was running some semiconductor devices at low overvoltage (12 keV) for Ni Ka, because I wanted to improve the spatial resolution slightly, when I noticed an oddity of the PHA scans that I cannot understand. Please chime in with any ideas you all might have:

I ran Ti Ka and Ni Ka both on large (LLIF) crystals, both at 1880 bias voltage on pure metals and noticed that I was getting more Ni Ka counts than Ti Ka counts on the standardization as seen here:

Drift array standard intensities (cps/1nA) (background corrected):
ELMXRY:    si ka    o ka   al ka   ti ka   ni ka   au ma   sn la
MOTCRY:  1   PET 4   PC1 2  LTAP 3  LLIF 3  LLIF 1   PET 5   PET
STDASS:      514     913     913     522     528     579     550
          195.49  288.04 1985.67  191.20  249.41   48.50  192.86
          192.90  287.83 1980.98  189.32  247.61   48.47  193.07

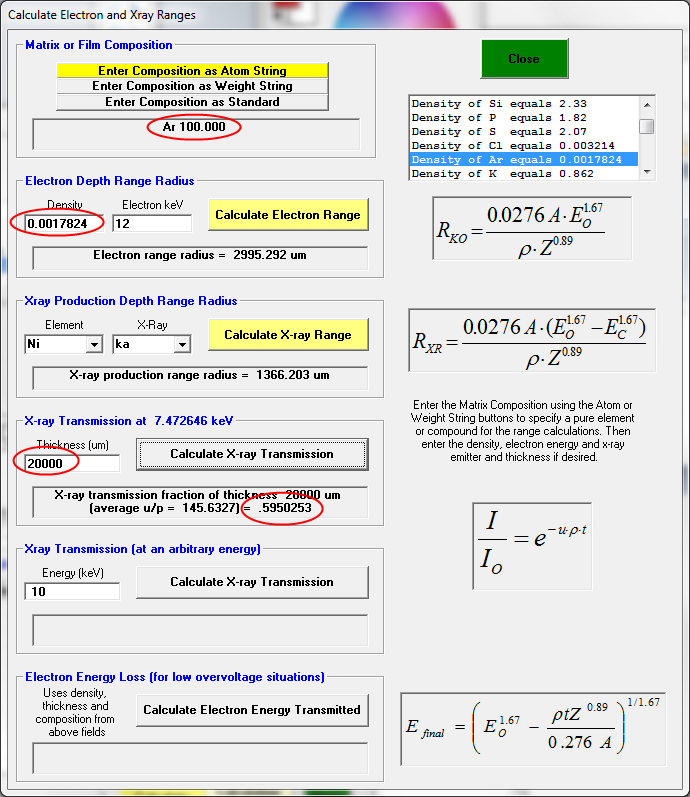
I thought that was odd because I'm running Ti Ka at what might be considered an "ideal" overvoltage, e.g., 2.4 for Ti Ka versus 1.4 for Ni Ka (both run at 12 keV). Also, it is well known that on Cameca Ar detectors, even with the increased 2 atm gas pressure, a significant fraction of high energy x-rays will go through the gas absorption path without getting detected. To be fair, because they are flow detectors as opposed to sealed detectors, they are very clean and low noise, but if one assumes an 2 cm absorption path of Ar at 1 atm, about 60% of the Ni ka x-rays transmit through Ar as seen here in this dialog from our CalcZAF utility:


and at 2 atm, there is still almost 40% of the Ni ka x-rays are not absorbed by the detector as seen here:


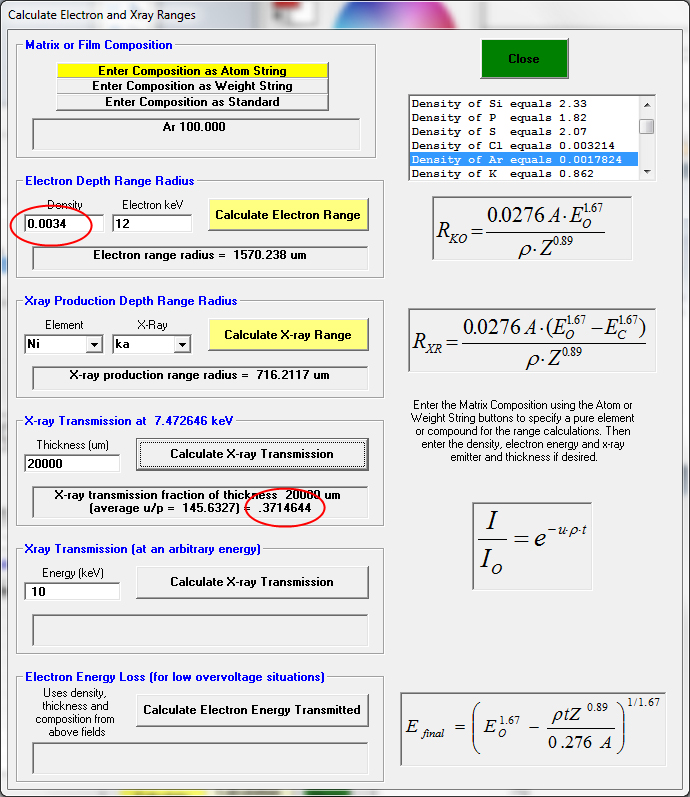
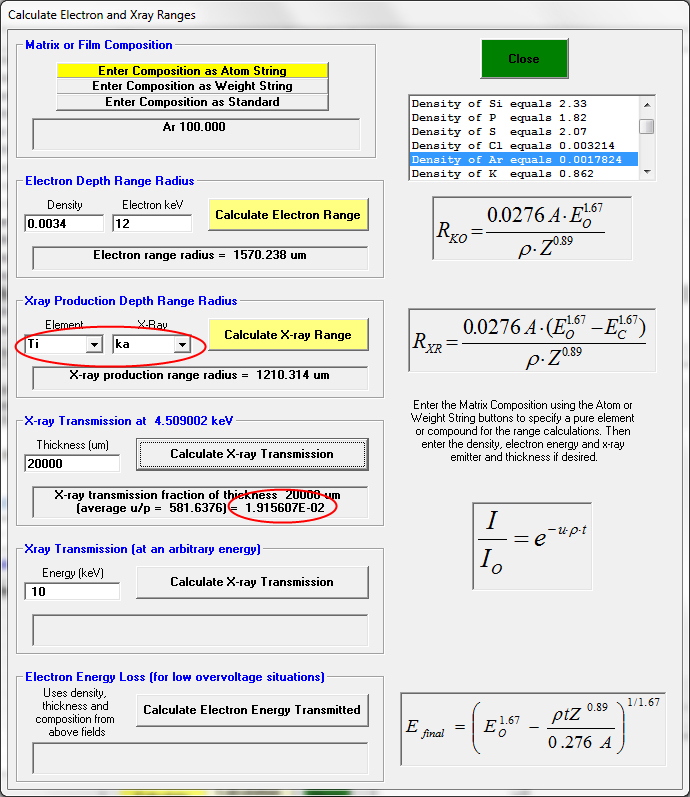
This makes a lot of sense because the MAC for Ti Ka in Ar is 581 and the MAC for Ni Ka in Ar is only 145. In fact, if we do the same calculation for Ti Ka in CalcZAF, we see that almost no Ti Ka x-rays are transmitted through the detector and instead get counted properly:


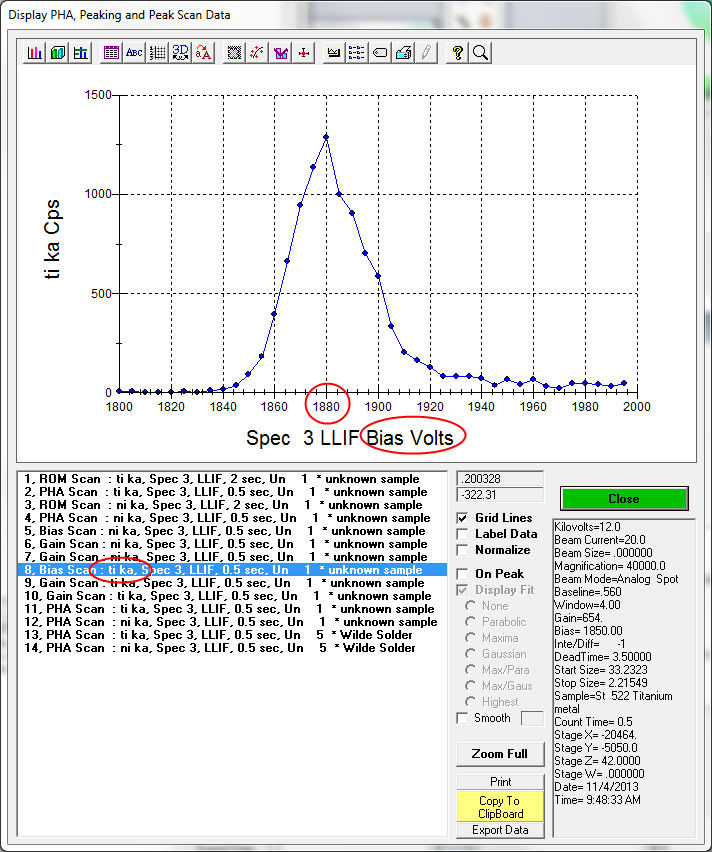
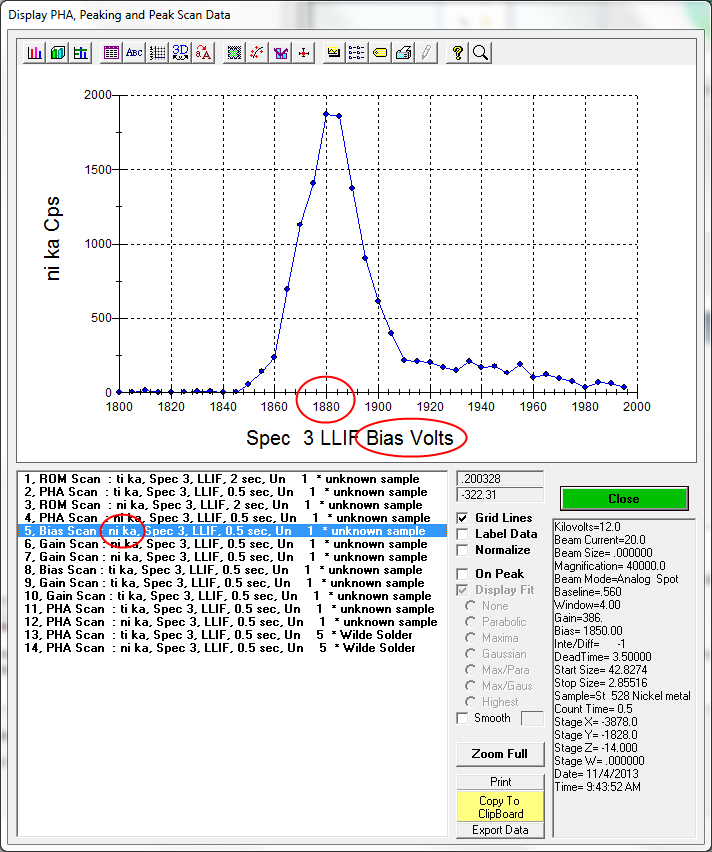
So, about those PHA scans? Well they agree with the standardization data. Basically we ran bias scans on both elements and they both showed an optimum voltage of around 1880 volts as seen here for Ti Ka:


and here for Ni Ka:


The optimum gain settings from the gain scans showed 820 for Ti Ka and 490 for Ni Ka, also not unexpected as Ni Ka is more energetic and requires less gain. The final PHA scans with these settings are here for Ti Ka:
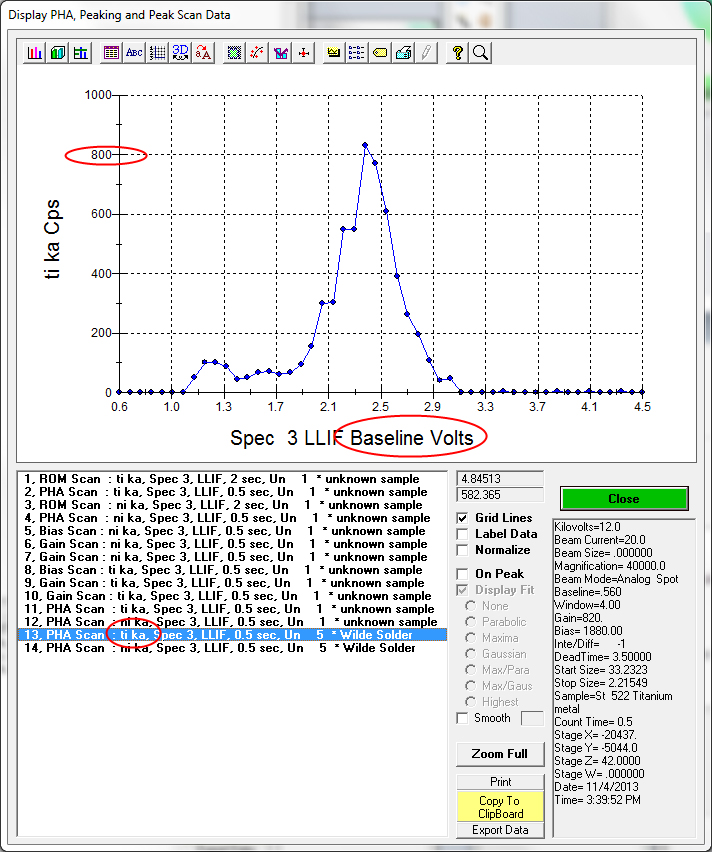


and here for Ni Ka:


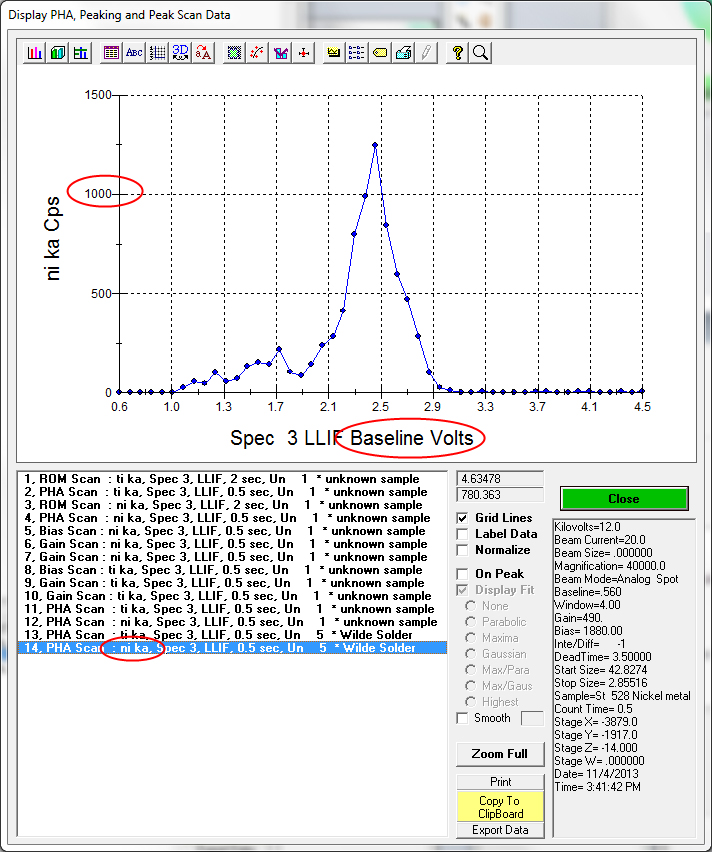
So both the standardiations and PHA scans show that we are getting a better signal from Ni Ka than Ti Ka on LLIF. I do not understand this result and would welcome any speculation.

Thanks!

Here's one idea: could the difference in the Bragg spectrometer positions change the geometric efficiency of the two elements by that much?  I mean, the sin thetas are *not* that much different:

ELEM:      ti      ni
ONPEAK 68220.0 41134.0
OFFSET 71.3984 73.0977
HIPEAK 68705.8 42319.9
LOPEAK 67734.2 40276.7
HI-OFF 485.805 1185.90
LO-OFF -485.80 -857.30
« Last Edit: December 19, 2018, 08:30:07 AM by John Donovan »
John J. Donovan, Pres. 
(541) 343-3400

"Not Absolutely Certain, Yet Reliable"

Mike Jercinovic

  • Professor
  • ****
  • Posts: 92
    • UMass Geosciences Microprobe-SEM Facility
Re: Odd PHA scans Ti Ka vs. Ni Ka
« Reply #1 on: November 05, 2013, 01:39:03 PM »
John,
Yes, the geometric efficiency can produce a large count difference (if I recall, this is the major contribution to the Lorentz factor in x-ray diffraction), which has to consider both the distance and size of the crystal that intersects the cone of x-rays emerging into the spectrometer from the sample, and also the distance from the diffracting crystal to the detector (obviously influenced also by the size of the crystal and the size of the detector entrance window and their angles to each other), but there are other contributing factors.  Attached is a plot of such effects with PET sans peaks on various spectrometers and with various crystal dimensions, where we were comparing background curvature (note everything is intensity scaled so as to directly compare).  But it's not just geometry -note that the low pressure counters produce lower slope and curvature through this range.  Note also that there is a contribution of absorption through the beryllium entrance window that accounts for a bit of this.  So, in addition to this, Thomson scattering - the coherent scattering that results in the x-rays emerging from the diffracting crystal is more intense at lower angles (more intense), due to the high electron density of the lattice planes, at least I think that's right.
How much difference is there in the net intensities?

Mike J.

Edit by John: Mike, that's a really nice graph!  Do you have a graph without the intensities scaled?  The net intensities are at the top of my post above highlighted in red...
« Last Edit: November 05, 2013, 01:45:48 PM by John Donovan »

John Donovan

  • Administrator
  • Emeritus
  • *****
  • Posts: 3304
  • Other duties as assigned...
    • Probe Software
Re: Odd PHA scans Ti Ka vs. Ni Ka
« Reply #2 on: November 13, 2013, 05:44:44 PM »
I can't be certain but it is very likely that the difference in intensity between Ti and Ni I documented above is because ever since we replaced the crystal flipping motor on this spectrometer it is off from the theoretical peak positions by 200 to 300 points, so we know the spectrometer is not properly aligned ever since then.

So my feeling is that at the smaller sin theta positions the spectrometer alignment isn't as critical for maximum intensity, but as the spectrometer crystal moves to higher sin thetas the alignment becomes more critical. Hence we are seeing more counts for Ni Ka than Ti Ka, so I guess we'd better get our crystal re-aligned.

Does anyone have a crystal alignment procedure for the Sx100?
John J. Donovan, Pres. 
(541) 343-3400

"Not Absolutely Certain, Yet Reliable"

Mike Jercinovic

  • Professor
  • ****
  • Posts: 92
    • UMass Geosciences Microprobe-SEM Facility
Re: Odd PHA scans Ti Ka vs. Ni Ka
« Reply #3 on: November 13, 2013, 09:00:59 PM »
A few hundred sin theta units in the dynamic offset will not necessarily result in non-linearity of the X-ray focus.  This is something you have to test through the full range.  The crystal focus procedure is the same as with the SX50 etc.  Pretty unlikely that the rail has been compromised, so the crystal and detector support arm will be the things to iterate.  Start by setting the dynamic offset to zero, then see if the peak position offsets are linear through the full range.  What you want to achieve is to get the intensities as high as you can with something energetic enough to work with when the spectrometer is open plus getting the positional (peak position) offsets similar through the full spectrometer range.  Once you have that, re-test the spectrometer and verify to see what the real dynamic offset ends up being.  I have some notes on how to strategize this but I am off to visit potential colleges in Vermont with my nephew for the next few days.  No matter what, the best procedure for aligning a spectrometer is to call Edgar.

Mike J.

Mike Jercinovic

  • Professor
  • ****
  • Posts: 92
    • UMass Geosciences Microprobe-SEM Facility
Re: Odd PHA scans Ti Ka vs. Ni Ka
« Reply #4 on: November 13, 2013, 09:21:50 PM »
John,
Here (attached) is a plot of the PET comparison without intensity scaling.  BW version - I have it in color somewhere, but too tired to look for it right now...