Author Topic: Wish List For CalcImage  (Read 32034 times)

Probeman

  • Emeritus
  • *****
  • Posts: 2836
  • Never sleeps...
    • John Donovan
Re: Wish List For CalcImage
« Reply #15 on: November 15, 2016, 11:33:28 AM »
Hi, would it be possible to add raw count maps to the traverse (slice) function output function in CalcImage? Currently it has only the processed maps as options for slice/polygon/multiple strip. 

It is possible.  Can you wait until later this week?
john
The only stupid question is the one not asked!

Anette von der Handt

  • Global Moderator
  • Professor
  • *****
  • Posts: 351
    • UMN Probelab
Re: Wish List For CalcImage
« Reply #16 on: November 15, 2016, 12:31:05 PM »
Sure. It is not that urgent, I just was showing CalcImage to a user and realized that doing traverse on his raw maps would not be possible (I would just frankenstein an mdb together if it was urgent).

Thanks in advance.
Against the dark, a tall white fountain played.

John Donovan

  • Administrator
  • Emeritus
  • *****
  • Posts: 3275
  • Other duties as assigned...
    • Probe Software
Re: Wish List For CalcImage
« Reply #17 on: November 16, 2016, 10:08:32 PM »
Sure. It is not that urgent, I just was showing CalcImage to a user and realized that doing traverse on his raw maps would not be possible (I would just frankenstein an mdb together if it was urgent).

Hi Anette,
I took a look at your request to add slice, polygon and strip output of the raw data maps to CalcImage tonight, and I found that there is an issue: I cannot add any more menu items to the CalcImage app! It's a limitation of the compiler! Now of course I could re-write things to use a dialog and checkboxes for presentation output, but that will take a considerable amount of work... so in the meantime time here is an alternative that is not so "frankenstein".  ;)

First of all, yes there is currently no slice, polygon or strip output of the raw intensity maps (just for the quant, oxide, atomic, detection limits, etc. maps), but there is slice, polygon and strip output for net intensity maps... maybe that is good enough?  Why the heck do you want to look at raw data anyway!   :o

But here is my less frankenstein suggestion: take your quant slice script, for example open any .bas script output by CalcImage and here is what you will see near the top of the file:

Dim iMax As Integer
iMax% = 6

ReDim FileArray(1 to iMax%) as String
FileArray$(1) = "Mg diffusion-2_00491_SP1_O_PC1__Quant"
FileArray$(2) = "Mg diffusion-2_00491_SP2_Al_LTAP__Quant"
FileArray$(3) = "Mg diffusion-2_00491_SP3_Gd_LLIF__Quant"
FileArray$(4) = "Mg diffusion-2_00491_SP4_Mg_TAP__Quant"
FileArray$(5) = "Mg diffusion-2_00491_SP5_Sn_PET__Quant"
FileArray$(6) = "Mg,Al,Gd,Sn,O_09-13-2012_Mg diffusion-2_00491__Total_Quant"

ReDim ZLabel(1 to iMax%) as String

ZLabel$(1) = "O Wt%"
ZLabel$(2) = "Al Wt%"
ZLabel$(3) = "Gd Wt%"
ZLabel$(4) = "Mg Wt%"
ZLabel$(5) = "Sn Wt%"
ZLabel$(6) = "Total Wt%"

All you need to do is edit the script, like this:

Dim iMax As Integer
iMax% = 5

ReDim FileArray(1 to iMax%) as String
FileArray$(1) = "Mg diffusion-2_00491_SP1_O_PC1_"
FileArray$(2) = "Mg diffusion-2_00491_SP2_Al_LTAP_"
FileArray$(3) = "Mg diffusion-2_00491_SP3_Gd_LLIF_"
FileArray$(4) = "Mg diffusion-2_00491_SP4_Mg_TAP_"
FileArray$(5) = "Mg diffusion-2_00491_SP5_Sn_PET_"

ReDim ZLabel(1 to iMax%) as String

ZLabel$(1) = "O cps/nA"
ZLabel$(2) = "Al cps/nA"
ZLabel$(3) = "Gd cps/nA"
ZLabel$(4) = "Mg cps/nA"
ZLabel$(5) = "Sn cps/nA"

Note that I changed the iMax parameter from 6 to 5 because there is no "Total" map for the raw intensities!  I also edited the file names for the raw intensity files (just an underscore after the crystal name), and the labels from Wt% to cps/nA.

When this edited script is run in the Surfer Scripter app, this is what you get (see attached images below).  Hopefully this is a reasonable method for you.
john
« Last Edit: November 16, 2016, 10:21:22 PM by John Donovan »
John J. Donovan, Pres. 
(541) 343-3400

"Not Absolutely Certain, Yet Reliable"

Anette von der Handt

  • Global Moderator
  • Professor
  • *****
  • Posts: 351
    • UMN Probelab
Re: Wish List For CalcImage
« Reply #18 on: November 17, 2016, 07:12:53 AM »
Great! I give this a try.

Thanks!
Anette
Against the dark, a tall white fountain played.

Probeman

  • Emeritus
  • *****
  • Posts: 2836
  • Never sleeps...
    • John Donovan
Re: Wish List For CalcImage
« Reply #19 on: November 17, 2016, 08:41:20 AM »
Great! I give this a try.

Thanks!
Anette

It occurs to me just now, that if one wants to perform slice/polygon/strip output of raw intensity maps, an even easier edit, is to utilize the existing net intensity slice/polygon/strip output script.  Rename the output script .bas file to something else, e.g., Mg,Al,Gd,Sn,O_09-13-2012_Mg diffusion-2_00491__Raw_Slice.bas, then just edit the grd filenames since the net intensity script won't have the total file to deal with and the z data labels are *already* "cps/nA"...
john
The only stupid question is the one not asked!

Dan R

  • Professor
  • ****
  • Posts: 82
    • GE Research Materials Characterization
Re: Wish List For CalcImage
« Reply #20 on: February 27, 2017, 06:18:19 AM »
Two requests (I am currently using 11.7.3):

1. For maps containing multiple WDS passes, please add an option to align map passes using BSE or SE images BEFORE doing mapping calculations. This would result in cutting off some of the pixels, but it should greatly help reduce artifacts around phase boundaries. For example, carbides surrounded by a metal matrix...

2. During CalcImage processing, please allow the user to specify a different output directory from the MDB database file used for quant/backgrounds. This would make file management easier and save disk space... currently if I want to have a separate folder for each quant map, I need to copy in the original MDB data base file.

Thanks!
Dan

John Donovan

  • Administrator
  • Emeritus
  • *****
  • Posts: 3275
  • Other duties as assigned...
    • Probe Software
Re: Wish List For CalcImage
« Reply #21 on: February 27, 2017, 12:56:43 PM »
Two requests (I am currently using 11.7.3):
Hi Dan,
Please update to v. 11.8.3!   Lots of cool new stuff and improved behaviors:

http://probesoftware.com/smf/index.php?topic=40.0

1. For maps containing multiple WDS passes, please add an option to align map passes using BSE or SE images BEFORE doing mapping calculations. This would result in cutting off some of the pixels, but it should greatly help reduce artifacts around phase boundaries. For example, carbides surrounded by a metal matrix...

This is a Probe Image request I think?

If I understand what you are asking for, the good news is that Brian and I working with Paul Carpenter and Gareth Seward have a solution coming soon.  I will send you our spec document we are working on if you like.

2. During CalcImage processing, please allow the user to specify a different output directory from the MDB database file used for quant/backgrounds. This would make file management easier and save disk space... currently if I want to have a separate folder for each quant map, I need to copy in the original MDB data base file.

Are you asking that instead of using Windows Explorer to copy the necessary files for different output types to separate sub folders, you'd like something along the lines of a "clone" menu in CalcImage to make a sub folder and copy the required files for additional/subsequent output of images and maps?
john
« Last Edit: February 27, 2017, 01:21:56 PM by John Donovan »
John J. Donovan, Pres. 
(541) 343-3400

"Not Absolutely Certain, Yet Reliable"

John Donovan

  • Administrator
  • Emeritus
  • *****
  • Posts: 3275
  • Other duties as assigned...
    • Probe Software
Re: Wish List For CalcImage
« Reply #22 on: March 02, 2017, 06:21:11 PM »

1. For maps containing multiple WDS passes, please add an option to align map passes using BSE or SE images BEFORE doing mapping calculations. This would result in cutting off some of the pixels, but it should greatly help reduce artifacts around phase boundaries. For example, carbides surrounded by a metal matrix...

2. During CalcImage processing, please allow the user to specify a different output directory from the MDB database file used for quant/backgrounds. This would make file management easier and save disk space... currently if I want to have a separate folder for each quant map, I need to copy in the original MDB data base file.

Hi Dan,
If you update PFE and open the CalcImage Log Window (from the Window menu), you will see this new menu for cloning the current project to another folder. Say for performing multiple polygon extractions from the same map.


The only thing I should mention about this feature is that in the Browse folder dialog, first right click where you want the new folder to be, then click the New | Folder sub menu and name the folder, select it and click OK.  Or just select an existing folder.

I'm still thinking about your idea for a visual align maps and crop feature...  it's a cool idea but want to think about it a bit.
john
« Last Edit: April 14, 2020, 12:28:54 PM by John Donovan »
John J. Donovan, Pres. 
(541) 343-3400

"Not Absolutely Certain, Yet Reliable"

John Donovan

  • Administrator
  • Emeritus
  • *****
  • Posts: 3275
  • Other duties as assigned...
    • Probe Software
Re: Wish List For CalcImage
« Reply #23 on: June 01, 2017, 12:37:49 PM »
Hi Dan,
...
I'm still thinking about your idea for a visual align maps and crop feature...  it's a cool idea but want to think about it a bit.
john

In case any one missed it, the Align and Crop feature for aligning multiple spectrometer passes for stage or sample drift is described here:

https://probesoftware.com/smf/index.php?topic=1153.0

It's pretty cool if I do say so myself!    :D
john
« Last Edit: December 06, 2018, 05:42:11 PM by John Donovan »
John J. Donovan, Pres. 
(541) 343-3400

"Not Absolutely Certain, Yet Reliable"

John Donovan

  • Administrator
  • Emeritus
  • *****
  • Posts: 3275
  • Other duties as assigned...
    • Probe Software
Re: Wish List For CalcImage
« Reply #24 on: June 24, 2017, 08:57:57 AM »
Dave Wark recently asked if I could modify the analytical sensitivity calculation for x-ray maps in CalcImage.  This analytical sensitivity is from Goldstein et al. as described here:

http://probesoftware.com/smf/index.php?topic=93.msg341#msg341

Originally during the saving of the map GRD files I would "filter" the analytical sensitivity calculation so that pixels that represent less than 1 wt.% concentrations would be "blanked" so they would be ignored when plotting them in the Surfer app as shown here:


The reason for this is simple: the analytical sensitivity values (in relative percent) start to "blow up" as the concentrations approach zero, making visualization of the data difficult. If one did not blank these pixels, one would obtain this result when the data is plotted in Surfer:


Notice that many pixels (those less than 1 % concentrations) show analytical sensitivity values over +/- 10^6 percent!  But apparently Dave has some calculations he wants to utilize these values for, so I added some new checkboxes in the quantitative parameters dialog as shown here:


The default (unchecked) is to blank pixels which represent concentrations under 1 wt.%. This results in the original behavior shown in the first plot above. But if you check the box as shown here:


You get the analytical sensitivity data unfiltered for calculation purposes. We'll discuss the effect of the additional "skip blanking" flag on detection limit calculations next.
« Last Edit: April 14, 2020, 12:09:37 PM by John Donovan »
John J. Donovan, Pres. 
(541) 343-3400

"Not Absolutely Certain, Yet Reliable"

John Donovan

  • Administrator
  • Emeritus
  • *****
  • Posts: 3275
  • Other duties as assigned...
    • Probe Software
Re: Wish List For CalcImage
« Reply #25 on: June 24, 2017, 09:06:15 AM »
For the detection limit calculation I originally did not blank any pixels, but I wanted the calculation to be symmetrical with the analytical sensitivity calculation, and besides I realized there is a benefit for blanking the detection limit calculation pixels also.

That is, we really don't care about the detection limits for pixels whose concentrations are very large, do we? What we care about for detection limits are low concentration pixels. So I modified the code to blank pixels (by default) if the pixel concentrations are larger than 10 wt.% as seen here:


The value of this method is that the eye can know instantly if the pixel is a low concentration or not for that element, so we can know which areas of the map to focus our attention on.  And of course if one really wants to see the detection limits for all pixels, including high concentration pixels, one can simply check the "skip blanking" flag and get this output for all pixels:


Please let me know what you all think.
john
« Last Edit: April 14, 2020, 11:51:45 AM by John Donovan »
John J. Donovan, Pres. 
(541) 343-3400

"Not Absolutely Certain, Yet Reliable"

John Donovan

  • Administrator
  • Emeritus
  • *****
  • Posts: 3275
  • Other duties as assigned...
    • Probe Software
Re: Wish List For CalcImage
« Reply #26 on: September 12, 2018, 10:11:17 AM »
Andrew Mott at Texas A&M noticed recently that although CalcImage was correctly calculating and outputting a specified element by difference for the elemental weight percent and atomic percent .DAT files, the program was only outputting quant x-ray maps for elemental weight percents for the element by difference, but not quant x-ray maps for atomic percent element by difference.

And sure enough when we looked in the code and it's wasn't exporting the .GRD file properly. So we modified the code and now it properly outputs .GRD files for export to Surfer for elemental, atomic and oxide weight percents for the element by difference as seen here for atomic percents:


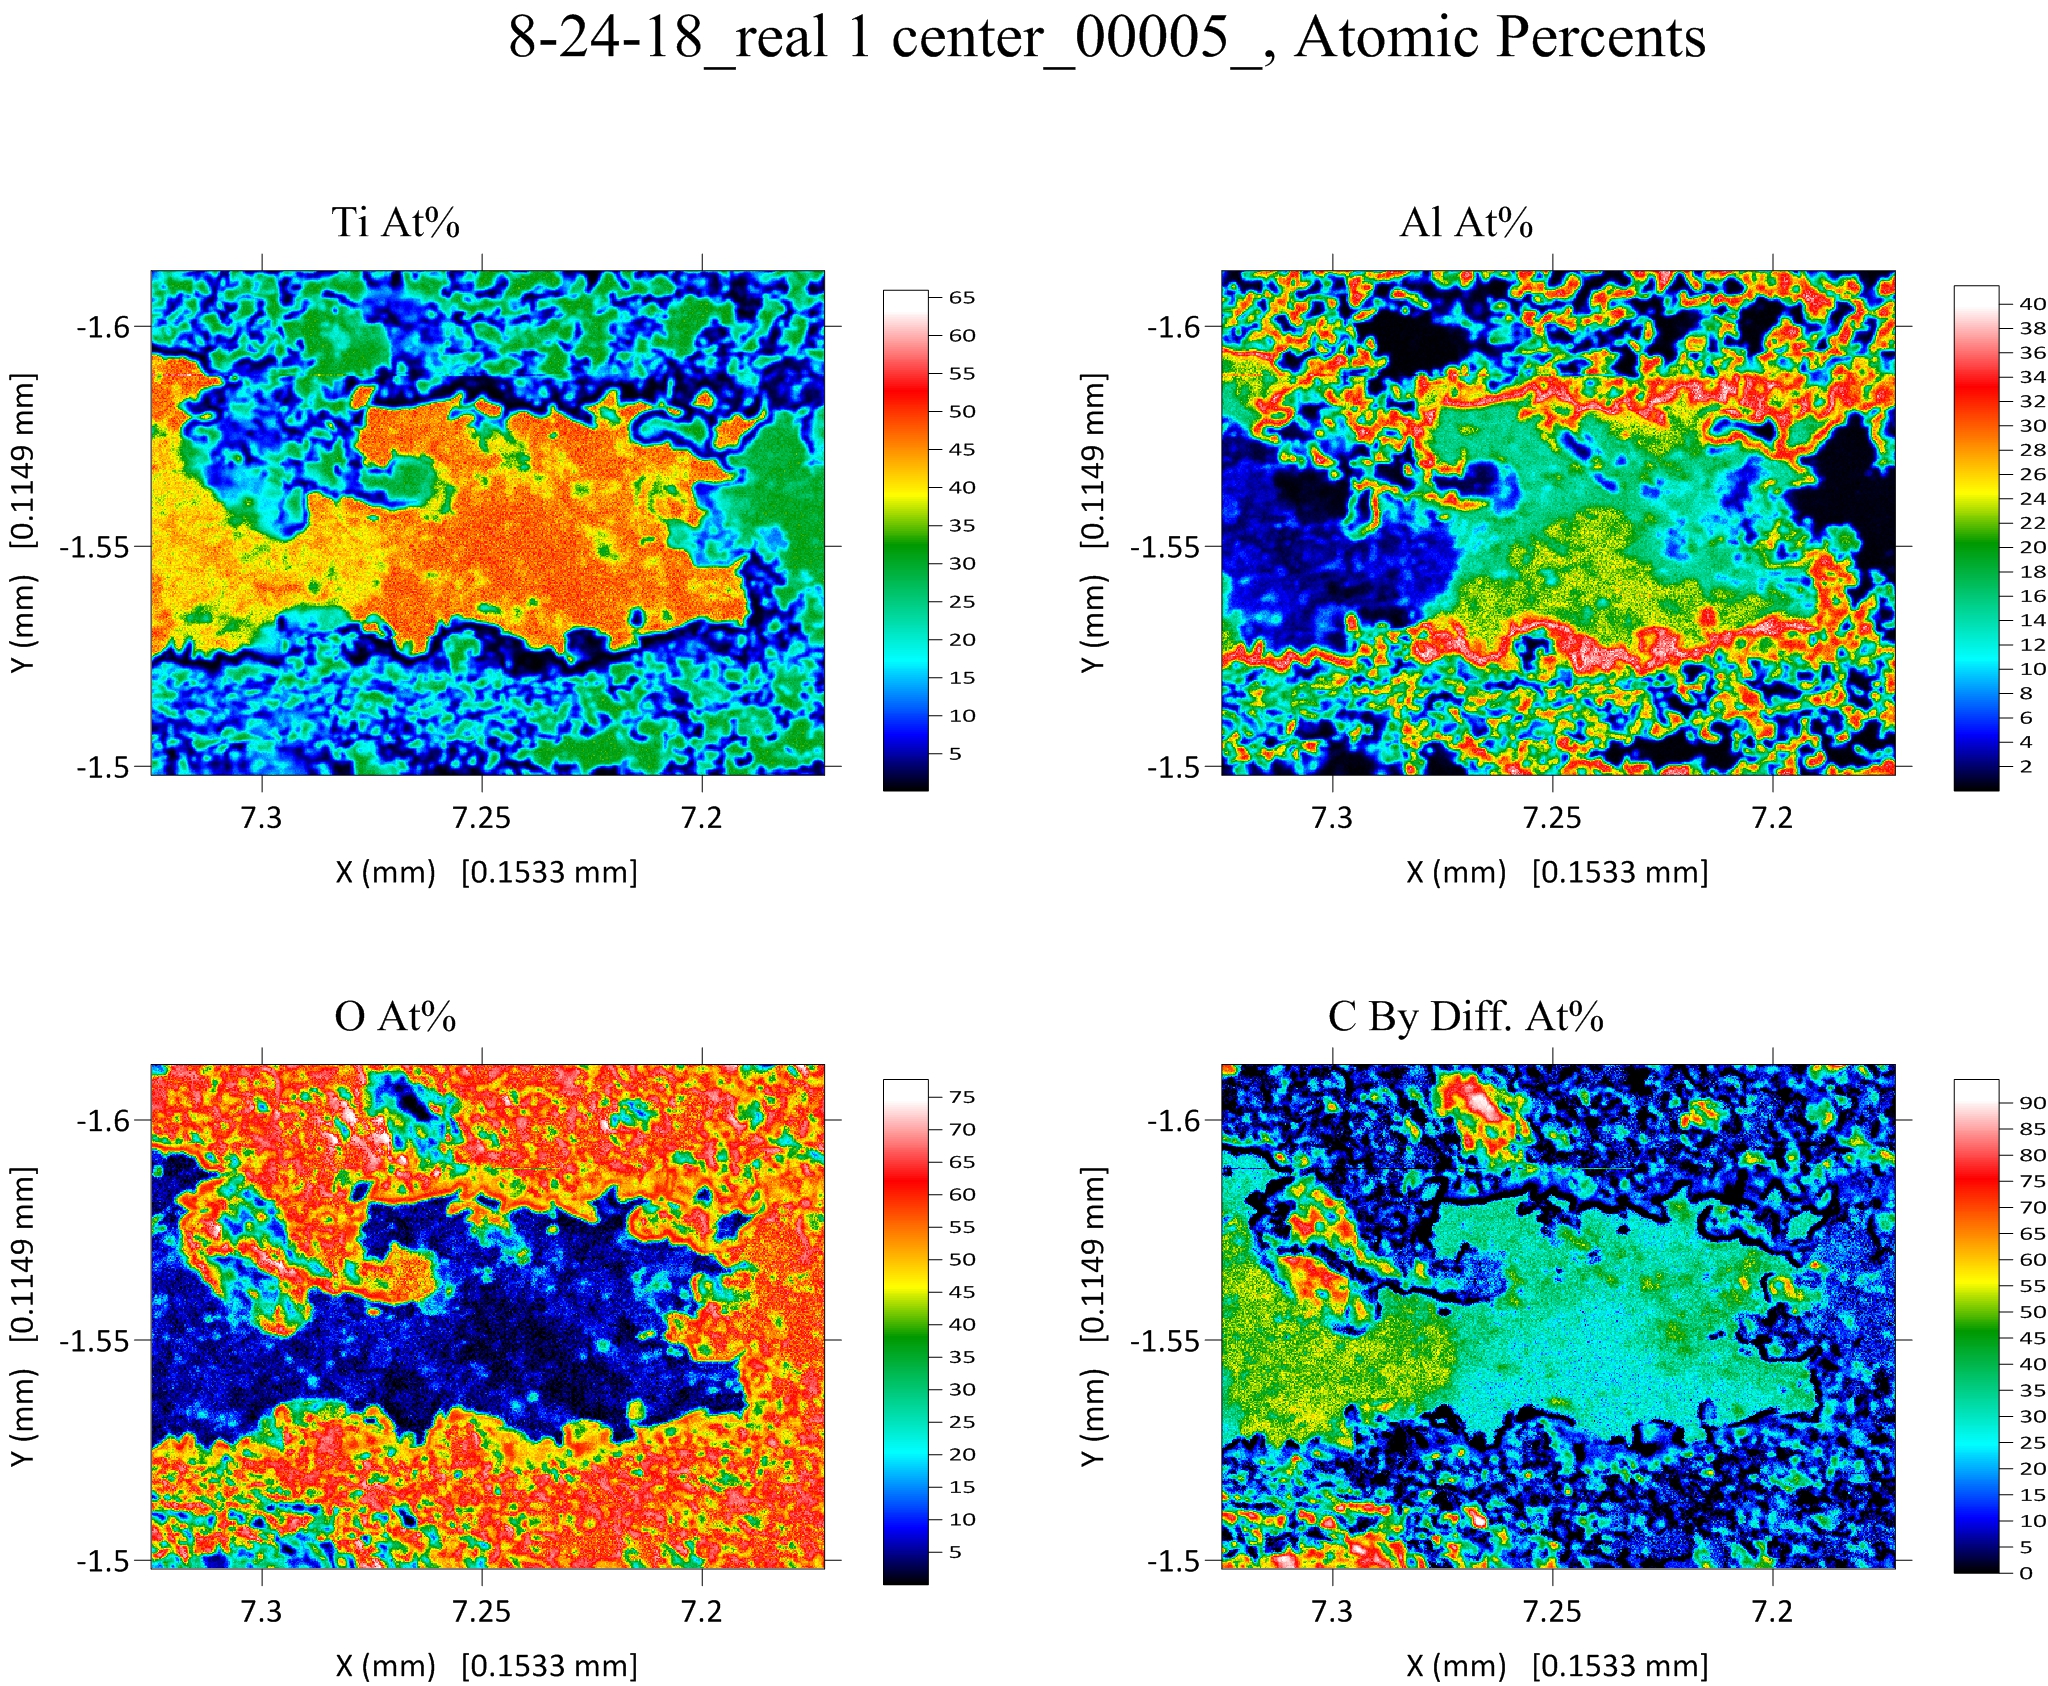
This modified code now also outputs maps for the totals, oxygen by stoichiometry, excess oxygen and mentioned already, the element specified by difference.

However, when exporting the maps to Surfer, the code automatically suppresses the total concentrations maps for atomic and element by difference output since those maps are always going to be pixels all at 100%.

One caveat: because the new code now outputs separately named .GRD files for the totals, oxygen by stoichiometry, excess oxygen and the element specified by difference elements, for both the atomic and oxide weight percent output, if you have previously calculated runs containing a totals and/or oxygen by stoichiometry quant maps and you are using atomic or oxide output, you will need to re-calculate the quant to create the newly named atomic and oxide totals and/or oxygen by stoichiometry quant maps.  That is if you want to re-export the output to Surfer. 

Sorry for any trouble this causes anyone.  Of course, new quant map calculations in CalcImage will proceed automatically, as will any previously calculated map outputs that just used elemental weight percent output.

We think (hope) this is good for everyone but let us know what you think.
« Last Edit: September 12, 2018, 12:45:38 PM by John Donovan »
John J. Donovan, Pres. 
(541) 343-3400

"Not Absolutely Certain, Yet Reliable"

Anette von der Handt

  • Global Moderator
  • Professor
  • *****
  • Posts: 351
    • UMN Probelab
Re: Wish List For CalcImage
« Reply #27 on: March 03, 2020, 04:21:28 PM »
Hi John,

at one point, CalcImage allowed map math/RGB for the raw intensity maps (or any map that was open in the window). After an update, it now requires the classification file which I only get when quantifying the maps (afaik). Would it be possible to implement the old option in CalcImage again (in addition to the current function that I like too)? It was quite useful at times for initial ad-hoc processing.
Against the dark, a tall white fountain played.

John Donovan

  • Administrator
  • Emeritus
  • *****
  • Posts: 3275
  • Other duties as assigned...
    • Probe Software
Re: Wish List For CalcImage
« Reply #28 on: March 04, 2020, 11:21:07 AM »
Hi John,

at one point, CalcImage allowed map math/RGB for the raw intensity maps (or any map that was open in the window). After an update, it now requires the classification file which I only get when quantifying the maps (afaik). Would it be possible to implement the old option in CalcImage again (in addition to the current function that I like too)? It was quite useful at times for initial ad-hoc processing.

Yeah, there were a lot of problems with the old method of just using various images already loaded into the CalcImage main window.    By using the .DAT file output, there is a lot more flexibility for quant calculations, but as you say, one needs to quant the maps first:

https://probesoftware.com/smf/index.php?topic=519.msg8023#msg8023

If you only want to RGB some random images, you can easily utilize ImageJ and probably more than a few other commercial apps.
« Last Edit: March 04, 2020, 05:18:02 PM by John Donovan »
John J. Donovan, Pres. 
(541) 343-3400

"Not Absolutely Certain, Yet Reliable"

Anette von der Handt

  • Global Moderator
  • Professor
  • *****
  • Posts: 351
    • UMN Probelab
Re: Wish List For CalcImage
« Reply #29 on: March 04, 2020, 02:33:49 PM »
It was more the "Map math" that I am missing, for combining multiple spectrometers or doing quick ratio-ing of some elements.
Against the dark, a tall white fountain played.